 Open Access Article
A fluorine-18 labeled radiotracer for PET imaging of γ-glutamyltranspeptidase in living subjects†
Dingyao Gao‡
ab,
Yinxing Miao‡b,
Siqin Ye‡b,
Chunmei Luab,
Gaochao Lvb,
Ke Lib,
Chunjing Yu*c,
Jianguo Lin *b and
Ling Qiu*ab
aSchool of Chemical and Material Engineering, Jiangnan University, Wuxi 214122, China
bNHC Key Laboratory of Nuclear Medicine, Jiangsu Key Laboratory of Molecular Nuclear Medicine, Jiangsu Institute of Nuclear Medicine, Wuxi 214063, China. E-mail: qiuling@jsinm.org; linjianguo@jsinm.org
cDepartment of Nuclear Medicine, Affiliated Hospital of Jiangnan University, Wuxi 214062, China. E-mail: ycj_wxd1978@163.com
First published on 24th May 2021
Abstract
The expression level of γ-glutamyltranspeptidase (GGT) in some malignant tumors is often abnormally high, while its expression is low in normal tissues. Therefore, GGT is considered as a key biomarker for cancer diagnosis. Several GGT-targeting fluorescence probes have been designed and prepared, but their clinical applications are limited due to their shallow tissue penetration. Considering the advantages of positron emission tomography (PET) such as high sensitivity and deep tissue penetration, we designed a novel PET imaging probe for targeted monitoring of the expression of GGT in living subjects, ([18F]γ-Glu-Cys-PPG(CBT)-AmBF3)2, hereinafter referred to as ([18F]GCPA)2. The non-radioactive probe (GCPA)2 was synthesized successfully and [18F]fluorinated rapidly via the isotope exchange method. The radiotracer ([18F]GCPA)2 could be obtained within 0.5 h with the radiochemical purity over 98% and the molar activity of 10.64 ± 0.89 GBq μmol−1. It showed significant difference in cellular uptake between GGT-positive HCT116 cells and GGT-negative L929 cells (2.90 ± 0.12% vs. 1.44 ± 0.15% at 4 h, respectively). In vivo PET imaging showed that ([18F]GCPA)2 could quickly reach the maximum uptake in tumor (4.66 ± 0.79% ID g−1) within 5 min and the tumor-to-muscle uptake ratio was higher than 2.25 ± 0.08 within 30 min. Moreover, the maximum tumor uptake of the control group co-injected with the non-radioactive probe (GCPA)2 or pre-treated with the inhibitor GGsTop decreased to 3.29 ± 0.24% ID g−1 and 2.78 ± 0.32% ID g−1 at 10 min, respectively. In vitro and in vivo results demonstrate that ([18F]GCPA)2 is a potential PET probe for sensitively and specifically detecting the expression level of GGT.
Introduction
γ-Glutamyltranspeptidase (GGT) is a member of the N-terminal nucleophile hydrolases anchored to the cell membrane.1 It is vital in the γ-glutamine cycle of glutathione synthesis and degradation, and can functionally catalyze GSH transformation into other amino acids or peptides via cleaving the γ-glutamate (γ-Glu) bond.2–5 GGT binds glutathione as a donor substrate and initially forms a γ-glutamyl enzyme which reacts with a water molecule or an acceptor substrate (dipeptides, L-methionine, L-alanine, L-glutamine and L-cystine) to form glutamate or a new isopeptide bond, respectively, thus regenerating the free enzyme.6 Several studies have demonstrated that GGT is a pro-oxidant in intracellular transduction and its catalysis is notably enhanced in the liver.7 A high GGT level in plasma is often associated with some adverse symptoms such as viral hepatitis,8 bone disease9 and inflammatory bowel disease.10 Therefore, the expression level of GGT in human serum is considered as a key indicator in the clinical diagnosis of several diseases.11 Moreover, abnormally high expression level of GGT could lead to the breakdown of redox homeostasis in intracellular environment and eventually result in cancerization.5,12 GGT can promotes the growth and proliferation of tumor cells by mediating the circulation of γ-Glu in tumor cells.13 It also can promotes cancer metastasis and drug resistance of tumors.14 Preclinical studies have indicated that GGT is overexpressed in certain malignant tumor cells, such as liver, breast, neck, cervical, colon and ovarian cancers, while it is not or low expressed in normal tissues except liver and kidney.13–17 Accordingly, GGT could be used as an important biomarker for cancer diagnosis.18 Therefore, sensitively and specifically monitoring the expression level of GGT in living subjects should be of great significance for the clinical cancer diagnosis and treatment.Up to now, a series of molecular probes have been successively developed to detect the expression level of GGT. According to their different imaging modality, they can be divided into near-infrared fluorescent probes,14 bioluminescent probes,19 chemiluminescent probes,20 magnetic resonance imaging (MRI) probes,15 positron emission tomography (PET) probes,21 etc. Optical imaging, owning the characteristics of excellent spatial resolution and sensitivity, has been applied to direct the resection of lesions in clinical surgery.22,23 However, its application also be limited due to the poor tissue penetration.24 Due to higher sensitivity, deeper tissue penetration and can provide more quantifiable information, PET imaging may be superior to other imaging technologies in monitoring the expression level of GGT in living subject.22,24–26 At present, GGT-targeting probes under preclinical study are mainly optical probes, while PET probes are rarely reported for detecting the GGT expression.27 Recently, our group reported a GGT-targeting PET probe 18F-1G to monitor the expression level of GGT in living subjects.21 However, due to its poor water solubility and high-dose requirement, its further clinical applications were limited. Therefore, it is necessary to develop new GGT-targeting PET probes to sensitively and specifically monitor the expression level of GGT in living subjects.
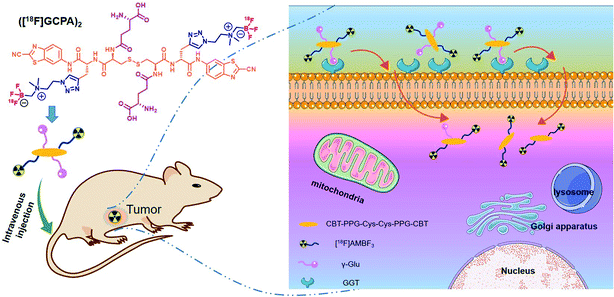
In this study, a novel GGT-targeting radiotracer ([18F]GCPA)2 was designed and synthesized. As shown in Scheme 1, ([18F]GCPA)2 contains two γ-glutamate (γ-Glu) groups in response to GGT and two moieties of [18F]ammoniomethyl-trifluoroborate ([18F]AMBF3) conjugated to the CBT-PPG-Cys(γ-Glu)-Cys(γ-Glu)-PPG-CBT scaffold. The incorporation of two hydrophilic groups (γ-Glu and AMBF3) would be conducive to enhance the water solubility, and the introduction of two γ-Glu might be beneficial to enhance the specificity of the probe to GGT. In vitro stability, water solubility and GGT-targeting ability as well as sensitivity and specificity of the probe for detecting GGT in vivo were evaluated systematically.
Results and discussion
Chemistry and radiochemistry
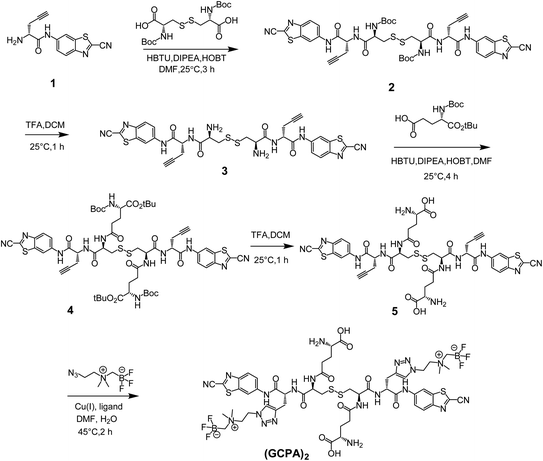
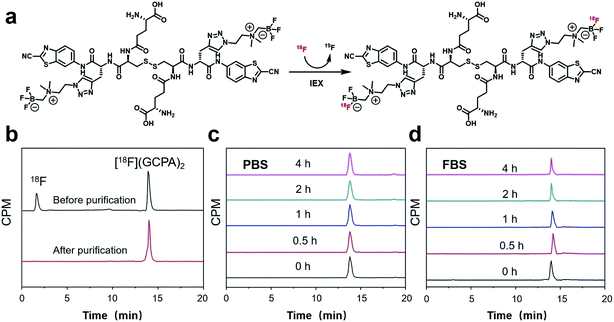
The non-radioactive probe (GCPA)2 was synthesized successfully according to the synthesis route as shown in Scheme 2. At first, compound 1 was successfully synthesized based on the method reported previously.28,29 Then it was coupled with N,N′-bis(tert-butoxycarbonyl)-L-cystine to yield compound 2. After deprotection, compound 3 was obtained and then coupled with Boc-Glu-OtBu through a condensation reaction to yield compound 4. Subsequently, two protecting groups were removed to produce compound 5. At last, AMBF3 was attached to the alkynyl group of compound 5 via the click reaction to yield the non-radioactive probe (GCPA)2. The compound 5 and non-radioactive probe (GCPA)2 were purified with semi-preparative high performance liquid chromatography (HPLC) whose conditions were listed in ESI (Tables S1–S2†). All compounds were characterized by HPLC (see Fig. S1–S5 in ESI section†) and electrospray ionization-mass spectrometry (ESI-MS) (see Fig. S6–S10 in ESI section†), and the HPLC profiles of all compounds were recorded at wavelength of 254 nm. Analytical HPLC conditions were display in Table S3.† The HPLC purity of compound 2 to compound (GCPA)2 are 97%, 97%, 98%, 95% and 97%, respectively. The chemical structures of all the new compounds were further verified by 1H NMR, 13C NMR and 19F NMR (see Fig. S11–S21 in ESI†).The radiochemical synthesis of GGT-targeting PET probe ([18F]GCPA)2 was successfully completed via a single-step isotope exchange reaction (see Fig. 1). The non-radioactive probe (GCPA)2 (0.75 μmol) was efficiently labelled with fluorine-18 (∼9.25 GBq) within 30 min. As shown in Fig. 1b, the decay-corrected radiochemical yield (RCY) of ([18F]GCPA)2 was 76 ± 3% and the radiochemical purity (RCP) was over 98% after a simple and fast purification. The molar activity was measured to be 10.64 ± 0.89 GBq μmol−1 (n = 5). The retention time of ([18F]GCPA)2 was 14.7 min (Fig. 1a), which was consistent with the retention time of non-radioactive probe (GCPA)2 (Fig. S5 in ESI section†). All results suggested that (GCPA)2 could be quickly and conveniently radiolabelled with fluorine-18 via the isotope exchange (IEX) method. Then, the stability of the target probe ([18F]GCPA)2 was measured. As shown in Fig. 1c and d, when the probe was incubated with phosphate-buffered saline (PBS) or fetal bovine serum (FBS) for 4 h, no other impurity was observed. It is suggested that the probe was stable enough for further biological evaluation.
Octanol–water partition coefficient (log![[thin space (1/6-em)]](https://www.rsc.org/images/entities/h3_char_2009.gif) P)
P)
The log![[thin space (1/6-em)]](https://www.rsc.org/images/entities/char_2009.gif) P of ([18F]GCPA)2 was determined to be −1.66 ± 0.02 (n = 3), indicating that the radiotracer is hydrophilic. Compared with 18F-1G, log
P of ([18F]GCPA)2 was determined to be −1.66 ± 0.02 (n = 3), indicating that the radiotracer is hydrophilic. Compared with 18F-1G, log![[thin space (1/6-em)]](https://www.rsc.org/images/entities/char_2009.gif) P value of ([18F]GCPA)2 is significantly less than that of 18F-1G (−1.66 ± 0.02 vs. 0.042 ± 0.0056), indicating that the hydrophilicity of ([18F]GCPA)2 is significantly higher than that of 18F-1G.
P value of ([18F]GCPA)2 is significantly less than that of 18F-1G (−1.66 ± 0.02 vs. 0.042 ± 0.0056), indicating that the hydrophilicity of ([18F]GCPA)2 is significantly higher than that of 18F-1G.
Biocompatibility assay
Biocompatibility of the probe ([18F]GCPA)2 was studied by measuring the cytotoxicity of the non-radioactive probe (GCPA)2 against normal cells L929 and tumor cells HCT116 using the traditional MTT assay. As displayed in Fig. S22,† when L929 and HCT116 cells were incubated with (GCPA)2 at a low concentration (<50 μM), the cell viability of both cells was more than 90%. After both cells were incubated with (GCPA)2 (100 μM) for 24 h, the viability of HCT116 cells was more than 80% and that of L929 cells was 70.29 ± 0.03%. Considering that the actual concentration of the radiotracer used in the living subjects was far less than 50 μM, the tracer possesses good biocompatibility and could be safely used in the following biological evaluation.GGT-targeting responsive ability
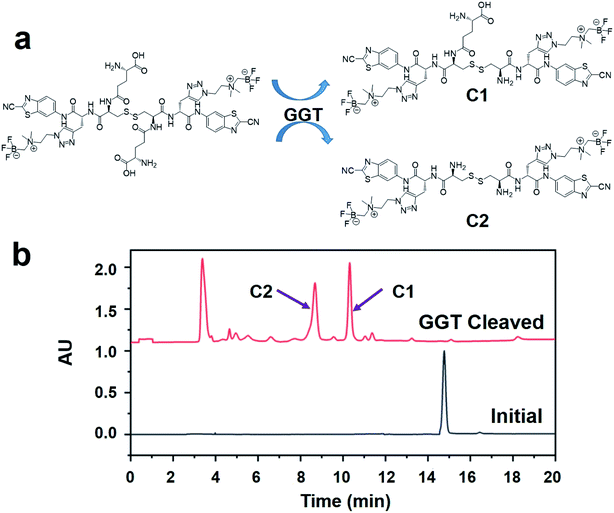
In order to confirm that the probe ([18F]GCPA)2 could be recognized and cleaved by GGT, the specific response of the non-radioactive probe (GCPA)2 towards GGT was studied (see Fig. 2). After the non-radioactive probe (GCPA)2 (250 μM) was incubated with GGT (100 U L−1) for 30 min, the peak of (GCPA)2 disappeared and two new peaks were clearly observed (see Fig. 2b). In order to verify the two new products after incubating the non-radioactive probe with GGT, we synthesized two enzymatic products (C1 and C2). The ESI-MS and HPLC analysis were displayed in Fig. S23–S26.† The half retention time of C1 (10.7 min) and C2 (8.7 min) were consistent with that of these two new products, confirming that non-radioactive probe could target and respond to GGT. Moreover, the reaction rate of (GCPA)2 respond to GGT was studied. As shown in Fig. S27,† (GCPA)2 has been almost converted into cleavage products C1 (73%) and C2 (27%) after incubating with GGT for 20 min. This results indicated that the probe ([18F]GCPA)2 could be specifically recognized and cleaved quickly by GGT.Cellular uptake
The GGT-targeting ability of ([18F]GCPA)2 was further investigated by monitoring the uptake of the radiotracer in GGT-positive HCT116 cells and GGT-negative L929 cells. As shown in Fig. 3, when the probe ([18F]GCPA)2 (37 KBq) was incubated with HCT116 cells, the cellular uptake of ([18F]GCPA)2 gradually increased with the prolonged incubation time and arrived at a plateau at 2 h with the uptake value of 2.81 ± 0.04%. At 4 h, the cellular uptake still maintained at a high level (2.90 ± 0.12%). On the contrary, the maximum cellular uptake of ([18F]GCPA)2 in L929 cells was only 1.44 ± 0.15% at 4 h, which was significantly lower than that in the GGT-positive HCT116 cells. High uptake of radioactivity in HCT116 cells was observed and the uptake value of HCT116 cells was twice as high as that of L929 cells, suggesting that the tracer ([18F]GCPA)2 could target tumor cells with high expression level of GGT. The small amount of ([18F]GCPA)2 in L929 cells was likely due to the non-specific uptake by normal cells with low expression level of GGT. The significant difference of cellular uptake between HCT116 cells and L929 cells was related to the different GGT expression in the two kind cells. These results also suggested that the tracer could be selectively recognized by GGT.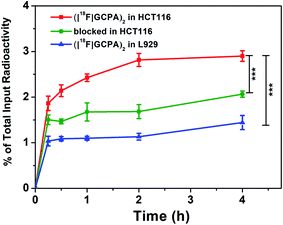 | ||
| Fig. 3 Cellular uptake of ([18F]GCPA)2 in HCT116 cells (red), HCT116 cells pre-treated with 10 nM (GCPA)2 (green), and L929 cells (blue) incubated for different time (n = 3). ***P < 0.001. | ||
In addition, to further study the specificity of ([18F]GCPA)2 for GGT, the cellular uptake in the blocked group was also investigated, in which GGT-positive HCT116 cells were pre-treated with the non-radioactive probe (GCPA)2 (10 nmol) for 30 min before incubated with the tracer ([18F]GCPA)2. As expected, cellular uptake was significantly inhibited and the maximum decreased remarkably from 2.90 ± 0.12% to 1.89 ± 0.07%. This further demonstrated that the tracer ([18F]GCPA)2 could specifically target to GGT and can be used for sensitively and specifically monitoring the expression level of GGT.
MicroPET imaging
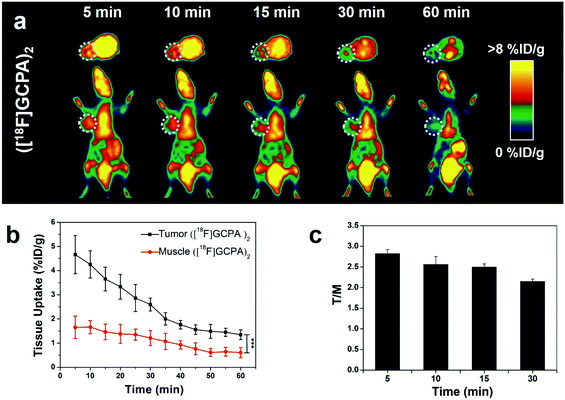
Sensitivity and specificity of the tracer ([18F]GCPA)2 in detecting the GGT expression was investigated by microPET imaging of HCT116 xenografts. In Fig. 4a, HCT116 tumor could be clearly visualized from 5 min to 30 min after injection of ([18F]GCPA)2 and the tumor uptake rapidly reached the maximum value 4.66 ± 0.79% ID g−1 at 5 min post injection (Fig. 4b). The rapid increase of tumor uptake within such a short time might be due to that two γ-Glu groups greatly enhanced the GGT-targeting ability of the radiotracer so that the tracer could been efficiently recognized and cleaved by GGT and undergoes caveolae-mediated endocytosis and transcytosis rapidly into tumor cells.30 This also indicated that the tracer ([18F]GCPA)2 could sensitively detect the GGT expression in living subjects. As time went on, the tumor uptake decreased to 2.97 ± 0.29% ID g−1 and 1.35 ± 0.20% ID g−1 at 20 min and 60 min post injection, respectively. Since the disulfide bond in the tracer was not easily to be reduced, a small amount of dimer formed during the whole imaging could not significantly prolong the retention time of the probe in the tumor.31 In addition, the elimination half-life of the tracer ([18F]GCPA)2 was determined to be 30.5 min, suggesting that the tracer could be quickly cleared from the body (Fig. S28 in ESI†), which was consistent with the PET imaging results. Although both the tracer ([18F]GCPA)2 and 18F-1G were cleared rapidly from the tumor site, the tracer ([18F]GCPA)2 could be absorbed by tumor more quickly and the tumor uptake value was higher than the probe 18F-1G. The tracer ([18F]GCPA)2 reached the maximum tumor uptake (4.66 ± 0.79% ID g−1) at 5 min post injection, while the probe 18F-1G only reached the maximum tumor uptake (3.20 ± 0.29% ID g−1) at 10 min post injection.Compared with tumor uptake, the muscle uptake of tracer was relatively low, which ranged from 1.66 ± 0.27% ID g−1 to 0.61 ± 0.21% ID g−1 within 60 min (see Fig. 4b). Accordingly, the tumor-to-muscle uptake ratio (T/M) was always high and the maximum T/M ratio of 2.82 ± 0.10 was achieved at 5 min post injection (see Fig. 4c). This indicated that ([18F]GCPA)2 could serve as a potential tracer for sensitively visualizing GGT expression in living subjects. In addition, we also compared the T/M ratio between ([18F]GCPA)2 and 18F-1G. The T/M value of 18F-1G was about 2 at 10 min and 30 min post injection, while that of this probe was 2.56 ± 0.19 and 2.15 ± 0.06 at 10 min and 30 min post injection, respectively. These results also proved that the GGT-targeting ability of the tracer ([18F]GCPA)2 was higher than the probe 18F-1G.
From the PET imaging, one could observe that the PET signal of the liver gradually weakens over the imaging time. At the same time, it could be also observed that there was a strong PET signal in the bladder at 5 min post injection, and the PET signal further enhanced as time went on. However, there was no significant reduction in the liver uptake of probe 18F-1G during the whole imaging process.21 In addition, no strong PET signal was observed in the bladder at 10 min post injection of 18F-1G. These difference could be attributed to the fact that the tracer ([18F]GCPA)2 was more hydrophilic than the probe 18F-1G, resulting in faster clearance of the tracer ([18F]GCPA)2 through the liver and kidneys.32–34
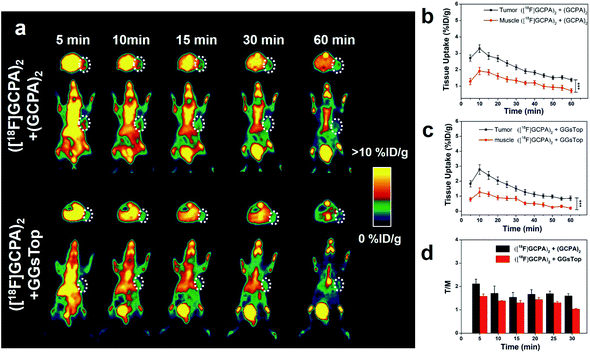
To further demonstrate the specificity of ([18F]GCPA)2 to the expression of GGT in vivo, microPET imaging of two control groups was also studied. One group of HCT116 tumor-bearing mice were co-injected with ([18F]GCPA)2 and the non-radioactive (GCPA)2 during the microPET scanning, and the other group were pre-treated with GGsTop before injection of the tracer ([18F]GCPA)2. PET images and time course of tumor and muscle uptake quantified from PET images have been shown in Fig. 5a–c. As expected, low radioactive signal in the tumor region could be detected for both groups within 1 h. For the control group with co-injection of ([18F]GCPA)2 and (GCPA)2, the tumor uptake derived from PET images was 2.71 ± 0.19% ID g−1 at 5 min post injection. For the other control group with pre-treatment of GGsTop, tumor uptake also decreased significantly and it was only 1.83 ± 0.22% ID g−1 at 5 min post injection. Compared with the mice injected with only ([18F]GCPA)2, the T/M ratio of two control groups also decreased significantly (see Fig. 5d). For example, T/M ratio of the control group with co-injection of ([18F]GCPA)2 and (GCPA)2 was 2.12 ± 0.20 and 1.60 ± 0.09 at 5 min and 30 min post injection, respectively, while T/M ratio of the other control group with pre-treatment of GGsTop was only 1.58 ± 0.09 and 1.04 ± 0.02 at 5 min and 30 min post injection, respectively, which was obviously smaller than that of the group with injection of only ([18F]GCPA)2 (2.82 ± 0.10 at 5 min and 2.15 ± 0.06 at 30 min). This phenomenon was consistent with the cellular uptake in HCT116 cells co-incubated with ([18F]GCPA)2 and non-radioactive probe (GCPA)2. As shown in Fig. S29a,† the tumor uptake of the group injected with only ([18F]GCPA)2 was significantly more than the group co-injected with ([18F]GCPA)2 and (GCPA)2 (P < 0.05) and that of the group pretreated with GGsTop (P < 0.001). As for the T/M ratio (Fig. S29b in ESI†), the group treated with the tracer ([18F]GCPA)2 was significantly different from that co-injected with ([18F]GCPA)2 and (GCPA)2 (P < 0.01) and that pre-treated with GGsTop (P < 0.001). These results fully verified that ([18F]GCPA)2 is a promising GGT-specific and responsive PET tracer, which could be used to sensitively and specifically detect GGT expression in living subjects.
Conclusions
In summary, a novel GGT-targeting radiotracer ([18F]GCPA)2 was successfully developed for sensitive and specific detection of GGT expression in living subjects. The radiotracer exhibited good molar activity, high radiochemical yield and purity as well as outstanding stability and excellent biocompatibility. Biological evaluations both confirmed that the tracer possessed high sensitivity and specificity to the expression level of GGT. MicroPET imaging of HCT116 xenografts indicated that ([18F]GCPA)2 has great potential for sensitively and specifically monitoring the expression of GGT in living subjects, which may provide important information for the clinical diagnosis of GGT-related diseases.Experimental section
General information
All reagents were purchased from suppliers, such as Aladdin and Sangon Biotech. All chemicals could be used for experiment without additional purification. γ-Glutamyltranspeptidase (GGT, G9270-100UN) originating from equine kidney was afforded by Sigma-Aldrich (Shanghai, China). The enzyme inhibitor GGsTop was purchased from TRC (Toronto Research Chemicals, Canada). [18F]fluoride ion was produced by irradiation of 18O-enriched water using a medical cyclotron (Sumitomo HM-7, Japan). Human colon cancer cell line HCT116 and mouse fibroblast cell line L929 were purchased from the Cell Bank of the Chinese Academy of Sciences (Shanghai, China). Female BALB/c nude mice (5 weeks old) were purchased from Cavens Laboratory Animal Co. Ltd (Changzhou, China).ESI-MS analysis was performed with a quadrupole tandem mass spectrometer (SQ-detect 2) (Waters, USA). NMR spectra (1H, 19F, and 13C) were recorded on Bruker DRX-400 spectrometer (Bruker, Germany). Analytical HPLC is constituted with a Waters 1525 pump, a Waters 2487 UV/visible detector and a C18 column (10 μm, 250 × 4.6 mm, Elite). Semi-preparative HPLC (Waters, USA) equipped with a Waters 2489 UV/visible detector, a Waters 1525 pump and a RP-C18 column (5 μm, 250 × 10 mm, Elite) was used for the purification of intermediates and the final product. Radio-HPLC equipped with a radioactivity detector (Radiomatic 610TR; Perkin Elmer; MA; USA). The radioactivity was measured using a γ counter (1470, Perkin-Elmer corporation, USA). MicroPET imaging was carried out on a Small Animal micro-PET scanner (Siemens, Germany).
Chemical synthesis of non-radioactive probe (GCPA)2
![[thin space (1/6-em)]](https://www.rsc.org/images/entities/char_2009.gif) :
:![[thin space (1/6-em)]](https://www.rsc.org/images/entities/char_2009.gif) 1) to afford the compound 2 as white powder (90 mg, yield ratio 97%). The melting points (mp) of compound 1 and compound 2 are 119–121 °C and 144–145 °C. 1H NMR of compound 2 (400 MHz, DMSO-d6) δ 10.59 (s, 2H), 8.74 (s, 2H), 8.45 (d, J = 7.8 Hz, 2H), 8.21 (d, J = 9.0 Hz, 2H), 7.80 (d, J = 9.1 Hz, 2H), 7.20 (d, J = 8.1 Hz, 2H), 4.67 (q, J = 7.0 Hz, 2H), 4.30 (q, J = 8.8 Hz, 2H), 3.14 (d, J = 9.3 Hz, 2H), 2.91 (t, J = 2.6 Hz, 2H), 2.87 (d, J = 12.5 Hz, 2H), 2.67 (dd, J = 16.9, 6.3 Hz, 4H), 1.37 (s, 18H). 13C NMR of compound 2 (100 MHz, DMSO-d6) δ 171.0, 169.5, 155.9, 148.3, 139.4, 137.1, 135.8, 125.3, 121.4, 114.0, 112.2, 80.3, 79.0, 74.0, 54.0, 52.8, 28.6, 22.3. ESI-MS (m/z) of compound 2 calculated for C42H45N10O8S4 ([M + H]+) 945.22, observed as 945.17.
1) to afford the compound 2 as white powder (90 mg, yield ratio 97%). The melting points (mp) of compound 1 and compound 2 are 119–121 °C and 144–145 °C. 1H NMR of compound 2 (400 MHz, DMSO-d6) δ 10.59 (s, 2H), 8.74 (s, 2H), 8.45 (d, J = 7.8 Hz, 2H), 8.21 (d, J = 9.0 Hz, 2H), 7.80 (d, J = 9.1 Hz, 2H), 7.20 (d, J = 8.1 Hz, 2H), 4.67 (q, J = 7.0 Hz, 2H), 4.30 (q, J = 8.8 Hz, 2H), 3.14 (d, J = 9.3 Hz, 2H), 2.91 (t, J = 2.6 Hz, 2H), 2.87 (d, J = 12.5 Hz, 2H), 2.67 (dd, J = 16.9, 6.3 Hz, 4H), 1.37 (s, 18H). 13C NMR of compound 2 (100 MHz, DMSO-d6) δ 171.0, 169.5, 155.9, 148.3, 139.4, 137.1, 135.8, 125.3, 121.4, 114.0, 112.2, 80.3, 79.0, 74.0, 54.0, 52.8, 28.6, 22.3. ESI-MS (m/z) of compound 2 calculated for C42H45N10O8S4 ([M + H]+) 945.22, observed as 945.17.![[thin space (1/6-em)]](https://www.rsc.org/images/entities/char_2009.gif) :
:![[thin space (1/6-em)]](https://www.rsc.org/images/entities/char_2009.gif) 2) to yield compound 4 as white solid (75 mg, yield ratio 71%), mp 137–139 °C. 1H NMR of compound 4 (400 MHz, DMSO-d6) δ 10.49 (s, 2H), 8.78 (s, 2H), 8.64 (d, J = 7.8 Hz, 2H), 8.34 (d, J = 7.3 Hz, 2H), 8.20 (d, J = 9.0 Hz, 2H), 7.84 (d, J = 10.7 Hz, 2H), 7.12 (d, J = 7.7 Hz, 2H), 4.68–4.63 (m, 2H), 4.63–4.57 (m, 2H), 3.84–3.76 (m, 2H), 3.13 (d, J = 8.7 Hz, 2H), 2.93 (d, J = 9.8 Hz, 2H), 2.90 (s, 2H), 2.68 (dd, J = 25.0, 5.7 Hz, 4H), 2.25 (t, J = 7.4 Hz, 4H), 1.83 (dt, J = 64.1, 6.5 Hz, 4H), 1.37 (s, 18H), 1.36 (s, 18H). 13C NMR of compound 4 (100 MHz, DMSO-d6) δ 172.0, 170.6, 169.6, 156.0, 148.3, 139.4, 135.8, 125.3, 121.4, 112.1, 80.8, 78.5, 73.9, 54.4, 53.0, 52.7, 32.1, 28.6, 28.1, 27.0, 22.1. ESI-MS (m/z) of compound 4 calculated for C60H75N12O14S4 ([M + H] +) 1316.44, observed as 1316.23.
2) to yield compound 4 as white solid (75 mg, yield ratio 71%), mp 137–139 °C. 1H NMR of compound 4 (400 MHz, DMSO-d6) δ 10.49 (s, 2H), 8.78 (s, 2H), 8.64 (d, J = 7.8 Hz, 2H), 8.34 (d, J = 7.3 Hz, 2H), 8.20 (d, J = 9.0 Hz, 2H), 7.84 (d, J = 10.7 Hz, 2H), 7.12 (d, J = 7.7 Hz, 2H), 4.68–4.63 (m, 2H), 4.63–4.57 (m, 2H), 3.84–3.76 (m, 2H), 3.13 (d, J = 8.7 Hz, 2H), 2.93 (d, J = 9.8 Hz, 2H), 2.90 (s, 2H), 2.68 (dd, J = 25.0, 5.7 Hz, 4H), 2.25 (t, J = 7.4 Hz, 4H), 1.83 (dt, J = 64.1, 6.5 Hz, 4H), 1.37 (s, 18H), 1.36 (s, 18H). 13C NMR of compound 4 (100 MHz, DMSO-d6) δ 172.0, 170.6, 169.6, 156.0, 148.3, 139.4, 135.8, 125.3, 121.4, 112.1, 80.8, 78.5, 73.9, 54.4, 53.0, 52.7, 32.1, 28.6, 28.1, 27.0, 22.1. ESI-MS (m/z) of compound 4 calculated for C60H75N12O14S4 ([M + H] +) 1316.44, observed as 1316.23.![[thin space (1/6-em)]](https://www.rsc.org/images/entities/char_2009.gif) :
:![[thin space (1/6-em)]](https://www.rsc.org/images/entities/char_2009.gif) 1, v/v). Then the solution was stirred at 25 °C for 1 h. After evaporation of the solvent and precipitation with cold diethyl ether (30 mL), the crude product 5 was obtained as white powder. Subsequently, the crude product was further purified by semi-preparative HPLC to obtain a white powder (26 mg, yield ratio 46%), mp 137–140 °C. 1H NMR of compound 5 (400 MHz, DMSO-d6) δ 10.67 (s, 2H), 8.78 (d, J = 1.9 Hz, 2H), 8.72 (d, J = 6.6 Hz, 2H), 8.46 (d, J = 6.0 Hz, 2H), 8.21 (d, J = 9.0 Hz, 2H), 7.85 (d, J = 9.1 Hz, 2H), 4.68–4.63 (m, 2H), 4.63–4.58 (m, 2H), 3.86 (s, 2H), 3.17 (d, J = 8.9 Hz, 2H), 2.90 (s, 2H), 2.89 (s, 2H), 2.68 (dd, J = 23.1, 6.9 Hz, 4H), 2.37 (dd, J = 16.9, 8.2 Hz, 4H), 2.05–1.96 (m, 4H). 13C NMR of compound 5 (100 MHz, DMSO-d6) δ 172.0, 171.4, 170.6, 169.6, 148.3, 139.5, 137.1, 135.7, 125.3, 121.4, 114.0, 112.1, 80.4, 73.9, 53.1, 52.7, 52.4, 36.3, 31.2, 26.6, 22.2. ESI-MS (m/z) of compound 5 calculated for C42H43N12O10S4 ([M + H]+) 1003.20, observed as 1003.50.
1, v/v). Then the solution was stirred at 25 °C for 1 h. After evaporation of the solvent and precipitation with cold diethyl ether (30 mL), the crude product 5 was obtained as white powder. Subsequently, the crude product was further purified by semi-preparative HPLC to obtain a white powder (26 mg, yield ratio 46%), mp 137–140 °C. 1H NMR of compound 5 (400 MHz, DMSO-d6) δ 10.67 (s, 2H), 8.78 (d, J = 1.9 Hz, 2H), 8.72 (d, J = 6.6 Hz, 2H), 8.46 (d, J = 6.0 Hz, 2H), 8.21 (d, J = 9.0 Hz, 2H), 7.85 (d, J = 9.1 Hz, 2H), 4.68–4.63 (m, 2H), 4.63–4.58 (m, 2H), 3.86 (s, 2H), 3.17 (d, J = 8.9 Hz, 2H), 2.90 (s, 2H), 2.89 (s, 2H), 2.68 (dd, J = 23.1, 6.9 Hz, 4H), 2.37 (dd, J = 16.9, 8.2 Hz, 4H), 2.05–1.96 (m, 4H). 13C NMR of compound 5 (100 MHz, DMSO-d6) δ 172.0, 171.4, 170.6, 169.6, 148.3, 139.5, 137.1, 135.7, 125.3, 121.4, 114.0, 112.1, 80.4, 73.9, 53.1, 52.7, 52.4, 36.3, 31.2, 26.6, 22.2. ESI-MS (m/z) of compound 5 calculated for C42H43N12O10S4 ([M + H]+) 1003.20, observed as 1003.50.Radiolabeling of ([18F]GCPA)2
Radiolabeling of the non-radioactive probe (GCPA)2 was carried out via 18F–19F isotope exchange reaction.35–37 In brief, [18F]fluoride in 18F/H218O (7.4–9.25 GBq) was captured by an activated Sep-Pak light QMA cartridge. Then it was eluted into a reaction tube using pyridazine-HCl buffer (pH 2.5, 300 μL). Subsequently, the non-radioactive probe (GCPA)2 (25 mM, 30 μL) was added. The reaction was at 80 °C for 25 min to 30 min. The target product was capture using an activated Sep-Pak light C18 cartridge and then free [18F]fluoride was removed by deionized water (20 mL). Finally, the trapped ([18F]GCPA)2 was eluted into a penicillin bottle using absolute ethanol (0.5 mL). Radiochemical yield, radiochemical purity of the target tracer ([18F]GCPA)2 were measured by radio-HPLC. The RCY value was obtained with decay corrected. The molar activity was measured at the end of radiochemical synthesis.Determination of log![[thin space (1/6-em)]](https://www.rsc.org/images/entities/h3_char_2009.gif) P
P
The log![[thin space (1/6-em)]](https://www.rsc.org/images/entities/char_2009.gif) P value of ([18F]GCPA)2 was determined according to the reported method.38 In brief, ([18F]GCPA)2 (0.74 MBq) was added to a saturated solution of octanol/distilled water (v/v, 1
P value of ([18F]GCPA)2 was determined according to the reported method.38 In brief, ([18F]GCPA)2 (0.74 MBq) was added to a saturated solution of octanol/distilled water (v/v, 1![[thin space (1/6-em)]](https://www.rsc.org/images/entities/char_2009.gif) :
:![[thin space (1/6-em)]](https://www.rsc.org/images/entities/char_2009.gif) 1) and mixed sufficiently. And then each phase was separated via centrifugation at a speed of 3000 rpm min−1. The distribution of ([18F]GCPA)2 in each phase was quantified using a γ counter. log
1) and mixed sufficiently. And then each phase was separated via centrifugation at a speed of 3000 rpm min−1. The distribution of ([18F]GCPA)2 in each phase was quantified using a γ counter. log![[thin space (1/6-em)]](https://www.rsc.org/images/entities/char_2009.gif) P = log(Co/Cw), where Co represented the concentration of ([18F]GCPA)2 in the octanol phase and Cw represented the concentration of ([18F]GCPA)2 in the water phase.
P = log(Co/Cw), where Co represented the concentration of ([18F]GCPA)2 in the octanol phase and Cw represented the concentration of ([18F]GCPA)2 in the water phase.
In vitro stability assay
To evaluate the stability of the tracer ([18F]GCPA)2, the tracer (37 KBq μL−1, 20 μL) was incubated with PBS (pH = 7.4, 180 μL) and FBS (180 μL) at 37 °C for 1, 2 and 4 h, respectively. The tracer incubated in PBS was directly analyzed by the radio-HPLC without additional processing to assess the stability of ([18F]GCPA)2 in PBS. For serum sample, the serum protein should be removed before radio-HPLC analysis. In detail, approximately an equal volume of acetonitrile was added to the serum sample (20 μL) to precipitate the protein, and then the mixture was centrifuged at 12![[thin space (1/6-em)]](https://www.rsc.org/images/entities/char_2009.gif) 000 rpm for 5 min. Finally, the supernatant was analyzed by radio-HPLC to evaluate the stability of ([18F]GCPA)2 in FBS.
000 rpm for 5 min. Finally, the supernatant was analyzed by radio-HPLC to evaluate the stability of ([18F]GCPA)2 in FBS.
GGT-responsive ability assay
The response of the probe ([18F]GCPA)2 to GGT was investigated and monitored by analyzing whether the non-radioactive probe (GCPA)2 could be specifically recognized and cleaved by GGT. At first, (GCPA)2 (2.5 μmol) was dissolved in 100 μL of DMF to obtain a stock solution (25 mM), and GGT was dissolved in water to achieve a stock solution (10![[thin space (1/6-em)]](https://www.rsc.org/images/entities/char_2009.gif) 000 U L−1). The enzyme-reaction buffer consisted of Na2HPO4 (100 mM), NaH2PO4 (3.2 mM), KH2PO4 (1.8 mM), NaCl (27.5 mM) and 0.025% TritonX-100 (v/v). Then, (GCPA)2 (25 mM, 1 μL) was incubated with 100 U L−1 of GGT in enzyme-reaction buffer (pH 7.4, 98 μL) at 37 °C for 30 min.
000 U L−1). The enzyme-reaction buffer consisted of Na2HPO4 (100 mM), NaH2PO4 (3.2 mM), KH2PO4 (1.8 mM), NaCl (27.5 mM) and 0.025% TritonX-100 (v/v). Then, (GCPA)2 (25 mM, 1 μL) was incubated with 100 U L−1 of GGT in enzyme-reaction buffer (pH 7.4, 98 μL) at 37 °C for 30 min.
Cell culture and animal model
According to previous studies, human colon cancer cells HCT116 with high expression level of GGT and mouse fibroblast cells L929 with low expression level of GGT were selected for evaluating the biological performance of the probe.3,39,40 HCT116 and L929 cells were cultured in DMEM, and incubated at 37 °C and 5% CO2. HCT116 cells (5 × 10⁶ cells) were inoculated subcutaneously. The mice were used for biological experiments when the tumor xenograft reached 8–10 mm in diameter. All animal procedures were followed in accordance with the Guidelines of the National Technical Committee for Standardization of Laboratory Animals of China (GB/T 358922018) and approved by the Animal Ethics Committee of the Jiangsu Institute of Nuclear Medicine.In vitro biocompatibility assay
The biocompatibility of ([18F]GCPA)2 was evaluated by measuring the cytotoxicity of non-radioactive probe (GCPA)2 against HCT116 and L929 cells using MTT method. In brief, HCT116 and L929 cells were seeded in 96-well plate (8 × 10³ cells per well). Then cells were cultured in an incubator overnight to allow attachment. Then cells were incubated with DMEM medium containing different concentrations of non-radioactive probe (GCPA)2 (0, 12.5, 25, 50 and 100 μM). After incubation for 6, 12 and 24 h, MTT (5 mg mL−1, 20 μL) was added and then cells were incubated under the same conditions for another 4 h. Then the medium was removed and the formazan crystal was dissolved using 150 μL of dimethyl sulfoxide. The optical density (OD) was measured with an ELISA microplate reader at the wavelength of 490 nm, and cells viability was evaluated. The well without drug treatment served as the control.Cellular uptake study
The probe ([18F]GCPA)2 (37 KBq) was dispersed in 100 μL of FBS-free medium. Subsequently, it was added to a tube containing 1 × 10⁶ HCT116 or L929 cells and 200 μL of medium (n = 3). Then cells were incubated at 37 °C for different time (15 min, 30 min, 1 h, 2 h and 4 h). Meanwhile, HCT116 cells pre-treated with non-radioactive probe (GCPA)2 (10 nmol) for 30 min before incubation with ([18F]GCPA)2 served as the blocked group, and only the tracer ([18F]GCPA)2 (37 KBq) in tube (n = 3) served as the blank control group. At different time points (15 min, 30 min, 1 h, 2 h and 4 h), 500 μL of cold PBS was added to each tube to terminate cellular uptake and each sample was centrifuged at 4000 rpm min−1. After supernatant was carefully pipetted out, each sample was carefully rinsed by 500 μL of cold PBS for three times. The activity of each tube was measured using a γ counter. Cellular uptake% = (mean counts in experimental group/mean counts in blank control group) × 100%.MicroPET imaging
PET imaging was performed using a small-animal PET scanner. The mice were anesthetized with isoflurane (2% isoflurane mixed with oxygen) at the flow rate of 2 L min−1. HCT116 tumor-bearing mice were injected with 5.6 MBq of ([18F]GCPA)2 via tail vein after mice were anesthetized. Two control groups were used to verify the specificity of the radiotracer for imaging GGT. One group was co-injected with ([18F]GCPA)2 (5.6 MBq) and non-radioactive probe (GCPA)2 (250 nmol), and another group was pretreated with GGsTop (500 nmol) for 30 min before injection of ([18F]GCPA)2 (5.6 MBq). Subsequently, dynamic microPET scanning was performed for 60 min. The imaging profile was reconstructed using three-dimensional ordered subsets expectation maximization (OSEM3D) model. Quantitative analysis of PET images was processed using ASIProVM software (Siemens Preclinical Solutions, USA). The tissue uptake was analyzed using the region of interest (ROI) method and expressed as % ID g−1. The muscle ROI was drawn in the armpit muscle of the upper limb at the opposite side of the tumor.In vivo pharmacokinetics
The tracer ([18F]GCPA)2 (∼7.4 MBq) was dispersed in 200 μL of saline solution. Subsequently, it was intravenously injected into normal mice (n = 3). Meanwhile, ([18F]GCPA)2 (∼1.5 MBq) was placed in a tube as control (n = 3). Blood samples were collected at 1, 2, 5, 7, 10, 15, 20, 30, 45, 60 and 120 min post injection, respectively. After measuring the weight and the radioactivity of every samples, the pharmacokinetics was calculated by DAS2.1 software.Statistical analysis
Results were presented as mean ± standard error (SD). All statistical analysis was performed using the SPSS 17.0 software. Comparison between groups was analyzed by one-way ANOVA and t-test. *P < 0.05, **P < 0.01 and ***P < 0.001 were considered to be statistically significant.Author contributions
Dingyao Gao: methodology, software, investigation, formal analysis, visualization, writing-original draft. Yinxing Miao: software, investigation, formal analysis, visualization. Siqin Ye: methodology, investigation, formal analysis, visualization. Chunmei Lu: software, formal analysis, visualization. Gaochao Lv: methodology, writing-review & editing. Ke Li: formal analysis, methodology. Chunjing Yu: conceptualization, resources, supervision. Jianguo Lin: conceptualization, methodology, writing-review & editing, supervision. Ling Qiu: conceptualization, methodology, resources, writing-review & editing, supervision.Conflicts of interest
There are no conflicts of interest to declare.Acknowledgements
This study was supported by the National Natural Science Foundation of China (22076069), Natural Science Foundation of Jiangsu Province (BK20181128), the Jiangsu Provincial Medical Youth Talent (QNRC2016626 and QNRC2016629), the Major Scientific Research Project of Wuxi Commission of Health (Z201913) and the Innovation Capacity Development Plan of Jiangsu Province (BM2018023).References
- Y. J. Reo, M. Dai, Y. J. Yang and K. H. Ahn, Anal. Chem., 2020, 92, 12678–12685 CrossRef PubMed.
- T. Nishihara, H. A. Yoshihara, H. Nonaka, Y. Takakusagi, F. Hyodo, K. Ichikawa, E. Can, J. A. Bastiaansen, Y. Takado, A. Comment and S. Sando, Angew. Chem., 2016, 55, 10626–10629 CrossRef CAS PubMed.
- J. Ou-Yang, Y. F. Li, P. Wu, W. L. Jiang, H. W. Liu and C. Y. Li, ACS Sens., 2018, 3, 1354–1361 CrossRef CAS PubMed.
- Y. Zhang, G. Zhang, P. Yang, B. Moosa and N. M. Khashab, ACS Appl. Mater. Interfaces, 2019, 11, 27529–27535 CrossRef CAS.
- F. Liu, Z. Wang, W. Wang, J. G. Luo and L. Kong, Anal. Chem., 2018, 90, 7467–7473 CrossRef CAS PubMed.
- J. W. Keillor, R. Castonguay and C. J. M. E. Lherbet, Methods Enzymol., 2005, 401, 449–467 CAS.
- B. Flahou, F. Haesebrouck, K. Chiers, K. Van Deun, L. De Smet, B. Devreese, I. Vandenberghe, H. Favoreel, A. Smet, F. Pasmans, K. D'Herde and R. Ducatelle, Cell. Microbiol., 2011, 13, 1933–1955 CrossRef CAS PubMed.
- S. Ahmed, A. Zahoor, M. Ibrahim, M. Younus, S. Nawaz, R. Naseer, Q. Akram, C. L. Deng and S. C. Ojha, Oxid. Med. Cell. Longevity, 2020, 2020, 7087921 Search PubMed.
- H. S. Choi, K. J. Kim, Y. Rhee and S. K. Lim, Endocrinol. Metab., 2016, 31, 64–71 CrossRef CAS PubMed.
- D. N. Abarbanel, S. M. Seki, Y. Davies, N. Marlen, J. A. Benavides, K. Cox, K. C. Nadeau and K. L. Cox, J. Clin. Immunol., 2013, 33, 397–406 CrossRef CAS PubMed.
- L. W. Chen, P. R. Huang, C. H. Chien, C. L. Lin and R. N. Chien, J. Formosan Med. Assoc., 2020, 119, 173–181 CrossRef CAS PubMed.
- Y. Chen, Q. Zheng, X. Jia, K. Chen, Y. Wang, T. Wu, X. Xu, Z. Han, Z. Zhang and X. Zhang, Front. Plant Sci., 2019, 10, 994 CrossRef PubMed.
- Y. J. Kim, S. J. Park, C. S. Lim, D. J. Lee, C. K. Noh, K. Lee, S. J. Shin and H. M. Kim, Anal. Chem., 2019, 91, 9246–9250 CrossRef CAS PubMed.
- Z. Luo, L. Feng, R. An, G. Duan, R. Yan, H. Shi, J. He, Z. Zhou, C. Ji, H. Y. Chen and D. Ye, Chem.–Eur. J., 2017, 23, 14778–14785 CrossRef CAS PubMed.
- Z. Hai, Y. Ni, D. Saimi, H. Yang, H. Tong, K. Zhong and G. Liang, Nano Lett., 2019, 19, 2428–2433 CrossRef CAS PubMed.
- I. S. Fentiman and D. S. Allen, Br. J. Cancer, 2010, 103, 90–93 CrossRef CAS PubMed.
- H. Li, Q. Yao, F. Xu, N. Xu, R. Duan, S. Long, J. Fan, J. Du, J. Wang and X. Peng, Biomaterials, 2018, 179, 1–14 CrossRef CAS.
- J. Liu, S. Zhang, B. Zhao, C. Shen, X. Zhang and G. Yang, Biosens. Bioelectron., 2019, 142, 111497 CrossRef CAS.
- S. Li, R. Hu, C. Yang, X. Zhang, Y. Zeng, S. Wang, X. Guo, Y. Li, X. Cai, S. Li, C. Han and G. Yang, Biosens. Bioelectron., 2017, 98, 325–329 CrossRef CAS PubMed.
- R. An, S. Wei, Z. Huang, F. Liu and D. Ye, Anal. Chem., 2019, 91, 13639–13646 CrossRef CAS PubMed.
- S. Ye, S. Wang, D. Gao, K. Li, Q. Liu, B. Feng, L. Qiu and J. Lin, Bioconjugate Chem., 2020, 31, 174–181 CrossRef CAS.
- M. A. Klenner, G. Pascali, M. Massi and B. H. Fraser, Chem.–Eur. J., 2021, 27, 861–876 CrossRef CAS PubMed.
- J. Zhao, J. Chen, S. Ma, Q. Liu, L. Huang, X. Chen, K. Lou and W. Wang, Acta Pharm. Sin. B, 2018, 8, 320–338 CrossRef.
- Y. Zhan, F. Ai, F. Chen, H. F. Valdovinos, H. Orbay, H. Sun, J. Liang, T. E. Barnhart, J. Tian and W. Cai, Small, 2016, 12, 2872–2876 CrossRef CAS PubMed.
- J. A. Hendricks, E. J. Keliher, D. Wan, S. A. Hilderbrand, R. Weissleder and R. Mazitschek, Angew. Chem., 2012, 51, 4603–4606 CrossRef CAS PubMed.
- D. Ni, E. B. Ehlerding and W. Cai, Angew. Chem., 2019, 58, 2570–2579 CrossRef CAS PubMed.
- Z. Luo, R. An and D. Ye, ChemBioChem, 2018, 20, 474–487 CrossRef PubMed.
- J. Lin, W. Wang, K. Li, H. Huang, G. Lv, Y. Peng, S. Luo and L. Qiu, Chem. Commun., 2017, 53, 6476–6479 RSC.
- B. Shen, J. Jeon, M. Palner, D. Ye, A. Shuhendler, F. T. Chin and J. Rao, Angew. Chem., 2013, 52, 10511–10514 CrossRef CAS.
- Q. Zhou, S. Shao, J. Wang, C. Xu, J. Xiang, Y. Piao, Z. Zhou, Q. Yu, J. Tang, X. Liu, Z. Gan, R. Mo, Z. Gu and Y. Shen, Nat. Nanotechnol., 2019, 14, 799–809 CrossRef CAS.
- J. Huang and S. Whitman, J. Liq. Chromatogr. Relat. Technol., 2006, 29, 2513–2520 CrossRef CAS.
- Z. Li, Z. Wu, K. Chen, F. T. Chin and X. Chen, Bioconjugate Chem., 2007, 18, 1987–1994 CrossRef CAS PubMed.
- Y. Chen, A. Lisok, S. Chatterjee, B. Wharram, M. Pullambhatla, Y. Wang, G. Sgouros, R. C. Mease and M. G. Pomper, Bioconjugate Chem., 2016, 27, 1655–1662 CrossRef CAS PubMed.
- M. Wang, H. Wang, C. Q. Niu, T. Zhang, Z. Wu and Z. Li, Bioconjugate Chem., 2020, 31, 1795–1803 CrossRef CAS PubMed.
- Z. Liu, M. Pourghiasian, F. Benard, J. Pan, K. S. Lin and D. M. Perrin, J. Nucl. Med., 2014, 55, 1499–1505 CrossRef CAS PubMed.
- A. Roxin, C. Zhang, S. Huh, M. Lepage, Z. Zhang, K. S. Lin, F. Benard and D. M. Perrin, Bioconjugate Chem., 2019, 30, 1210–1219 CrossRef CAS PubMed.
- C. Zhang, Z. Zhang, K. S. Lin, J. Lau, J. Zeisler, N. Colpo, D. M. Perrin and F. Benard, Mol. Pharm., 2018, 15, 2116–2122 CrossRef CAS PubMed.
- Y. Zhang, L. Wang, S. Yu, K. Hu, S. Huang, Y. Li, H. Wu, H. Li and Q. Wang, Contrast Media Mol. Imaging, 2019, 2019, 6315954 Search PubMed.
- J. Ou-Yang, Y. Li, W. L. Jiang, S. Y. He, H. W. Liu and C. Y. Li, Anal. Chem., 2019, 91, 1056–1063 CrossRef CAS PubMed.
- X. Hou, F. Zeng and S. Wu, Biosens. Bioelectron., 2016, 85, 317–323 CrossRef CAS PubMed.
Footnotes |
| † Electronic supplementary information (ESI) available. See DOI: 10.1039/d1ra01324f |
| ‡ These authors contributed equally to this work. |
| This journal is © The Royal Society of Chemistry 2021 |

