
 Open Access Article
 This Open Access Article is licensed under a
 Creative Commons Attribution 3.0 Unported Licence
Synergy of molecularly mobile polyrotaxane surfaces with endothelial cell co-culture for mesenchymal stem cell mineralization†
Hiroki Masuda‡
 a,
Yoshinori Arisaka‡b,
Masahiro Hakariyac,
Takanori Iwatac,
Tetsuya Yodaa and
Nobuhiko Yui*b
a,
Yoshinori Arisaka‡b,
Masahiro Hakariyac,
Takanori Iwatac,
Tetsuya Yodaa and
Nobuhiko Yui*b
aDepartment of Maxillofacial Surgery, Graduate School of Medical and Dental Sciences, Tokyo Medical and Dental University (TMDU), 1-5-45 Yushima, Bunkyo, Tokyo 113-8549, Japan
bDepartment of Organic Biomaterials, Institute of Biomaterials and Bioengineering, Tokyo Medical and Dental University (TMDU), 2-3-10 Kanda-Surugadai, Chiyoda, Tokyo 101-0062, Japan. E-mail: yui.org@tmd.ac.jp
cDepartment of Periodontology, Graduate School of Medical and Dental Sciences, Tokyo Medical and Dental University (TMDU), 1-5-45 Yushima, Bunkyo, Tokyo 113-8549, Japan
First published on 24th May 2021
Abstract
Stem cell-based bone tissue engineering is a promising strategy for the treatment of bone defects. Since regeneration of bone tissue takes a long time, promoting osteogenesis of stem cells is desired for earlier recovery from dysfunctions caused by bone defects. Here, we combined endothelial cell co-culture using the molecularly mobile sulfonated polyrotaxane (PRX) surfaces to enhance the mineralization of human bone marrow derived mesenchymal stem cells (HBMSCs). Sulfonated PRXs are composed of sulfopropyl ether-modified α-cyclodextrins (α-CDs) threaded on a polyethylene glycol chain. The molecular mobility of PRX, α-CDs moving along the polymer, can be modulated by the number of α-CDs. When osteoblastic differentiation was induced in HBMSCs and human umbilical vein endothelial cells (HUVECs), co-culture groups on sulfonated PRX surfaces with low molecular mobility showed the highest mineralization, which is about two times as high as co-culture groups on sulfonated PRX surfaces with high molecular mobility. Nuclear accumulation of yes-associated proteins in HBMSCs and cell–cell communication via cytokines or cadherin may play an important role in synergistically induced mineralization of HBMSCs.
1. Introduction
As large-deficiency bone tissues are not spontaneously repaired in the human body, autologous bone,1 allogenous bone,2 bone prosthetic material,3 and growth factors4 have been used to reconstruct and regenerate bone tissues. In recent years, mesenchymal stem cells (MSCs), which can differentiate into osteoblasts, have also been applied for regeneration therapy based on bone tissue engineering.5–7 Treatment with MSCs has many advantages, such as the spontaneous migration of transplanted MSCs to the injured site,8 the suppression of local immune responses,9 and the large quantities obtained from the patients themselves.10 One of the common challenges in these treatments is to construct an effective scaffold for improving functions of MSCs, particularly osteoblastic differentiation, for bone tissue regeneration.In the field of biomaterials, the physical characteristics and surface structures of cell adhesive biomaterials that serve as scaffolds are known to play an important role in inducing osteoblastic differentiation and mineralization of MSCs.11 For instance, stiff materials promoted the differentiation of MSCs into osteoblasts, compared to soft materials.12 As the mechanisms to transmit information of material properties to the cellular nucleus, it has been reported that biological signal pathways related to the Ras homolog gene family, member A (RhoA) and Rho-associated coiled-coil-containing protein kinase (ROCK) activity, yes-associated protein (YAP) activity.13–16 The material properties alter the organization of the cytoskeleton through integrins on the cellular membrane.17 The organization regulates the activity of RhoA/ROCK and YAP, which are involved in cellular morphology, migration, proliferation, and differentiation.
Previously, we constructed polyrotaxane-based surfaces and succeeded in regulating cellular functions.18–22 Polyrotaxane (PRX) is a supermolecule consisting of cyclic molecules, such as α-cyclodextrins (α-CDs), threaded onto an axis polymer, such as poly(ethylene glycol) (PEG).23 One of the unique properties of PRX is the molecular mobility, sliding, and rotation of cyclic molecules along the axis polymer. The molecular mobility of PRX can be modulated by changing the number of α-CDs or by changing the functional groups on the α-CDs.24 We previously succeeded in regulating the differentiation of MSCs using PRX surfaces with different mobilities.25 For instance, the PRX surfaces with low molecular mobility promoted osteoblastic differentiation of MSCs by RhoA activation. Furthermore, the reduced molecular mobility of PRX surfaces was also effective in improving the function of human umbilical vein endothelial cells (HUVECs).26 RhoA and YAP activation by molecularly low mobile surfaces contributed proliferation and vascular network formation of HUVECs, which can expect promotion of angiogenesis. Based on these findings, surfaces with low molecular mobility are expected to be suitable for both osteoblastic differentiation of MSCs and the highly angiogenic expression of HUVECs.
In construction of tissue-engineered bone, angiogenesis as well as osteogenesis is essential because inadequate angiogenesis in the implanted bone tissues has a risk of tissue necrosis. For simultaneous facilitation of bone reconstruction and revascularization, it has been reported that co-culture of MSCs with HUVECs is an effective approach for promoting not only osteoblastic differentiation of MSCs but also vascular network formation of HUVECs.27 In a co-culture system, osteoblastic differentiation of MSCs was promoted by paracrine effects and direct contact.28–30 For instance, morphogenetic protein-2 (BMP-2) secreted from HUVECs promotes mineralization of MSCs.31 Simultaneously, vascular endothelial growth factor (VEGF) secreted from MSCs not only enhances proliferation and functions of HUVEC, but also stimulates mineralization of MSCs themselves as autocrine effect for osteogenesis.32 In direct contact, expression of neural (N)-cadherin in MSCs was activated by co-culture with HUVECs, resulting in improved cell adhesion and expression of early osteoblastic markers.28 Considering these facts, we hypothesize that co-culture of MSCs with HUVECs using PRX surfaces with low mobility may synergistically promote osteoblastic differentiation and mineralization.
In the present study, sulfonated PRX surfaces with different numbers of threaded α-CDs were prepared. To reveal the effect of molecular mobility and co-culture on the osteoblastic differentiation and mineralization of human bone marrow derived MSCs (HBMSCs), alkaline phosphatase (ALP) staining and alizarin red S staining was used. We also examined the gene expression levels of BMP-2, VEGF, neural (N)-cadherin, and type I collagen (COLI) via quantitative real-time polymerase chain reaction.
2. Experimental
2.1 Materials
Sulfonated-PRX triblock copolymers composed of sulfopropyl ether-modified α-CDs threaded onto a PEG chain as a middle PRX segment and poly(benzyl methacrylate) (PBzMA) at both terminals of the PEG as anchoring segments (SPE-PRXs) were prepared as described previously.33 SPE-PRXs with different numbers of threading CDs were obtained by altering the PEG/α-CD molar ratios. HBMSCs, an HBMSC Growth Medium BulletKit (HBMSC growth medium), HUVECs, endothelial growth medium-2 (HUVEC growth medium) supplemented with 0.1% VEGF, 0.1% human epidermal growth factor, 0.1% R3-insulin-like growth factor-1, 0.1% ascorbic acid, 0.04% hydrocortisone, 0.4% human fibroblast growth factor-2, 0.1% heparin, 2% fetal bovine serum, and 0.1% gentamicin were purchased from Lonza (Walkersville, MD, USA). Mesenchymal stem cell osteogenic differentiation medium (HBMSC differentiation medium) was purchased from Promo Cell (Heidelberg, Germany). Trypsin/ethylenediaminetetraacetic acid (EDTA) solution, phosphate buffered saline (PBS), 4% paraformaldehyde, alizarin red S, and dimethyl sulfoxide (DMSO) were purchased from FUJIFILM Wako Pure Chemical Corporation (Osaka, Japan). Ammonia solution (28%) was purchased from Kanto Chemical Industry (Tokyo, Japan). A 24-well tissue culture polystyrene (TCPS) plate was purchased from Thermo Fisher Scientific (Waltham, MA, USA).2.2 Fabrication of SPE-PRX surfaces
SPE-PRX copolymers with an α-CD threading number of 5.1 (SPE-PRX5) or 86.1 (SPE-PRX86) (Fig. 1A) were dissolved in DMSO at a concentration of 0.05 wt%. Next, 30 μL of solution was spread on the 24-well TCPS surfaces and dried at 60 °C for 18 h to obtain SPE-PRX surfaces. All SPE-PRX surfaces were sterilized via ultraviolet irradiation for 20 min on a clean bench and washed three times with 500 μL of PBS before the cell experiments. | ||
Fig. 1 (A) Chemical structure of SPE-PRX. (B) Preparation of SPE-PRX surfaces and mineralization of HBMSCs co-cultured with HUVECs on SPE-PRX surfaces. For induction of osteoblastic differentiation, HBMSCs and HUVECs were seeded on SPE-PRX5 or SPE-PRX86 surfaces at the following cell densities: HBMSCs at 2.5 × 10⁴ cells per cm2 (HBMSC2.5), HBMSCs at 5.0 × 10⁴ cells per cm2 (HBMSC5.0), HBMSCs and HUVECs (1![[thin space (1/6-em)]](https://www.rsc.org/images/entities/char_2009.gif) :1) at total density of 5.0 × 10⁴ cells per cm2 (HBMSC2.5 + HUVEC2.5), and HUVECs at 5.0 × 10⁴ cells per cm2 (HUVEC5.0). :1) at total density of 5.0 × 10⁴ cells per cm2 (HBMSC2.5 + HUVEC2.5), and HUVECs at 5.0 × 10⁴ cells per cm2 (HUVEC5.0). | ||
2.3 Cell culture
HBMSCs (Lonza) were cultured in an HBMSC growth medium and used at passage 7. HUVECs (Lonza) were cultured in HUVEC growth medium and used at passage 5–8. For alizarin red S staining and real-time reverse transcription polymerase chain reaction, HBMSCs and HUVECs were seeded on SPE-PRX5 or SPE-PRX86 surfaces at the following cell densities: HBMSCs at 2.5 × 10⁴ cells per cm2 (HBMSC2.5), HBMSCs at 5.0 × 10⁴ cells per cm2 (HBMSC5.0), HBMSCs and HUVECs (1:1) at a total density of 5.0 × 10⁴ cells per cm2 (HBMSC2.5 + HUVEC2.5), and HUVECs at 5.0 × 10⁴ cells per cm2 (HUVEC5.0) (Fig. 1B). After 24 h of incubation, the growth medium was replaced with mixed differentiation medium (HBMSC differentiation medium and HUVEC growth medium at a ratio of 1:1). The medium was changed every 3 d.
2.4 Morphology and proliferation of HBMSCs
HBMSCs were seeded on SPE-PRX5 or SPE-PRX86 surfaces at a density of 2.0 × 10³ cells per cm2 and cultured in HBMSC growth medium at 37 °C in a humidified atmosphere with 5% CO2 for 6 d. After 24 h of culture, the adhesion area and aspect ratio of cells were analyzed using ImageJ (NIH, Bethesda, MD, USA). The aspect ratio was determined by approximating the cell shape to an ellipse and dividing the long axis by the short axis. At least 29 cells from each surface were analyzed. The cellular density was determined by counting the cells from the captured images at a 1 d interval over 6 d of culture. The adherent cells were observed using a phase contrast microscope (IX71, Olympus) equipped with a dual CCD digital camera (DP80, Olympus). The doubling time of cells on SPE-PRX surfaces was calculated from the change in the number of adherent cells from 72–144 h.2.5 YAP immunostaining of HBMSCs
HBMSCs were seeded on SPE-PRX5 or SPE-PRX86 surfaces at a density of 2.0 × 10³ cells per cm2 and cultured in HBMSC growth medium at 37 °C in a humidified atmosphere with 5% CO2 for 2 d. Cells were then washed with PBS, fixed in 4% paraformaldehyde at 25 °C for 10 min, and permeabilized with 50 μg mL−1 digitonin for 5 min. Cells were washed with PBS and blocked with 3% BSA in PBS for 60 min at 25 °C. Next, the cells were treated with rabbit monoclonal anti-YAP (1:1000) primary antibody in 1% BSA in PBS for 18 h at 4 °C. After washing with PBS, cells were treated with Alexa Fluor® 488 goat anti-rabbit IgG H&L (1:2000) secondary antibody in 1% BSA in PBS for 60 min at 25 °C. To evaluate subcellular localization, the number of cells representing nuclear and cytoplasmic YAP was counted for more than 140 cells from four samples. Nuclear DNA was stained with Hoechst 33342 (1:500). Cells were washed with PBS, and images were acquired using a confocal laser microscope (FV10i, Olympus).
2.6 Gene expression analysis
After 7 d of culture, total RNA was isolated using the RNeasy Mini Kit (Qiagen, Valencia, CA, USA) according to the manufacturer's protocol. RNA was suspended in nuclease-free water, and the concentration of RNA was measured using a NanoDrop One/Onec spectrophotometer (Thermo Fisher Scientific). Equal quantities of RNA from each sample were reverse-transcribed using a ReverTra Ace qPCR RT master mix (Toyobo, Osaka, Japan) in a T100 thermal cycler (Bio-Rad, Hercules, CA, USA). The reaction conditions were 37 °C for 15 min, 50 °C for 5 min, 98 °C for 5 min, and then, 4 °C for 5 min. Gene expression levels of BMP-2, VEGF, N-cadherin, and COLI relative to the housekeeping gene glyceraldehyde 3-phosphate dehydrogenase (GAPDH) were analyzed using THUNDERBIRD SYBR qPCR mix (Toyobo) on a CFX connect real-time system (Bio-Rad). The primers used for analysis were as follows: BMP-2 (5′-GCCCTTTTCCTCTGGCTGAT-3′ and 5′-TTGACCAACGTCTGAACAATGG-3′), VEGF (5′-AGGAGGAGGGCAGAATCATCA-3′ and 5′-CTCGATTGGATGGCAGTAGCT-3′), N-cadherin (5′-AGTCAACTGCAACCGTGTCT-3′ and 5′-AGCGTTCCTGTTCCACTCAT-3′), COLI (5′-GGAATGAGGAGACTGGCAACC-3′ and 5′-TCAGCACCACCGATGTCCAAA-3′), and GAPDH (5′-CTGACTTCAACAGCGACACC-3′ and 5′-CCCTGTTGCTGTAGCCAAAT-3′) (Life Technologies, Tokyo, Japan). The PCR cycling conditions involved a predenaturation step at 95 °C for 1 min, followed by 40 cycles of 95 °C for 15 s and 60 °C for 1 min as the denaturation step and extension step, respectively. Gene expression levels of BMP-2, VEGF, N-cadherin, and COLI normalized against the housekeeping gene GAPDH were calculated using the 2−ΔΔCT method. For levels of gene expression, data are expressed as a fold ratio relative to data acquired for HBMSC2.5 on the SPE-PRX5 surface.2.7 Alkaline phosphatase staining
ALP staining was performed after 3, 7, and 14 d of cell culture. Adherent cells were washed with PBS three times and fixed with 4% paraformaldehyde for 20 min at room temperature. The fixed cells were washed twice with Milli-Q water and stained using ALP staining kit (Cosmo Bio, Tokyo, Japan) for 20 min at 37 °C. The stained cells were then washed twice with Milli-Q water.2.8 Alizarin red S staining
Alizarin red S staining was performed after 7, 14, and 21 d of cell culture. First, adherent cells were washed with PBS three times and fixed with 4% paraformaldehyde for 10 min at room temperature. Next, fixed cells were washed twice with Milli-Q water and stained with 500 μL of 1% alizarin red S solution in Milli-Q for 20 min at room temperature. The stained cells were then washed five times with Milli-Q water. Images of cells were acquired using a phase contrast microscope (IX71; Olympus) equipped with a dual CCD digital camera (DP80; Olympus). After imaging, the well plates were allowed to air-dry. After drying, 500 μL of DMSO was added to each well, and the wells were kept under mild shaking for 30 min to completely elute the alizarin red S. Thereafter, 200 μL aliquots of DMSO containing alizarin red S from these wells were obtained, and absorbance was measured at 405 nm using a Varioskan LUX multimode microplate reader (Thermo Fisher Scientific).2.9 Statistical analysis
To assess the significance between data, Student's t-test or one-way analysis of variance and post hoc analysis using Tukey's range test for multiple comparisons were conducted. All data are expressed as mean ± standard deviation (S.D.).3. Results
3.1 Morphology and proliferation of HBMSCs
When the adhesion area and aspect ratio of HBMSCs on SPE-PRX surfaces were analyzed, the adhesion area of HBMSCs on SPE-PRX5 surfaces and SPE-PRX86 surfaces were 2950 ± 1160 and 3440 ± 1720 μm2, respectively (Fig. 2A and B). The aspect ratio of HBMSCs on SPE-PRX5 surfaces and SPE-PRX86 surfaces were 4.3 ± 3.2 and 3.8 ± 2.0, respectively. There was no significant difference in the morphology between the SPE-PRX5 and SPE-PRX86 surfaces. In addition, when HBMSCs were cultured on SPE-PRX5 and SPE-PRX86 surfaces for 6 d (Fig. 2C), the doubling times of HBMSCs on SPE-PRX5 surfaces and SPE-PRX86 surfaces were 35.0 ± 4.9 and 28.5 ± 1.1, respectively. The doubling time of cells on SPE-PRX86 surfaces tended to be shorter than on SPE-PRX5 surfaces. | ||
| Fig. 2 Box plots of the adhesion area (A) and aspect ratio (B) of HBMSCs on SPE-PRX5 and SPE-PRX86 surfaces. The top and bottom of the boxes correspond to the first and third quartiles. The line in the middle corresponds to the median, the squares represent the mean, and the whiskers represent the maximum and minimum values of data sets. (C) Growth curves of HBMSCs on SPE-PRX5 (blue) and SPE-PRX86 (orange) surfaces. Data are presented as mean ± S.D., n = 4. | ||
3.2 Subcellular YAP localization of HBMSCs
To analyze the effect of the molecular mobility of SPE-PRXs on nuclear YAP translocation, YAP (green) in adhering HBMSCs on SPE-PRX5 and SPE-PRX86 surfaces were fluorescently stained (Fig. 3A). On SPE-PRX86 surfaces, the proportions of YAP localization in the nucleus only, in both the nucleus and the cytoplasm, and in the cytoplasm only were 4.6%, 16.1%, and 79.3%, respectively (Fig. 3B). In contrast, almost all YAPs in HBMSCs on SPE-PRX5 surfaces were localized in both the nucleus and cytoplasm or in the cytoplasm only. The proportions of YAP localization in the nucleus only, in both the nucleus and the cytoplasm and in the cytoplasm only were 0%, 9.3% and 90.7%, respectively (Fig. 3B). | ||
| Fig. 3 (A) Fluorescent images of YAP localization in HBMSCs on SPE-PRX5 and SPE-PRX86 surfaces after 2 d of culture. Scale bar: 50 μm. (B) The proportion of YAP localized in nucleus (filled bars), both nucleus and cytoplasm (hatched bars), or cytoplasm (open bars) in HBMSCs. | ||
3.3 Expression levels of genes related to cell–cell interaction
To investigate the effect of co-culture of HBMSCs and HUVECs on osteoblastic differentiation, gene expression levels of BMP-2, VEGF, N-cadherin, and COLI were quantified on day 7 (Fig. 4). Co-culture with HBMSC2.5 + HUVEC2.5 showed higher expression levels of BMP-2, VEGF, N-cadherin, and COLI than monocultures of HBMSC2.5, regardless of the degree of molecular mobility. In particular, HBMSC2.5 + HUVEC2.5 showed higher expression levels of BMP-2 and COLI genes than HBMSC5.0, which has twice the number of MSCs as HBMSC2.5 + HUVEC2.5. | ||
| Fig. 4 Gene expression levels of BMP-2, VEGF, N-cadherin, and COLI in HBMSCs and HUVECs on SPE-PRX5 or SPE-PRX86 surfaces after 7 d of culture. Data are presented as mean ± S.D., n = 4. Statistical analyses were conducted via one-way analysis of variance and post hoc analysis using Tukey's range test for multiple comparisons. *p < 0.05 indicates significance. | ||
3.4 Alkaline phosphatase staining
To evaluate the early osteoblastic differentiation of HBMSCs, ALP staining was conducted after 3, 7 and 14 d of cell culture (Fig. 5). Although HUVEC5.0 showed no stainability of ALP, it was observed that HBMSC2.5, HBMMSC5.0 and HBMSC2.5 + HUVEC2.5 showed high stainability of after a 7 d culture. Particularly, HBMSC2.5 + HUVEC2.5 were highly stained within 3 days, suggesting that the co-culture rapidly initiated osteogenic differentiation of HBMSCs, since ALP is an early marker of osteoblastic differentiation.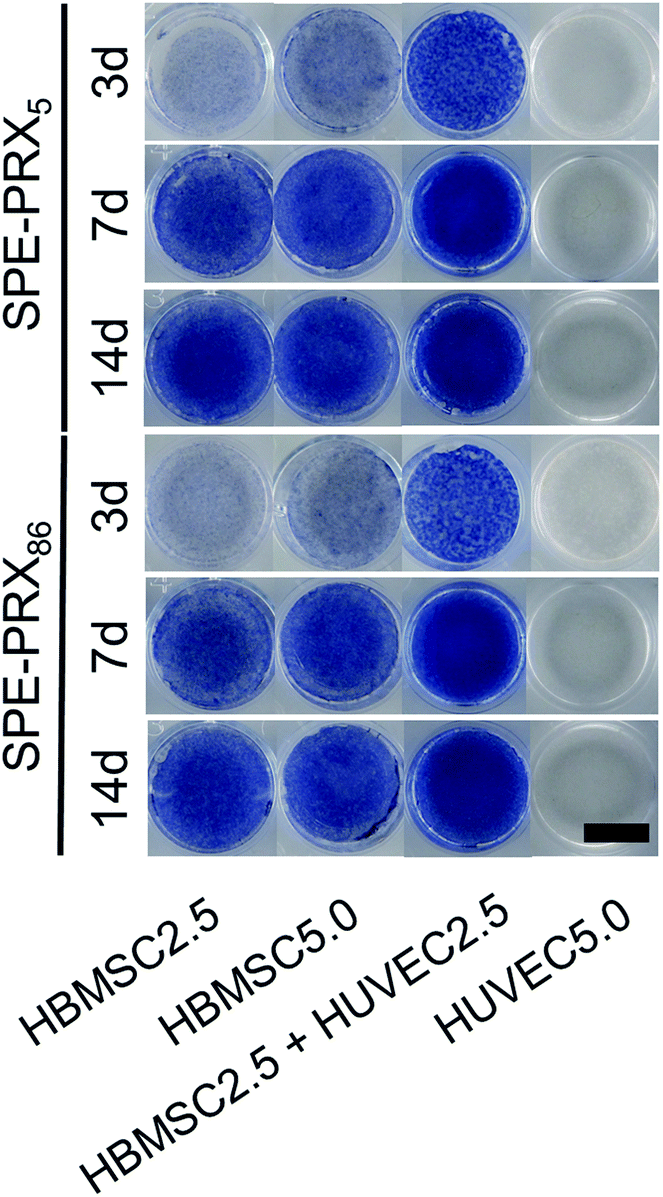 | ||
| Fig. 5 ALP staining images of HBMSCs and HUVECs on SPE-PRX5 and SPE-PRX86 surfaces after 3, 7, and 14 d of incubation in mixed differentiation medium. Whole well images are shown. Scale bar: 10 mm. | ||
3.5 Quantitative analysis of mineralization by alizarin red S staining
Generally, osteoblastic differentiation is demonstrated by mineralization via calcium deposition of which degree is measured by alizarin red S staining.34,35 To reveal the effect of molecular mobility of SPE-PRX on mineralization, alizarin red S staining was performed after 7, 14, and 21 d of cell culture (Fig. 6 and S1†). Although HUVEC5.0 showed no stainability of alizarin red S, all the groups including HBMSCs showed stainability. HBMSC2.5 + HUVEC2.5 showed higher stainability than HBMSC2.5 on day 21. In addition, HBMSC2.5 + HUVEC2.5 showed higher stainability than HBMSC5.0, even though the number of HBMSCs in HBMSC2.5 + HUVEC2.5 is half as large as HBMSC5.0. Furthermore, HBMSC2.5 + HUVEC2.5 on SPE-PRX86 surfaces had higher stainability than on SPE-PRX5 surfaces. Although there was no significant difference in alizarin red S concentration between monoculture or co-culture groups on day 7 and 14, HBMSC2.5 + HUVEC2.5 on SPE-PRX86 surfaces showed the highest concentration in all groups on day 21. The alizarin red S concentration of HBMSC2.5 + HUVEC2.5 on SPE-PRX86 surfaces was approximately two times higher than that of HBMSC2.5 + HUVEC2.5 on SPE-PRX5 surfaces on day 21. All these results indicated that co-culture groups using SPE-PRX surfaces with low molecular mobility strongly enhanced mineralization. | ||
| Fig. 6 (A) Alizarin red S staining images of HBMSCs and HUVECs on SPE-PRX5 and SPE-PRX86 surfaces after 7, 14, and 21 d of incubation in mixed differentiation medium. Whole well images are shown. Scale bar: 10 mm. (B) Time courses of alizarin red S concentration of HBMSC2.5 (diamond), HBMSC5.0 (square), HBMSC2.5 + HUVEC2.5 (circle), and HUVEC5.0 (triangle) on SPE-PRX5 (blue) surfaces and SPE-PRX86 (red) surfaces on day 7, 14, and 21. Data are presented as mean ± S.D., n = 4. | ||
4. Discussion
In the present study, HBMSC mineralization was significantly enhanced by the synergistic effect of SPE-PRX surfaces with low mobility and co-culture with HUVECs. We considered three major factors involved in enhanced mineralization: (i) subcellular YAP localization in HBMSCs induced by SPE-PRX surfaces with low mobility, (ii) crosstalk with soluble growth factors secreted from HBMSCs and HUVECs, and (iii) cell–cell contacts between HBMSCs and HUVECs. Regarding (i) subcellular YAP localization, the nuclear accumulation of YAP/TAZ promotes cell proliferation and osteoblastic differentiation of MSCs.36 Previously, we reported that PRX surfaces with high mobility tend to induce cytoplasmic YAP localization, and PRX surfaces with low mobility tend to induce nuclear YAP localization.37 Based on these reports, it is expected that PRX surfaces with low mobility enhance proliferation and osteoblastic differentiation of MSCs more than PRX surfaces with high mobility. In the present study, proliferation and YAP nuclear translocation of HBMSCs on SPE-PRX86 surfaces was more facilitated than on SPE-PRX5 surfaces, which is consistent with previous reports.38 Concerning (ii) soluble growth factors, many studies have reported that co-culture of MSCs and endothelial cells can enhance osteogenic differentiation of MSCs due to the paracrine effects of cytokines (such as BMP-2 and VEGF) produced by each cell.39–41 In fact, co-culture of HBMSCs and HUVECs using SPE-PRX surfaces increased the gene expression of BMP-2 and VEGF. The secreted BMP-2 and VEGF was quantitatively confirmed by enzyme-linked immunosorbent assay (Fig. S2†). It has been well known that BMP-2 has an ability to strongly induce osteogenic differentiation in vitro and bone regeneration in vivo.29,42 In the present study, the significant upregulation of BMP-2 gene expression in HBMSC2.5 + HUVEC2.5 on day 7 may have promoted higher mineralization of HBMSC2.5 + HUVEC2.5 on SPE-PRX86 surfaces on day 21 than HBMSC2.5 and HBMSC5.0. As for (iii) cell–cell contacts, previous studies reported that N-cadherin-mediated cell–cell contacts may induce intracellular signaling events, leading to osteoblastic gene expression such as COLI.28,43 The expression of N-cadherin and COLI in HBMSC2.5 + HUVEC2.5 cells was significantly higher than that in HBMSC2.5. The following three factors (i) translocating YAP to the nucleus by low molecular mobility, (ii) secreted BMP-2 and VEGF, and (iii) enhanced N-cadherin expression may have synergistically enhanced osteoblastic differentiation and mineralization of HBMSCs (Fig. 7). | ||
| Fig. 7 Promoting mineralization of HBMSCs on SPE-PRX surfaces by synergistic effects of translocating YAP to the nucleus by molecular mobility of SPE-PRX and enhanced cell interaction with HUVECs. | ||
In the present study, HBMSC2.5 + HUVEC2.5 on SPE-PRX86 surfaces on day 21 showed the highest stainability of alizarin red S, an indicator of mineralization, compared to monoculture or co-culture using SPE-PRX5 surfaces. It is obvious that synergy of low molecular mobility of SPE-PRX surfaces and co-culture with HUVECs could strongly facilitate the mineralization.
5. Conclusions
In the present study, we investigated the effect of the molecular mobility of SPE-PRX surfaces on osteoblastic differentiation of HBMSCs co-cultured with HUVECs. On SPE-PRX surfaces with low mobility, YAP nuclear translocation was promoted in HBMSCs. In addition, co-culture of HBMSCs with HUVECs enhanced osteogenesis and angiogenesis-related gene expression more than monoculture of HBMSCs. Mineralization was strongly induced by the synergistic effects of low molecular mobility of SPE-PRX and co-culture of HBMSCs with HUVECs. Promotion of osteoblastic differentiation and mineralization using PRX-based surfaces would be a powerful tool for facilitating bone regeneration in elderly people or patients with osteoporosis.Conflicts of interest
There are no conflicts to declare.Acknowledgements
This work was supported by a Grant-in-Aid for Early-Career Scientists from JSPS [No. 19K20694 to YA], the Grant-in-Aid for Scientific Research (A) from JSPS [No. 16H01852 to N. Y.], the Grant-in-Aid for JSPS Fellow from JSPS [No. 21J14480], interdisciplinary and international project for the development of advanced life-innovative materials and human resources from the Ministry of Education, Culture, Sports, Science, and Technology of Japan (MEXT), and the Cooperative Project among Medicine, Dentistry, and Engineering for Medical Innovation from MEXT.References
- C. Myeroff and M. Archdeacon, J. Bone Jt. Surg., Am. Vol., 2011, 93, 2227 CrossRef PubMed.
- Z. Schwartz, J. T. Mellonig, D. L. Carnes, Jr, J. De La Fontaine, D. L. Cocharan, D. D. Dean and B. D. Boyan, J. Periodontol., 1996, 67, 918 CrossRef CAS PubMed.
- I. Sopyan, M. Mel, S. Ramesh and K. A. Khalid, Sci. Technol. Adv. Mater., 2007, 8, 116 CrossRef CAS.
- T. N. Vo, F. K. Kasper and A. G. Mikos, Adv. Drug Delivery Rev., 2012, 64, 1292 CrossRef CAS PubMed.
- D. Marolt, M. Knezevic and G. Vunjak-Novakovic, Stem Cell Res. Ther., 2010, 1, 10 CrossRef PubMed.
- R. R. Sharma, K. Pollock, A. Hubel and D. McKenna, Transfusion, 2014, 54, 1418 CrossRef CAS PubMed.
- T. Iwata, M. Yamato, Z. Zhang, S. Mukobata, K. Washio, T. Ando, J. Feijen, T. Okano and I. Ishikawa, J. Clin. Periodontol., 2010, 37, 1088 CrossRef CAS PubMed.
- A. Sohni and C. M. Verfaillie, Stem Cells Int., 2013, 2013, 130763 Search PubMed.
- W. Jiang and J. Xu, Cell Proliferation, 2020, 53, e12712 Search PubMed.
- C. Romagnoli and M. L. Brandi, World J. Stem Cell., 2014, 6, 144 CrossRef PubMed.
- W. L. Murphy, T. C. McDevitt and A. J. Engler, Nat. Mater., 2014, 13, 547 CrossRef CAS PubMed.
- A. J. Engler, S. Sen, H. L. Sweeney and D. E. Discher, Cell, 2006, 126, 677 CrossRef CAS PubMed.
- R. McBeath, D. M. Pirone, C. M. Nelson, K. Bhadriraju and C. S. Chen, Dev. Cell, 2004, 6, 483 CrossRef CAS PubMed.
- J. L. Hoon, M. H. Tan and C. G. Koh, Cells, 2016, 5, 17 CrossRef PubMed.
- Y. K. Wang, X. Yu, D. M. Cohen, M. A. Wozniak, M. T. Yang, L. Gao, J. Eyckmans and C. S. Chen, Stem Cells Dev., 2012, 21, 1176 CrossRef CAS PubMed.
- S. Dupont, L. Morsut, M. Aragona, E. Enzo, S. Giulitti, M. Cordenonsi, F. Zanconato, J. L. Digabel, M. Forcato, S. Bicciato, N. Elvassore and S. Piccolo, Nature, 2011, 474, 179 CrossRef CAS PubMed.
- A. J. García, Biomaterials, 2005, 26, 7525 CrossRef PubMed.
- J. H. Seo, S. Kakinoki, Y. Inoue, T. Yamaoka, K. Ishihara and N. Yui, Soft Matter, 2012, 8, 5477 RSC.
- R. Sekiya-Aoyama, Y. Arisaka and N. Yui, Macromol. Biosci., 2020, 20, e1900424 CrossRef PubMed.
- H. Masuda, Y. Arisaka, R. Sekiya-Aoyama, T. Yoda and N. Yui, Polymers, 2020, 12, 924 CrossRef CAS PubMed.
- R. Sekiya-Aoyama, Y. Arisaka, M. Hakariya, H. Masuda, T. Iwata, T. Yoda and N. Yui, Biomater. Sci., 2021, 9, 675 RSC.
- Y. Arisaka and N. Yui, Biomater. Sci., 2021, 9, 2271 RSC.
- A. Tamura and N. Yui, Chem. Commun., 2014, 50, 13433 RSC.
- A. Harada, A. Hashidzume, H. Yamaguchi and Y. Takashima, Chem. Rev., 2009, 109, 5974 CrossRef CAS PubMed.
- J. H. Seo, S. Kakinoki, T. Yamaoka and N. Yui, Adv. Healthcare Mater., 2015, 4, 215 CrossRef CAS PubMed.
- K. Hyodo, Y. Arisaka, S. Yamaguchi, T. Yoda and N. Yui, Macromol. Biosci., 2019, 19, e1800346 CrossRef PubMed.
- Y. Liu, J. K. Y. Chan and S. H. Teoh, J. Tissue Eng. Regener. Med., 2015, 9, 85 CrossRef CAS PubMed.
- H. Li, R. Daculsi, M. Grellier, R. Bareille, C. Bourget and J. Amedee, Am. J. Physiol.: Cell Physiol., 2010, 299, C422 CrossRef CAS PubMed.
- V. Rosen, Cytokine Growth Factor Rev., 2009, 20, 475 CrossRef CAS PubMed.
- M. M. Deckers, M. Karperien, C. van der Bent, T. Yamashita, S. E. Papapoulos and C. W. Löwik, Endocrinology, 2000, 141, 1667 CrossRef CAS PubMed.
- G. Rawadi, B. Vayssire, F. Dunn, R. Baron and S. R. Roman, J. Bone Miner. Res., 2003, 18, 1842 CrossRef CAS PubMed.
- H. Mayer, H. Bertram, W. Lindenmaier, T. Korff, H. Weber and H. Weich, J. Cell. Biochem., 2005, 95, 827 CrossRef CAS PubMed.
- Y. Arisaka and N. Yui, J. Biomater. Sci., Polym. Ed., 2017, 28, 974 CrossRef CAS PubMed.
- G. S. Stein and J. B. Lian, Endocr. Rev., 1993, 14, 424 CrossRef CAS PubMed.
- G. Rawadi, B. Vayssire, F. Dunn, R. Baron and S. R. Roman, J. Bone Miner. Res., 2003, 18, 1842 CrossRef CAS PubMed.
- S. Piccolo, S. Dupont and M. Cordenonsi, Physiol. Rev., 2014, 94, 1287 CrossRef CAS PubMed.
- Y. Arisaka and N. Yui, J. Biomed. Mater. Res., Part A, 2019, 107, 1080 CrossRef CAS PubMed.
- K. R. Arun, Y. Arisaka, S. Iseki and N. Yui, ACS Biomater. Sci. Eng., 2019, 5, 5652 CrossRef PubMed.
- J. Chen, L. Deng, C. Porter, G. Alexander, F. Patel, J. Vines, X. Zhang, D. Chasteen-Boyd, H. J. Sung, Y. P. Li, A. Javed, S. Gilbert, K. Cheon and H. W. Jun, Sci. Rep., 2018, 8, 15749 CrossRef PubMed.
- I. Kocherova, A. Bryja, P. Mozdziak, A. A. Volponi, M. Dyszkiewicz-Konwińska, H. Piotrowska-Kempisty, P. Antosik, D. Bukowska, M. Bruska, D. Iźycki, M. Zabel, M. Nowicki and B. Kempisty, J. Clin. Med., 2019, 8, 1602 CrossRef CAS PubMed.
- J. Kim, H. N. Kim, K. T. Lim, Y. Kim, S. Pandey, P. Garg, Y. H. Choung, P. H. Choung, K. Y. Suh and J. H. Chung, Biomaterials, 2013, 34, 7257 CrossRef CAS PubMed.
- D. H. R. Kempen, L. Lu, T. E. Hefferan, L. B. Creemers, A. Maran, K. L. Classic, W. J. A. Dhert and M. J. Yaszemski, Biomaterials, 2008, 29, 3245 CrossRef CAS PubMed.
- P. J. Marie, J. Cell. Physiol., 2002, 190, 297 CrossRef CAS PubMed.
Footnotes |
| † Electronic supplementary information (ESI) available. See DOI: 10.1039/d1ra01296g |
| ‡ These authors contributed equally to this study. |
| This journal is © The Royal Society of Chemistry 2021 |