 Open Access Article
Application of two morphologies of Mn2O3 for efficient catalytic ortho-methylation of 4-chlorophenol†
Wenying Guia,
Chunlei Zhangb,
Wanchun Zhu a,
Li Zhanga,
Xiaofei Liua,
Hongqiang Zhanga and
Zhenlu Wang
 *a
*a
aKey Laboratory of Surface and Interface Chemistry of Jilin Province, College of Chemistry, Jilin University, Qianjin Road 2699, Changchun, 130012, PR China. E-mail: wzl@jlu.edu.cn; Tel: +86-431-88499140
bThe Education Ministry Key Laboratory of Resource Chemistry, Shanghai Key Laboratory of Rare Earth Functional Materials, College of Chemistry and Materials Science, Shanghai Normal University, 100 Guilin Road, Shanghai, 200234, PR China
First published on 11th June 2021
Abstract
Vapor phase ortho-methylation of 4-chlorophenol with methanol was studied over Mn2O3 catalyst with two kinds of morphologies. Here, Mn2O3 was prepared by a precipitation and hydrothermal method, and showed the morphology of nanoparticles and nanowires, respectively. XRD characterization and BET results showed that, with the increase of calcination temperature, Mn2O3 had a higher crystallinity and a smaller specific surface area. N2 adsorption/desorption and TPD measurements indicated that Mn2O3 nanowires possessed larger external surface areas and more abundant acid and base sites. Simultaneously, in the fixed bed reactor, methanol was used as the methylation reagent for the ortho-methylation reaction of 4-chlorophenol. XRD, XPS, TG-MS and other characterizations made it clear that methanol reduced 4-chlorophenol and its methide, which were the main side-reactions. And Mn3+ was reduced to Mn2+ under the reaction conditions. Changing the carrier gas N2 to a H2/Ar mixture further verified that the hydrogen generated by the decomposition of methanol was not the reason for dechlorination of 4-chlorophenol compounds. Here we summarized the progress of 4-chlorophenol methylation based on the methylation of phenol. Also, we proposed a mechanism of the 4-chlorophenol dechlorination effect which was similar to the Meerwein–Ponndorf–Verley-type (MPV) reaction. The crystal phase and carbon deposition were investigated in different reaction periods by XRD and TG-DTA. The reaction conditions for the two kinds of morphologies of the Mn2O3 catalyst such as calcination temperature, reaction temperature, phenol–methanol ratio and reaction space velocity were optimized.
1. Introduction
4-Chlorophenol and 4-chlorophenol derivatives have many applications in the production and application of the chemical industry, especially the alkylation species of 4-chlorophenol. The derivatives of 4-chlorophenol are a kind of important organic chemical intermediate, which are widely used in pharmaceuticals, pesticides and dye intermediates, such as the brain stimulant chlorzoxazone,1 and the cure of coronary heart disease drug clofibrate; pesticides fenamidone and fenpropion; dye intermediates 5-chloro-2-hydroxyaniline and 1,4-dihydroxyanthraquinone,2–4 etc. With the development of 4-chlorophenol into a variety of pharmaceutical and new dye intermediates in recent years, chemical industry and commercial demands for 4-chlorophenol and its derivatives are increasing with passing year. Therefore, it is crucial to develop an appropriate catalyst with high efficiency of conversion, high selectivity, long operation lifetime and environmentally friendly, energy-saving reaction modes.The traditional way to synthesize alkylated 4-chlorophenol mainly depends on the chlorination of alkylated phenol. A large number of researchers have reported on the chlorination of phenol and its alkylated derivatives. For example, Gusevskaya's group used CuCl2 as the catalyst and chlorinating reagent (Cu2+ is the catalyst and Cl− are used as halogenating agents), and O2 is the oxidant. The result of chlorination and monohalogenation of aromatic phenols was satisfactory.5,6 Kee's group used SO2Cl2 as the chlorinating agent, and the ratio of p-chlorine to o-chlorine in the chlorination products exceeded 50.7 Bovonsombat's used p-toluenesulfonic acid as the catalyst and N-chlorosuccinimide as the source of chlorine, which can react with para-chlorinated phenol analogs at room temperature.8 Sheldon's group applied montmorillonite clay and part of the cation-exchanged L-type molecular sieve as catalyst, SO2Cl2 as the chlorinating agent, and 2,2,4-trimethylpentane as the solvent. The conversion of phenol reached up to 96% at 25 °C. The selectivity of 4-chlorophenol achieved 89%, and the ratio of para-chlorinated substitution to ortho-chlorinated substitution reached up to 8.0.2 Xiong et al. adopted microwave-assisted heating with CuCl2 as the catalyst and hydrochloric acid as the chlorine source to accomplish the complete chlorination of phenol within 60 min.9 Although the conversion rate and selectivity of the above methods are very considerable, it is inevitable to use strong acid and highly toxic SO2Cl2 as chlorination reagent. These problems will arise in the practical application of industrialization, whether in terms of the maintenance of industrial equipment or the safety of experimenters and environmental friendly. Accordingly, we converted train of thought and shifted to the research about the methylation of 4-chlorophenol. Moreover, the gas-phase methylation of phenol with methanol is one of the first cases of a “green chemistry” applied in industry, in which an electrophilic substitution on an aromatic ring was carried out by applying an alcohol.
As far as we know, the research on the ortho-methylation of 4-chlorophenol has not been reported, but there is a lot of works on the ortho-methylation of phenol. Among them, metal oxide catalysts play a vital role, such as α-Fe2O3,10 TiO2,11 MgO,12 Mg–Al–hydrotalcite,13 Fe-doped ZrO2 composites,14 Si–Mn composite oxides,15 CoFe2O4 spinel,16 V2O5–ZrO2,17 Mg/Me/O spinel (Me = Al, Cr, Fe),18 CuxMn3−xO4 spinel,19 Mg–Fe–O composite metal oxide.20 The reason why metal oxides show such high activity and selectivity for ortho-methylation of phenol was mainly based on the vertical adsorption of phenolate species on the surface of the catalyst and the formation of intermediate methyl species. Therefore, in chemical kinetics, methyl species are more likely to attack the ortho position of the phenol ring, forming ortho-substituted phenol (o-cresol) or di-ortho-substituted phenol (2,6-xylenol).
Herein, two kinds of morphologies Mn2O3 catalysts were synthetized by two different approaches, and compared them through a series of characterization analysis, and also evaluated the activity of two kinds of Mn2O3 samples in ortho-methylation of 4-chlorophenol. The results of productivity were satisfied. At the same time, we also discussed the reaction mechanism of the ortho-methylation of 4-chlorophenol and the main side-reaction of this reaction: the dechlorination mechanism of 4-chlorophenol and methylated 4-chlorophenol, and provided a good reference and pavement to develop a series of the high-performance catalysts for ortho-methylation of 4-chlorophenol.
2. Experimental
2.1 Chemicals and materials
Manganous acetate (Mn(Ac)2·4H2O), 25% ammonia solution (NH3·H2O), 4-chlorophenol and hexamethylenetetramine (C6H12N4) were purchased from Sinopharm Chemical Reagent Co., Ltd. Methanol, ethanol and acetone were purchased from Beijing Chemical Works. All chemicals and reagents were of analytical grade and were not purified before used. Water used in the experiments was ultrapure deionized water (resistance 18 MΩ cm). Commercial silicon carbide was washed by water and ethanol for 72 h, respectively. After desiccation, silicon carbide was calcined under 600 °C for 6 h.2.2 Catalyst preparation
The nanoparticle morphology Mn2O3 catalyst (Mn2O3NP) prepared by the precipitation method was according to previously reported methodology with some minor improvements.15 In a typical procedure, 14.7 g Mn(Ac)2·4H2O was dissolved in 100 mL deionized water. Then the above solution was dropwise added into 200 mL 6.5 wt% NH3·H2O diluent at a rate of three drops per second with constant stirring. After the Mn(Ac)2 solution dripped out, aging of the mixture was carried out for 3 h at room temperature. Later, the above liquid was transferred to an evaporating dish, and heated in a water bath at 90 °C for 12 h. Then it was dried in oven at 110 °C for 15 h, and the dried precursor was calcined for 5 h with a 5 °C min−1 ramp rate. The available powders were ready for the o-methylation activity measurements after being crushed and sieved (40–60 mesh).The synthesis of nanowire Mn2O3 catalyst (Mn2O3NW) is as follows. Briefly, 2.45 g Mn(Ac)2·4H2O and 0.70 g C6H12N4 were dissolved in 40 mL deionized water. Finally, the mixture was transferred into a Teflon-lined stainless steel autoclave and statically crystallized at 180 °C for 15 h. The solid–liquid mixture was separated by vacuum filtration and washed with deionized water three times. The filter cake was dried at 80 °C for 12 h, and the dried precursor was calcined for 6 h.
2.3 Catalyst characterizations
The crystalline structure was characterized by X-ray diffraction analysis (XRD) with an Empyrean diffractometer from Rigaku equipped with a 9 kW rotating anode Cu source at 40 kV and 40 mA, from 10° to 80° with a scan rate of 10° min−1. Nitrogen sorption experiment for the measurement of surface area and pore volume was carried out at 77 K on a Micromeritics ASAP 2010N analyzer. The surface chemical composition analyzed by X-ray photoelectron spectrum (XPS) was conducted on a Thermo ESCA LAB 250 instrument equipped with Al Kα radiation (1486.6 eV). The 284.55 eV value of polluted carbon C 1s was used as the nuclear effect of the internal standard calibration sample. Morphologies were tested on a field-emission scanning electron microscope (SEM) instrument (HITACHI SU-8020). Simultaneous thermal analysis (STA) mass spectrometry (MS) analysis were performed on Germany NETZSCH STA499F3 QMS403D\Bruker V70 type simultaneous thermal analysis-mass spectrometry-infrared combined instrument at a heating rate of 10 °C min−1 from 40 °C to 900 °C in air.Temperature programmed desorption (TPD) and temperature programmed reduction (TPR) were recorded on a ChemBET Pulsar TPR/TPD instrument. The profile is obtained by deducting the blank signal of the sample. The acid and base sites were analyzed by using NH3 and CO2 as atmosphere respectively. Typically, 50 mg of catalysts were pretreated at 300 °C in nitrogen flow for 30 min, and then cooled to 50 °C under helium (He) gas. NH3 or CO2 adsorption was carried out at 50 °C for 30 min under NH3 or CO2 gas. After samples were sweeped under He gas for 60 min, the temperature was heated to 600 °C (10 °C min−1). The desorbed gas was determined by a GOW-MAC thermal conductivity detector (TCD). As for H2-TPR, 15 mg samples were treated in an nitrogen flow at 350 °C for 30 min. After the sample was cooled down to 50 °C, 5 vol% H2/Ar mixture was introduced to quartz tube for the catalysts reduction. The temperature was heated to 800 °C with a ramp rate of 10 °C min−1.
2.4 Catalytic testing
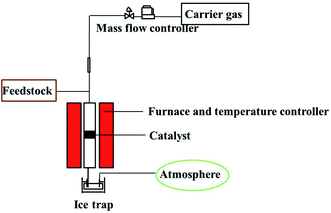
The continuous gas phase reaction of 4-chlorophenol with methanol was carried out in a fixed-bed reactor. It was provided with temperature sensor at the top and bottom to read and control the reaction temperature. The reactor had a tube length of 400 mm and an inner diameter of 8 mm, which was vertically fixed on the heating bed. In a typical run, the lower part of the reaction tube was filled with rolled wire meshes and quartz wool. The mixture of 500 mg catalyst and silicon carbide were packed onto the quartz wool, and the upper portion of the reactor was filled with silicon carbide, which served as pre-heating devices. A mass flow controller was provided for continuous and constant flow of carrier gas (N2) to influx the reactor. A HPLC pump was also equipped with reaction system for constant volume flow of reaction mixture. The effluents was collected by a glass bottle containing 1 mL of acetone and cooled with ice water bath. The exhaust was accessed to atmosphere for the pressure balance in the reactor. The reaction system is shown in the Fig. 1.The composition and content distribution of the products were analyzed by a gas chromatography (Shimadzu GC-14B) equipped with a flame ionization detector (FID) and a capillary column (PV-101; 60 m × 0.25 mm × 0.25 μm). The product identification was analyzed by GC-MS (Shimadzu QP-2010 Plus). The major by products were phenol and o-cresol while others such as 2,6-xylenol, 4-chloro-2,6-xylenol. 2,4-Xylenol and 2,4,6-trimethylphenol were in trace amount.
3. Results and discussion
3.1 Characterization of the catalyst
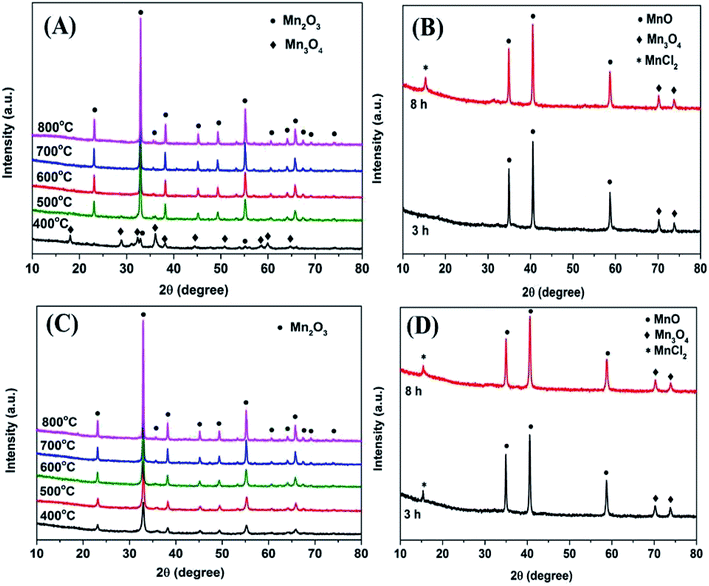
Fig. 2A depicts the XRD patterns of Mn2O3NP at different calcination temperatures. It can be seen that when the calcination temperature was 400 °C, the main diffraction peaks can be assigned as the phase of Mn3O4. The diffraction peaks with 2θ values around 18.0°, 28.9°, 32.3°, 36.1°, 38.0°, 44.4°, 50.7°, 58.5°, 59.6°, and 64.7° were attributed to the characteristic diffraction peaks of Mn3O4. Meanwhile, it can also be observed that the characteristic diffraction peaks of Mn2O3 appeared around 2θ values of 32.9° and 55.1°, indicating that a certain amount of Mn2O3 would be accompanied by calcination at this temperature. When the calcination temperature went up to 500 °C, the diffraction peak of Mn3O4 disappeared and was replaced by Mn2O3, implied that the crystalline phase was transformed from Mn3O4 to Mn2O3. With the calcination temperature increased ulteriorly, the intensity of the diffraction peak gradually heightened. Meanwhile, the widths of the diffraction peaks became narrower, indicating that a clear increase in the crystallite size.15 Fig. 2C shows the XRD diffraction peaks of Mn2O3NW at different calcination temperatures. It can be seen that with the calcination temperature increased, the diffraction peak intensity of Mn2O3NW gradually increased, which was consistent with the tendency of Mn2O3NP. Under the calcination condition of 400 °C, the XRD patterns of Mn2O3NW did not show the characteristic diffraction peak of Mn3O4, which proved that there was no Mn3O4 crystal phase in Mn2O3NW, there were all Mn2O3 phase.XRD characterization on the crystal phase composition of the two spent Mn2O3 catalysts was also performed. As shown in Fig. 2B and D, both Mn2O3NP and Mn2O3NW showed the same diffraction peak pattern after an 8 h reaction. The 2θ value at 15.1° was attributed to the characteristic diffraction peak of MnCl2, it was due to the dehalogenation effect of 4-chlorophenol. In addition, the 2θ values of 34.9°, 40.5° and 58.6° were the characteristic diffraction peaks of MnO, and the 2θ values of 70.2° and 74.0° were the characteristic diffraction peaks of Mn3O4. This was indicated that with the reaction proceeding, Mn3+ was reduced to Mn2+. One part of the reason was that during the methylation reaction, the H2 produced by the methanol decomposition reduced Mn3+ to Mn2+, which further formed a more stable M2+–M3+–O phase.21 Another part was that formaldehyde was an active specie formed by the dehydrogenation of methanol. During the formaldehyde formation process, part of the O2− from the surface of the catalyst was taken away.12 Significantly, 3 h of reaction time, Mn2O3NP did not exhibit a MnCl2 diffraction peak but Mn2O3NW emerged. The main reason was that Mn2O3NW possessed more active sites in dehalogenation process. In addition, it can be conclude that the dehalogenation was a cumulative process on the Mn2O3 surface.
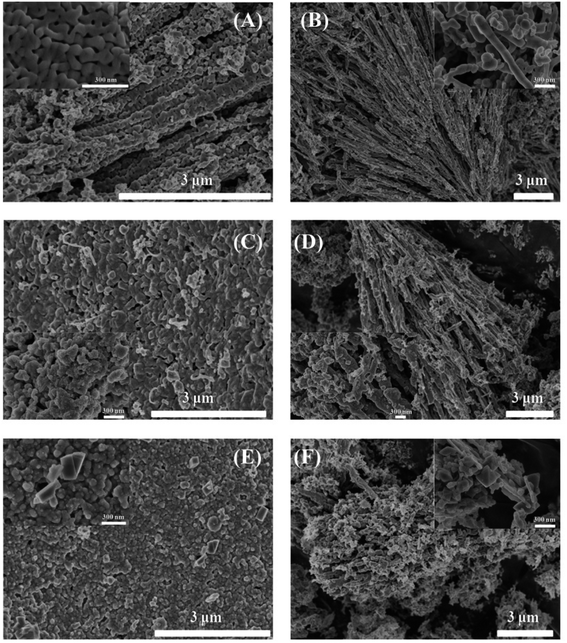
The SEM images in Fig. 3 displayed the morphology of these fresh and spent samples. Fresh Mn2O3NP catalyst was sintered from nanoparticles, and its abundant porosities originated from the nanoparticles sintertion and stacking. After 3 h reaction, owing to coke deposition and the transformation of crystalline phase, it can be seen in Fig. 3C that the surface of catalyst became rough and the number of porosities decreased significantly. With reaction to 8 h, in Fig. 3E, the porosity of the catalyst was further lost. The enlarged SEM image in Fig. 3E showed that there were some microcrystals neighboring the porosities. Integrating the results of XRD characterization, this may be the new generation of MnCl2. In Fig. 3B, Mn2O3NW exhibited a nanowire structure instead of nanorod, different synthesis methods made Mn2O3NW show different morphologies from Mn2O3NP. Mn2O3NW spent samples in 3 h and 8 h were displayed in Fig. 3D and F, respectively. The enlarged SEM image in Fig. 3D revealed that microcrystal had been formed on 3 h spent Mn2O3NW, that was different from Mn2O3NP but in agreement with the XRD results.
In order to investigate the surface chemical composition and valence state of fresh and 8 h spent catalyst, XPS survey scan of fresh Mn2O3NP catalyst indicated the presence of Mn, O in Fig. 4A while after the reaction mainly contained four elements: Mn, O, C and Cl (see Fig. 5A). The above results indicated that the physical and chemical state on the catalyst surface has changed significantly after the ortho-methylation reaction. Obviously the C (1s) peak appeared after 8 h reaction, which can be attributed to carbon deposition. The emergence of Cl (2p) peak implied that the dehalogenation of 4-chlorophenol in pace with the reaction process. For fresh catalyst in Fig. 4B, the Mn 3s spectrogram contains two sets of multiplet splitting peak. The D-value of the binding energy (ΔE) was 5.15 eV, it was close to the ΔE = 5.4 eV of Mn3+ reported in the literature,22 indicating that the main valence of Mn in fresh Mn2O3NP catalyst was +3. As for the 8 h spent catalyst (Fig. 5B), the ΔE was 6.25 eV which closed to the reported 6.1 eV of Mn2+.22 It was proved that after the ortho-methylation reaction of 4-chlorophenol, MnO and Mn3O4 were the major components of the catalyst. In addition, the Mn spectrogram embodies two peaks of Mn 2p3/2 and Mn 2p1/2 (Fig. 4C). Around Mn 2p doublet spectra of Mn 2p3/2 and Mn 2p1/2, the characteristic satellite peak of MnO appeared in the 8 h spent catalyst. It was indicated that the Mn in the Mn2O3NP catalyst was reduced from +3 valence to +2, which was consistent with the binding energy results of Mn 3s and the XRD patterns. Therefore, with the reaction proceeds, the Mn2O3 phase was gradually reduced to MnO and Mn3O4.
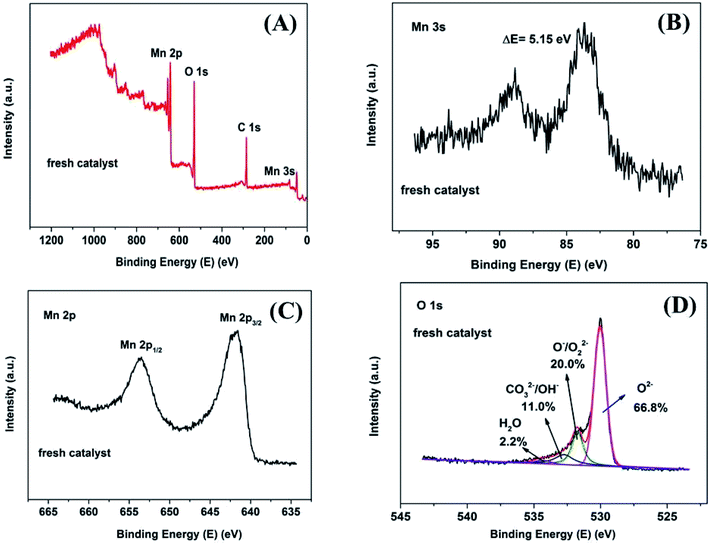 | ||
| Fig. 4 XPS spectrum of fresh Mn2O3NP samples: (A) survey scan XPS spectra; (B) Mn 3s detailed XPS spectra; (C) Mn 2p detailed XPS spectra; (D) O 1s detailed and fitted XPS spectra. | ||
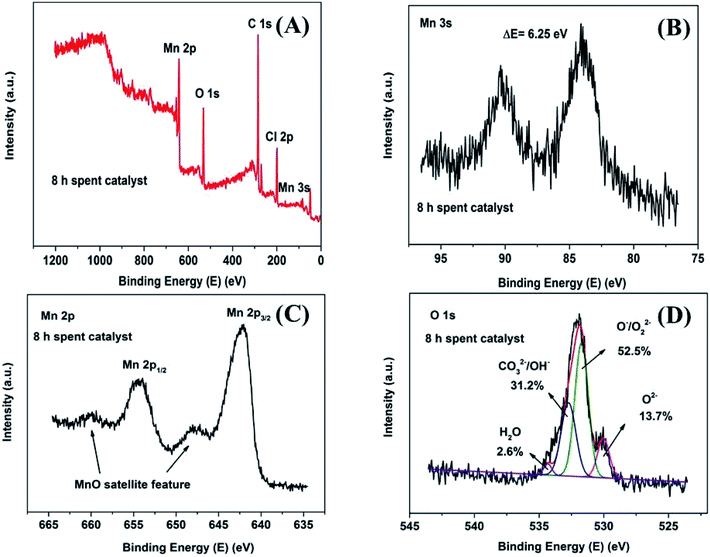 | ||
| Fig. 5 XPS spectrum of 8 h spent Mn2O3NP samples: (A) survey scan XPS spectra; (B) Mn 3s detailed XPS spectra; (C) Mn 2p detailed XPS spectra; (D) O 1s detailed and fitted XPS spectra. | ||
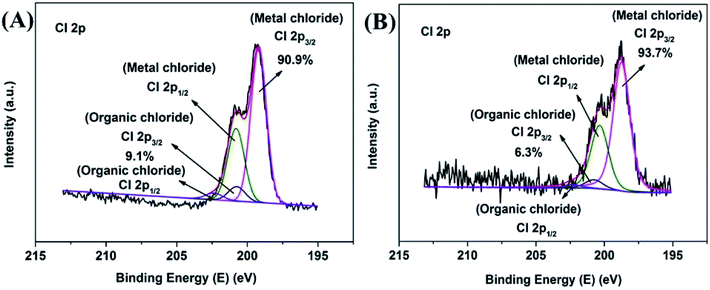
The O 1s XPS spectra are presented in Fig. 4D and 5D. The XPS spectra show the broad doublet peaks in fresh and 8 h spent catalysts. For Fig. 4D, the first peak at about 529.6–529.8 eV was attributed to oxygen ions (O2−) in the crystal lattice oxygen23–25 while the second peak near 533 eV could be distinguished into three sets of peaks, which were referred to adsorbed oxygen species (∼531.4 eV),25 carbonate species and hydroxyl (∼532.4 eV), as well as adsorbed water (∼534.0 eV).26 The area integration of the above-mentioned fitted peaks showed that in fresh catalyst, the lattice oxygen species (O2−) accounted for 66.8% of the oxygen elements, and the adsorbed oxygen species (O−/O22−) accounted for 20.0%, the proportion of hydroxyl and carbonate species (OH−/CO32−) was 11.0%, and the ratio of adsorbed water was 2.2%. The lattice oxygen occupied a large number of all oxygen elements. It was obviously that the intensity of the O 1s high binding energy region was higher than the low part, which indicated that the lattice oxygen species on the catalyst surface gradually transformed into other forms of oxygen species with the reaction proceeding. Specifically, the lattice oxygen decreased from 66.8% to 13.7%, the adsorbed oxygen species, hydroxyl and carbonate species increased to 52.5% and 31.2%, respectively. Almost, the content of adsorbed water was unchanged. This illustrated that the reactants could be destroy the lattice structure on the catalyst surface, causing the lattice oxygen change to other forms of oxygen species. It is worth noting that the increase in the content of carbonate could be due to the formation of carbon dioxide which produced by the methanol decomposed. Also, the hydroxyl may be formed by the dehalogenation process simultaneously. Similarly, Fig. 6 showed the binding energy of Cl 2p orbital electrons on the surface of the catalyst after 8 h reaction. By fitting the peaks of the Cl 2p XPS spectrum, in the low binding energy region, it can be obtained that the binding energy of the Cl 2p3/2 around 199.0 eV was the metal chloride, and the signal near 200.6 eV was metal chloride (Cl 2p1/2). The spin orbit splitting energy of Cl 2p in metal chloride state was 1.6 eV, which was consistent with previous study.27 In addition, it can be obtained by XPS peak differentiating analysis that the main form of Cl element on the surface of a 8 h spent catalyst was MnClx, which accounted for 90.9% of all chlorine elements. It was illustrated that the source of Cl was from the reduction of 4-chlorophenol or its methylated derivatives (can be regarded as HCl), instead of 4-chlorophenol or its methides adsorbed on the surface of the catalyst. In the same way, Mn2O3NW showed a similar distribution of chlorine elements (Fig. 6B).
In Fig. S1 and S2,† Mn2O3NW showed the same tendency as Mn2O3NP in the XPS total spectrum and the 3s binding energy, 2p orbital binding energy and O 1s binding energy of Mn. The reason was completely consistent with the above explanation.
Nitrogen adsorption/desorption measurements were performed to investigate the porosity of the obtained samples. As represented in Fig. 7A, all the isotherms were type IV as defined by IUPAC, characteristic of mesoporous structure. An obvious H3 hysteresis loop in the region of 0.8 < P/P0 < 1.0 was observed. The adsorption/desorption isotherms show a sharp increase at P/P0 from 0.8 to 1.0 due to the capillary condensation of nitrogen within the mesoporous.28 It can be seen that the amount of N2 adsorbed gradually decreased with increasing the calcination temperature, which was due to the crystal particles sintering and growth accompanied by a significant decrease in surface area from 11.9 to 3.6 m2 g−1 (Table S1†). Assabumrungrat and Laosiripojana found that the specific surface area decreases with increasing calcination temperature.29 The textural parameters are shown in Tables S1 and S2.† The low pore volume and pore diameter (4 V/S) of Mn2O3 samples were due to the thermal sintering during the calcination procedure, which led to the blockage of pores. Notably, Mn2O3NW samples possessed larger external surface areas (5.6–27.9 m2 g−1) and significantly increased pore volume (0.010–0.109 cm3 g−1) compared with those of Mn2O3NP samples. That was due to the hexamethylenetetramine and Mn2+ build a sort of topological junction abundant supramolecular aggregates which proceed to 1-dimensional structural precursor.30–32 Thus, Mn2O3NW possessed more channels and textural information than the Mn2O3NP.
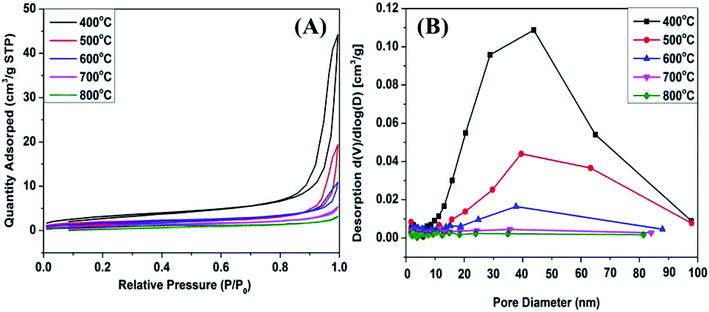 | ||
| Fig. 7 (A) N2 adsorption/desorption isotherms of Mn2O3NP catalysts; (B) BJH pore distribution curves of Mn2O3NP catalysts. | ||
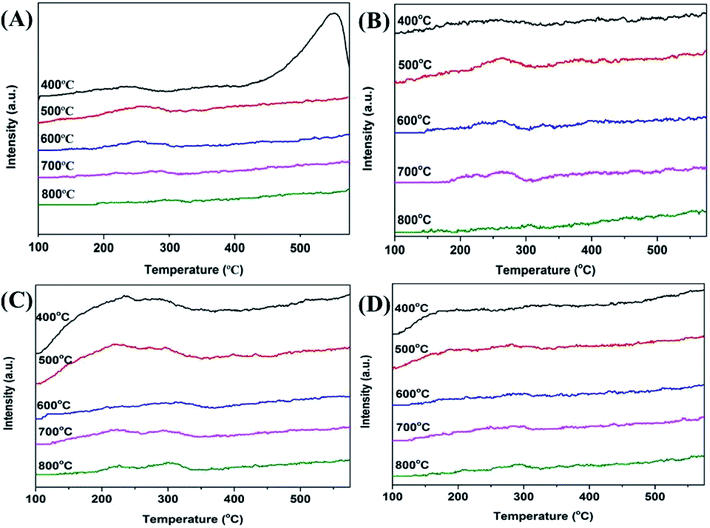
It has been reported that both the acid and base sites are important for the ortho-methylation of phenol.14 Hence, the strength and qualitative analysis of the acid and base sites on the surface of the Mn2O3 catalysts were determined using stepwise TPD of NH3 and CO2. The desorption temperature revealed the acid and base strengths of the catalysts. The higher desorption temperature, the stronger acid or basic strength of the catalyst. The desorbed NH3 appearing at ≤150 °C should be corresponded to the hydrogen-bonded and physically adsorbed NH3.33 The ammonia molecules desorbed at higher temperature were attributed to acid-bonded NH3, and the acid sites could be defined as weak (≤150 °C), medium (150–300 °C), strong (300–450 °C), and very strong (≥450 °C).34 From the NH3-TPD profiles of the Mn2O3NP under different calcination temperatures in Fig. 8A, it can be seen that all the catalysts present a desorption peak at a range of 150–350 °C. With the calcination temperature increased from 500 to 800 °C, the TPD profiles became inapparently. Thus, the amount of medium acid sites showed a decreasing trend. This explained that the particle size of the catalyst became larger and the specific surface area became smaller with the calcination temperature increased. This was consistent with the characterization results of XRD and N2 adsorption–desorption experiments. When baked at 400 °C, the desorption peak of NH3 appeared in the temperature more than 500 °C, indicating that there were very strong acid sites on the surface of the catalyst. This was due to the calcination of the catalyst at 400 °C, the ambient temperature was not enough for the oxygen to completely oxidize the precursors to +3 valence, but a mixed valence state of +2 and +3. In principle, Mn2+ bound less O2− than Mn3+, and the Mn on the catalyst surface was in an oxygen-depleted state. Therefore, compared with Mn3+, Mn2+ exposed more positions to bind with NH3 adsorption, and showed a very strong acid desorption peak on NH3-TPD. NH3-TPD curve of Mn2O3NW showed a completely different trend from that of Mn2O3NP. As shown in Fig. 8C, under the calcination conditions of 400–500 °C, the number of acid sites of Mn2O3NW was numerous, and when calcination exceeded 600 °C, the acid sites were significantly reduced. Since Mn2O3NW catalyst formed a stable Mn2O3 phase at a calcination temperature of 400 °C, the change in the number of acid sites can be attributed to the reduction of the catalyst surface area which caused by thermal sintering.
From the CO2-TPD profiles of the Mn2O3 with different calcination temperatures shown in Fig. 8B and D, it can be seen that all the catalysts present a desorption peak at a range of 100–300 °C which corresponded to the weak base sites.35 From the desorption profiles of CO2 (Fig. 8B), the amount of weak base sites decreased with the increase of calcination temperatures (500–800 °C). When the calcination temperature increased from 400 to 500 °C, the number of weakly basic sites increased significantly, indicating that the basicity of the catalyst was increased. This was because the Mn2O3NP calcined at 400 °C was a mixed phase of Mn2O3 and Mn3O4. Since the average combined O2− of Mn2+ in Mn3O4 was less than the number of Mn3+, therefore, less O2− was exposed on the entire catalyst surface, so the alkalinity was less than that calcined at 500 °C. When calcined at a temperature above 500 °C, a stable Mn2O3 crystal phase has been formed. With the temperature increased, the thermal sintering of the crystal particles intensified, the specific surface area of the catalyst decreased and the corresponding basic sites on the surface also decreased. The trends of the CO2-TPD profiles of Mn2O3NW were similar to its NH3-TPD, which can also be attributed to the thermal sintering at high temperature. That was the reason why the number of basic centers on the catalyst surface to decrease with the calcination temperature increased.
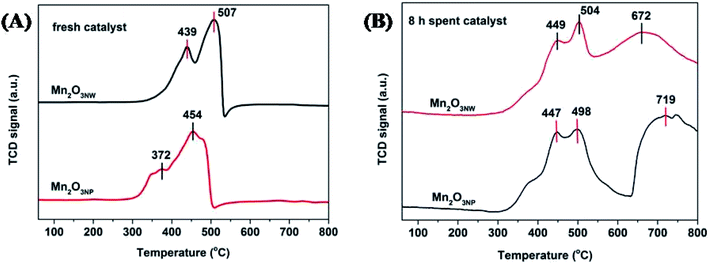
The influence of different morphologies was also reflected on reducibility as depicted by Fig. 9A. The peak appearing at temperature below 550 °C were assigned to hydrogen consumption by surficial oxygenic species that includes chemically adsorbed oxygen (OChem) at 372–439 °C and surficial lattice oxygen (OLatt,S) at 454–507 °C.36 Obviously, the reduction temperature of Mn2O3NP was lower than that Mn2O3NW, which indicated that the oxygen species on the surface of Mn2O3NP were more active. As shown in Fig. 9B, it is the H2-TPR spectra of the two catalysts after 8 h reaction. Maybe the coke deposited on the surface of the catalysts, the OChem and OLatt,S were covered. Hence, the reduction temperatures for OChem and OLatt,S increased after 8 h reaction. Also, there were two peaks of H2 consumption in the range (672–719 °C) which was attributed to the reduction peak of the lattice oxygen in the bulk (OLatt,B).37 It is not difficult to find that the reduction temperature of the OLatt,B of Mn2O3NW was lower than the Mn2O3NP. That indicates that the nanowire structure inhibited reactivity of oxygenic species on surface of Mn2O3, but the strong interaction between Mn3+ and OLatt,B accelerated migration of OLatt,B to the surface, which can promote the methanol catalytic oxidation to formaldehyde.
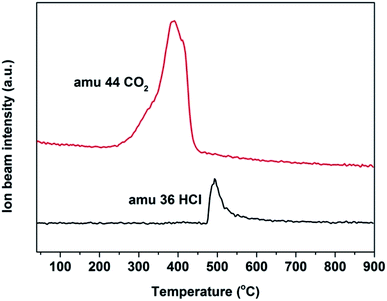
In the methylation of 4-chlorophenol with methanol, with the reaction progressed, Mn3+ will be reduced to Mn2+ and the oxygen species will be consumed. In addition, the amount of coke deposited on the catalyst surface at different times would be significantly different. In order to analyze the oxygen uptake behavior and coke deposition at different periods of the reaction, TG and DTA analysis were carried out in air. In Fig. 10A and C, it can be seen that the thermal stability of the two fresh Mn2O3 catalysts was very good. With the reaction progressed, it was found that the spent catalyst had two curves with weight decrease in the range of 50–200 °C and 350–500 °C. The former was attributed to the thermal weight loss of the catalyst adsorbing water, while the latter was due to the removing of the coke deposited on the catalyst surface. The longer the reaction carried out, the greater the thermal weight loss of the catalyst at 350–500 °C, indicating that the amount of coke deposited increased with the progress of the reaction time. It can be seen that the spent catalyst has a weight increase at 200–350 °C. It was reasonable that the weight increase caused by oxygen regeneration from air.38 Combined with the TG-MS chart of Mn2O3NP, it can be seen that in the main weight loss part of the catalyst (350–500 °C), peaks of CO2 and HCl appeared (Fig. 11), which proved that CO2 and HCl were formed from the catalyst within this temperature range. There is no doubt that CO2 was generated by the complete combustion of coke deposited in an air atmosphere. Combined with the analysis of XPS and XRD, it can be concluded that the HCl was produced by MnCl2 in spent catalyst. When the temperature exceeded to 500 °C, the catalyst showed a curve of weight increase. This was the fact that the oxygen in the air supplemented the anion vacancies after the exit of the crystal lattice Cl− under high temperature conditions, and was embedded in the crystal lattice of the catalyst in the form of O2−, which was also another type of oxygen weight increase.
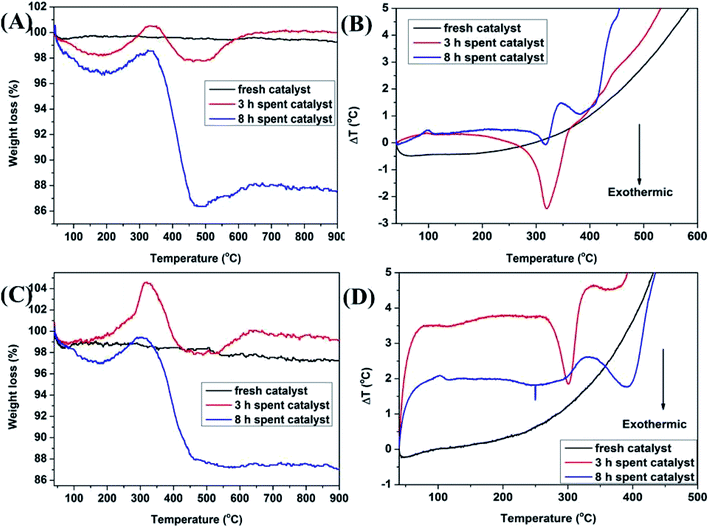 | ||
| Fig. 10 (A) TG curves of Mn2O3NP catalyst; (B) DTA profiles of Mn2O3NP catalyst; (C) TG curves of Mn2O3NW catalyst; (D) DTA profiles of Mn2O3NW catalyst. | ||
Fig. 10B and D displayed the DTA spectrum of the catalyst. It can be seen that the spent catalyst had an obvious exothermic peak in the temperature range of 300–400 °C. This was because the catalyst emitted heat when the coke burned in an air atmosphere. The amount of coke deposited on the catalyst surface gradually increased with the progress of the reaction, and the intensity of the exothermic peak of the catalyst for 8 h should be stronger than the 3 h. However, the obtained thermal curves were the opposite conclusion. The reason may be that with the reaction progressed, the crystal lattice Cl on the catalyst surface gradually increased which made the crystal lattice structure more perfect, which was not conducive to the formation of coke deposited though the mass of coke increased. In other words, the increase in the crystal lattice Cl reduced the un-saturation sites exposed by the Mn element, that is, the acid sites decreased, so the formation of coke was hindered. In another aspect, the endothermic effect of decomposing MnCl2 was greater than the exothermic effect of coke combustion.
3.2 Reaction mechanism of o-methylation of 4-chlorophenol and the dechlorination mechanism of chlorophenol
Regarding the research on the reaction mechanism of the ortho-methylation of phenolic compounds catalyzed by metal oxides, Tanabe initiated pioneering work.39 By comparing the infrared spectra of phenol in acidic oxides and basic oxides, it was found that phenol dissociated and adsorbed on the surfaces of the two types of catalysts. The difference was that for acidic oxides, the aromatic ring of the phenate was adsorbed parallelly on the surface of the catalyst, so every position of the aromatic ring was easily attacked by the methylating agent. As for the basic oxides, due to the mutual repulsion between the large π-bonded electron cloud of the aromatic ring and the electron-rich Lewis base center (O2−) on the surface of the catalyst, the aromatic ring was kept away from the surface of the catalyst and adsorbed vertically on the surface of the catalyst. Since the ortho position of the hydroxyl O was closer to the surface of the catalyst, it was more likely to be attacked by the methylating agent, thus ensuring extremely high ortho selectivity. Regarding the methyl active species in the methylation reaction of methanol and phenolic compounds, Mathew believed that the H+ generated by the dissociation and adsorption of phenol and protonated methanol, and then a molecule of H2O was left to form CH3δ+, which then attacked the aromatic ring.40 Cavani brought forward a completely different view, methanol was first converted to formaldehyde on the surface of the catalyst, and formaldehyde as the actual methylated species attacked the ortho position of the phenolic hydroxyl group.12 Our work proved the correctness of Cavani's view through experiments and referred other similar works.The first step was the dehydrogenation of methanol. The active site for methanol's dehydrogenation reaction was the terminal Mn![[double bond, length as m-dash]](https://www.rsc.org/images/entities/char_e001.gif) O site, which generated hydroxyl and methoxy species. The terminal oxygen was considered to be the most stable site for hydrogen adsorption41 (g = gas phase, a = adsorbed species).
O site, which generated hydroxyl and methoxy species. The terminal oxygen was considered to be the most stable site for hydrogen adsorption41 (g = gas phase, a = adsorbed species).
| CH3OHg + Ot → CH3Oa + OHa |
Next, attacking of the bridging oxygen on the adsorbed methoxy species yielded a hydroxyl and adsorbed formaldehyde. The crack of the C–H bond of the methoxy group was deemed as the rate-determining step in formaldehyde formation, and required a higher temperature for activation than the first process.
| CH3Oa + Ob → H2COg + OHa |
Two hydroxyl groups recombination occurred to yield H2O from the surface of the catalyst.42 The remaining oxygen ion vacancies were filled by the migration of the bulk lattice oxygen inside the catalyst to ensure that the catalyst maintained regular activity and selectivity.
The generated formaldehyde had good positive carbon electrophilic properties and the aromatic ring possessed the electron rich delocalized electron cloud.20 The carbon of formaldehyde attacked the 4-chlorophenate species, forming 5-chloro-salicylic alcohol species with hydroxymethyl moieties. In detail, the positively charged carbon attacked the ortho position of the aromatic ring O to form a transition state intermediate species. Because of the aromatic ring was in an electron-deficient state, the electron from the C–H covalent bond restores the aromatic ring original appearance. The generated H+ combined with the O of the aldehyde group to generate a hydroxymethyl moiety (Scheme 1).
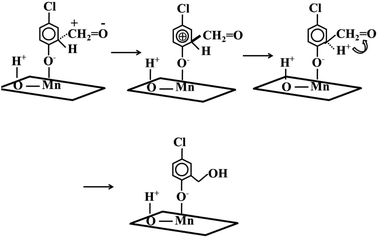 | ||
| Scheme 1 Dissociation and adsorption of 4-chlorophenol and the attack of formaldehyde to aromatic ring. | ||
The resulting 5-chloro-salicylic alcohol generated 4-chloro-2-cresol through a series of complex processes (Scheme 2). Significantly, 5-chloro-salicylic alcohol can generate almost equimolar 5-chloro-salicylic aldehyde and 4-chloro-2-cresol through an intermolecular disproportionation reaction. A slightly higher formation of 5-chloro-salicylic aldehyde can be attributed to the dehydrogenation of the alcohol.20 The same type of reaction has been widely reported, such as the intermolecular disproportionation of ethanol into ethane and acetaldehyde, catalyzed by reduced vanadium oxide.43 Also, benzyl alcohol disproportionated into toluene and benzoic aldehyde.44
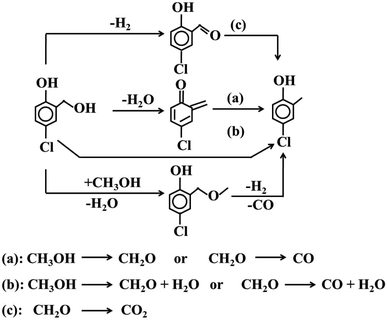 | ||
| Scheme 2 Summary of the hypothesis for transformation of the intermediately formed 5-chloro salicylic alcohol into 4-chloro-2-cresol during 4-chlorophenol methylation with Mn2O3 catalysts. | ||
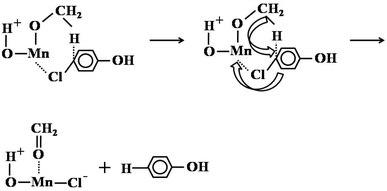
Unlike the main side reactions of ortho-methylation of phenol with methanol (excessive methylation of phenol), the dechlorination of 4-chlorophenol compounds was the main side reaction. The dechlorination reaction of 4-chlorophenol compounds was most directly and easily associated with the hydrogen generated by the decomposition of methanol in high temperature. However, by changing the carrier gas N2 to H2/Ar mixture with 10% H2 content, we found that the selectivity of 4-chlorophenol compounds has not changed, and even the selectivity has increased slightly (Table S11†). Therefore, it showed that the hydrogen generated by the decomposition of methanol was not the reason for dechlorination of 4-chlorophenol compounds. We believed that methanol was used as a nucleophile and reducing reagent to reduce 4-chlorophenol compounds. This was due to a mechanism similar to Meerwein–Ponndorf–Verley-type (MPV) reaction.45 Next, it involved the substitution of chlorine from methanol hydrides (Scheme 3). Specifically, methanol dissociated and adsorbed on the surface of Mn2O3, and the dissociated methoxy ions and H+ were adsorbed on metal ions and oxygen ions, respectively. Chlorine in 4-chlorophenol compounds (take 4-chlorophenol as an example) was electron-rich, so it was easier to combine with oxygen-coordinated unsaturated Mn. At the same time, the negative hydrogen attacked the C–Cl bond, forming a thermodynamically stable six-membered cyclic transition state. Finally, negative hydrogen replaced the chlorine, and the adsorbed methoxy ions became formaldehyde and removed from the catalyst surface. Even though methanol was used as H transfer reagents, the MPV reaction usually occurred in the reduction of aromatic aldehydes and ketones. However, in the process of 4-chlorophenol dechlorination, the manganese oxide catalyst introduced new chloride ions and hydrogen oxygen, this was consistent with the XPS characterization results of the catalyst after the reaction (the increase in the content of hydroxide ions and carbonate ions and the chlorine element was a metal chloride), which further illustrated the rationality of the explanation of the dechlorination mechanism.
3.3 Catalytic activity results
In this reaction, the products were 4-chloro-2-cresol, phenol, 2-cresol, 2,6-xylenol, 2,4-xylenol, 2,4,6-trimethylphenol, 4-chloro-2,6-xylenol. Probably due to the catalyst and the reaction temperature range, this reaction did not generate 4-chloro-anisole or anisole substances. In many previous work, phenol and methanol produced anisole instead of o-cresol under alkaline catalysts (such as MgO) and at low temperature. However, in this work, the formation of anisole or 4-chloro-anisole was not detected.Table S3† showed the reaction activity and product selectivity of Mn2O3NP under different calcination temperatures. It can be seen that with the calcination temperature increased, the activity of the catalyst gradually decreased. The sintering effect was responsible for low catalytic activity. The sintering effect led to the decrease in the number of active centers on the surface of the catalyst, which was also proved by the NH3/CO2-TPD characterization. With the increase of the calcination temperature, the number of medium acid and weak base centers decreased significantly. The catalyst calcined at 400 °C had more acid sites on the surface, so the dechlorination effect was more significant. The selectivity of phenol and phenol methylate was higher than that of other calcination temperatures. In addition, the poly-methyl substituents of phenol (2,6-xylenol, 2,4-xylenol, 2,4,6-trimethylphenol) were also slightly higher than others, this conclusion was consistent with similar work.14 The insight was the stronger the acidity, the longer the average time the phenoxy anions were adsorbed at the acidic sites, then the easier it was for the resulting mono-substituted product to continue to react with the methyl species to generate di- or tri-substituted products.
The result of Mn2O3NW was slightly different from Mn2O3NP (Table S4†). This was attribute to Mn2O3NW was the same Mn2O3 crystal phase under investigation. The difference was that the specific surface area (the number of medium acid and weak base centers), despite the specific surface area of Mn2O3NW was larger than that of Mn2O3NP, the two samples behaved quite similarly. In a previous paper, researchers had made the hypothesis that active sites in MgO were corner and steps at crystallite surface.12 Based on this, it might be expected that the high-surface-area Mn2O3NW possessed both a greater overall number and a greater density of defect sites, because of its wire-like structure. Nevertheless, this was in contrast with the experimental evidence. One possible explanation was that the particle efficiency in the high-surface-area Mn2O3NW was low, which was due to the internal diffusion limitations. This implied that only active sites located at the external surface of the catalyst particles contributed to reactivity. If this were the case, regardless of the difference in specific surface area, the reactivity of Mn2O3 would not differ too much.
The reaction temperature played a crucial role in deciding the reactivity and the selectivity of products in either vapor phase or liquid phase reaction. In temperature studies, the reactions were carried out at temperature from 350 to 450 °C. It was observed as given in Table S5 and S6,† the increased of temperature led to higher conversion of 4-chlorophenol. That was attribute to the process from methanol to formaldehyde was more likely to occur with the increase of reaction temperature. However, at 450 °C, the conversion of 4-chlorophenol was slightly decreased (Table S5†). This was due to the coke generated during the reaction were deposited on the surface of the catalyst, which reduced the porosity of the catalyst.46 Simultaneously, the dechlorination effect of 4-chlorophenol also intensified with the increase of temperature. Maybe the increase of temperature enhanced the dissociation and adsorption of methanol on the catalyst surface, the hydride transfer reaction made 4-chlorophenol and 4-chlorophenol methyl compounds easier to dechlorine.
The influence of the molar ratio of chlorophenol to alcohol on this reaction is shown in Tables S7 and S8.† For the two morphologies catalysts, as the molar ratio increased from 1![[thin space (1/6-em)]](https://www.rsc.org/images/entities/char_2009.gif) :
:![[thin space (1/6-em)]](https://www.rsc.org/images/entities/char_2009.gif) 1 to 1
1 to 1![[thin space (1/6-em)]](https://www.rsc.org/images/entities/char_2009.gif) :
:![[thin space (1/6-em)]](https://www.rsc.org/images/entities/char_2009.gif) 20, the conversion of 4-chlorophenol generally increased, the selectivity of phenol poly-methylation species increased, and the dechlorination of chlorophenols has been inhibited. With the chlorophenol-to-alcohol molar ratio increased, the methanol densities increased, more formaldehyde intermediates produced, which increased the conversion of 4-chlorophenol. Meanwhile, the generated mono-substituted phenol or chlorophenol methyl compounds were more likely to react with formaldehyde to generate di- or multi-substituted methylated phenol or chlorophenol under an abundant formaldehyde condition. The dechlorination effect of chlorophenols was inferior, which was seems to contrary to the mechanism we proposed, because more methanol generated more hydrides to reduce the chlorophenols. Considering that the amount of methanol molecules was larger than the amount of dechlorination sites even in the ratio was 1
20, the conversion of 4-chlorophenol generally increased, the selectivity of phenol poly-methylation species increased, and the dechlorination of chlorophenols has been inhibited. With the chlorophenol-to-alcohol molar ratio increased, the methanol densities increased, more formaldehyde intermediates produced, which increased the conversion of 4-chlorophenol. Meanwhile, the generated mono-substituted phenol or chlorophenol methyl compounds were more likely to react with formaldehyde to generate di- or multi-substituted methylated phenol or chlorophenol under an abundant formaldehyde condition. The dechlorination effect of chlorophenols was inferior, which was seems to contrary to the mechanism we proposed, because more methanol generated more hydrides to reduce the chlorophenols. Considering that the amount of methanol molecules was larger than the amount of dechlorination sites even in the ratio was 1![[thin space (1/6-em)]](https://www.rsc.org/images/entities/char_2009.gif) :
:![[thin space (1/6-em)]](https://www.rsc.org/images/entities/char_2009.gif) 1, thus it was believed that increased methanol ratio could not be change dechlorination effect visibly. In other words, the dehydrogenation of methanol to formaldehyde and chlorophenol dechlorination was occurred on different sites, perhaps the number of the former is far greater than that of the latter.
1, thus it was believed that increased methanol ratio could not be change dechlorination effect visibly. In other words, the dehydrogenation of methanol to formaldehyde and chlorophenol dechlorination was occurred on different sites, perhaps the number of the former is far greater than that of the latter.
Tables S9 and S10† showed the reactivity and selectivity of the two Mn2O3 catalysts at different liquid hourly space velocity (LHSV). It can be observed that with the increase of volumetric space velocity, for Mn2O3NP catalyst, the conversion of 4-chlorophenol gradually decreased, the selectivity of phenol increased, the selectivity of 4-chloro-2-cresol slightly increased, as well the selectivity of o-cresol was basically unchanged, and the selectivity of poly-methyl substituted phenol decreased. The increase in LHSV indicated that the reactants flowing through the catalyst per unit time increased. When it reached to an extreme level, the catalyst did not have the ability to deal with so many reactants, which caused the conversion dropped. Accordingly, the LHSV increased, especially too much methanol, which generated more coke depositions, and blocked the active sites on the catalyst surface, so the conversion decline. The selectivity of 4-chloro-2-cresol was increased due to more 4-chlorophenol went through the surface of the catalyst per unit time. The chlorine removed by the dechlorination effect made the dechlorination site filled untimely. Therefore, when the sampling time was 3 h, the selectivity of 4-chloro-2-cresol would naturally increase. The variety in the selectivity of phenol and poly-methyl substituted phenol can be attributed to the increase in LHSV, the less contact time between phenol species and catalyst.46 Mn2O3NW showed a larger LHSV result than Mn2O3NP. That was because of the Mn2O3NW had a larger external surface area, which made it possible for more 4-chlorophenol dissociation adsorption.
Without the presence of any catalyst, N2 and H2/Ar mixture were used to the carrier gas for this reaction. It was found that the conversion of 4-chlorophenol was very low, and the conversion in both cases were almost no difference (Table S11†). Even in the H2/Ar mixed gas atmosphere, phenol was formed, but the conversion was too low, indicating that there was no further conversion of 4-chlorophenol. That implied that the H2 produced by methanol decomposition did not the reason why chlorophenol dechlorination. Repeating the above experiment with the presence of catalyst, it was clear that the selectivity of 4-chloro-2-cresol remained largely the same, and the conversion of 4-chlorophenol was significantly declined. This is because in the H2/Ar mixed gas condition, the lattice oxygen of the catalyst was easier to take away, and inhibited 4-chlorophenol dissociated and adsorbed on the surface of the catalyst. In addition, due to the removal of lattice oxygen, the cations on the catalyst surface were excessive and the acidity increased, and the adsorption effect of phenol oxygen anions on the catalyst surface became stronger, which aggravated the excessive methylation of phenol and 4-chlorophenol. Hence, the selectivity of phenol poly-methylation species was increased. Under the same conditions, when formalin solution was used as the methylating agent, the dechlorination of 4-chlorophenol was effectively inhibited, indicating that methanol was the cause of dechlorination of 4-chlorophenol and its analogues. In addition, thanks to formalin was directly used as the methylation reagent, the process of methanol to formaldehyde was skipped, so there were more methyl active species (formaldehyde) around the adsorbed phenol oxygen anions though traces of methanol. Therefore, the selectivity of phenol and o-cresol decreased, the poly-methyl substituted phenol increased.
4. Conclusions
Two kinds of morphologies Mn2O3 catalysts were prepared by precipitation and hydrothermal methods and calcined under different temperatures. Increasing calcination temperature increased the crystallinity of the catalysts. Mn2O3NP need higher calcination temperature to form a Mn2O3 phase than Mn2O3NW. As the reaction to, coke deposition on the catalyst and MnCl2 crystalline grain emerged, and the Mn3+ was reduce to Mn2+. The specific surface area of the Mn2O3NW catalyst was larger than that of the Mn2O3NP. And the specific surface area and pore volume of each catalyst decreased with the increase of the calcination temperature, which leaded to the decline of the number of acid–base centers on the catalyst surface. The catalytic activity and selectivity of the two catalysts had little difference, mainly because the methylation reaction of 4-chlorophenol with methanol occurred on the outer surface of the catalyst. Temperature affected the process of methanol dehydrogenation to formaldehyde. High reaction temperature caused excessive coke deposition on the surface of the catalyst due to methanol decomposition, which affected the subsequent catalytic reaction. Increasing the ratio of alcohol to 4-chlorophenol produced more formaldehyde. Overabundance methanol could not promote the dechlorination of 4-chlorophenol and its methyl compounds, therefore, it did not cause excessive reduction of 4-chlorophenol, but enhanced the degree of poly-methylation of 4-chlorophenol. The increase in the LHSV of the reactants reduced the conversion of 4-chlorophenol, and the selectivity of 4-chloro-2-cresol increased slightly. At the same time, the Mn2O3NW catalyst can maintain the reactivity at a higher LHSV. The conversion was corresponding to particle efficiency instead of simply specific surface area. The dechlorination effect of 4-chlorophenol and its analogues was due to the hydride produced by methanol on the surface of the catalyst substitute the chlorine on the phenol ring, rather than the hydrogen produced by methanol thermal decomposition.Conflicts of interest
The authors declare not competing financial interest.Acknowledgements
This work was supported by Jilin Province Science and Technology Research Plan (Key Scientific Research Project) (No: 20150204020GX).References
- J. Blanco, P. Avila and F. V. Melo, Bull. Chem. Soc. Jpn., 1983, 56, 909–913 CrossRef CAS.
- J. M. Gnaim and R. A. Sheldon, Tetrahedron Lett., 2004, 45, 9397–9399 CrossRef CAS.
- O. Shoji, T. Kunimatsu, N. Kawakami and Y. Watanabe, Angew. Chem., Int. Ed., 2013, 52, 6606–6610 CrossRef CAS PubMed.
- Y. Li, B. Li, L.-F. Geng, J. Wang, Y. Wang and J. Huang, Catal. Lett., 2015, 145, 1014–1021 CrossRef CAS.
- L. Menini and E. V. Gusevskaya, Appl. Catal., A, 2006, 309, 122–128 CrossRef CAS.
- L. Menini and E. V. Gusevskaya, Chem. Commun., 2006, 209–211 RSC.
- E. A. Bugnet, A. R. Brough, R. Greatrex and T. P. Kee, Tetrahedron, 2002, 58, 8059–8065 CrossRef CAS.
- P. Bovonsombat, R. Ali, C. Khan, J. Leykajarakul, K. Pla-on, S. Aphimanchindakul, N. Pungcharoenpong, N. Timsuea, A. Arunrat and N. Punpongjareorn, Tetrahedron, 2010, 66, 6928–6935 CrossRef CAS.
- Y.-W. Xiong, H.-D. Duan, X. Meng, Z.-Y. Ding and W.-C. Feng, J. Chem., 2016, 2016, 1–5 CrossRef.
- H. Huang, J.-Y. Liu, X.-X. Liu, J.-F. Xiao, S. Zhong, X.-C. She, Z.-H. Fu and D.-L. Yin, Fuel, 2016, 182, 373–381 CrossRef CAS.
- A. R. Gandhe, J. B. Fernandes, S. Varma and N. M. Gupta, J. Mol. Catal. A: Chem., 2005, 238, 63–71 CrossRef CAS.
- F. Cavani, L. Maselli, S. Passeri and J. A. Lercher, J. Catal., 2010, 269, 340–350 CrossRef CAS.
- S. Velu and C. S. Swamy, Appl. Catal., A, 1994, 119, 241–252 CrossRef CAS.
- C. F. Braganza and A. V. Salker, Chin. J. Catal., 2016, 37, 1991–1996 CrossRef CAS.
- Y.-L. Wang, Y.-Y. Song, W.-T. Huo, M.-J. Jia, X.-Y. Jing, P.-P. Yang, Z. Yang, G. Liu and W.-X. Zhang, Chem. Eng. J., 2012, 181, 630–635 CrossRef.
- N. Ballarini, F. Cavani, S. Passeri, L. Pesaresi, A. F. Lee and K. Wilson, Appl. Catal., A, 2009, 366, 184–192 CrossRef CAS.
- K. V. R. Chary, K. Ramesh, G. Vidyasagar and V. Venkat Rao, J. Mol. Catal. A: Chem., 2003, 198, 195–204 CrossRef CAS.
- V. Crocellà, G. Cerrato, G. Magnacca, C. Morterra, F. Cavani, L. Maselli and S. Passeri, Dalton Trans., 2010, 39, 8527–8537 RSC.
- A. S. Reddy, C. S. Gopinath and S. Chilukuri, J. Catal., 2006, 243, 278–291 CrossRef CAS.
- T. Tabanelli, S. Passeri, S. Guidetti, F. Cavani, C. Lucarelli, F. Cargnoni and M. Mella, J. Catal., 2019, 370, 447–460 CrossRef CAS.
- M. Yadav, K. Y. Rhee, S. J. Park and D. Hui, Composites, Part B, 2014, 66, 89–96 CrossRef CAS.
- E. S. Ilton, J. E. Post, P. J. Heaney, F. T. Ling and S. N. Kerisit, Appl. Surf. Sci., 2016, 366, 475–485 CrossRef CAS.
- N. A. Merino, B. P. Barbero, P. Eloy and L. E. Cadús, Appl. Surf. Sci., 2006, 253, 1489–1493 CrossRef CAS.
- A. F. Carley, M. W. Roberts and A. K. Santra, J. Phys. Chem. B, 1997, 101, 9978–9983 CrossRef CAS.
- K. Sutthiumporn and S. Kawi, Int. J. Hydrogen Energy, 2011, 36, 14435–14446 CrossRef CAS.
- J. L. G. Fierro, Catal. Today, 1990, 8, 153–174 CrossRef CAS.
- H. Raaf and N. Schwentner, Appl. Surf. Sci., 2001, 174, 13–34 CrossRef CAS.
- J. Newnham, K. Mantri, M. H. Amin, J. Tardio and S. K. Bhargava, Int. J. Hydrogen Energy, 2012, 37, 1454–1464 CrossRef CAS.
- N. Laosiripojana and S. Assabumrungrat, Appl. Catal., B, 2005, 60, 107–116 CrossRef CAS.
- G. R. Patzke, F. Krumeich and R. Nesper, Angew. Chem., Int. Ed., 2002, 41, 2446–2461 CrossRef CAS PubMed.
- L. Vayssieres, K. Keis, A. Hagfeldt and S. E. Lindquist, Chem. Mater., 2001, 13, 4395–4398 CrossRef CAS.
- D.-B. Kuang, A.-W. Xu, Y.-P. Fang, H.-Q. Liu, C. Frommen and D. Fenske, Adv. Mater., 2003, 15, 1747–1750 CrossRef CAS.
- V. N. Kalevaru, N. Madaan and A. Martin, Appl. Catal., A, 2011, 391, 52–62 CrossRef CAS.
- H. Zhao, C.-C. Zuo, D. Yang, C.-S. Li and S.-J. Zhang, Ind. Eng. Chem. Res., 2016, 55, 12693–12702 CrossRef CAS.
- G.-L. Zhang, H.-H. Zhang, D. Yang, C.-S. Li, Z.-J. Peng and S.-J. Zhang, Catal. Sci. Technol., 2016, 6, 6417–6430 RSC.
- Q.-Q. Li, Z. Huang, P.-F. Guan, R. Su, Q. Cao, Y.-M. Chao, W. Shen, J.-J. Guo, H.-L. Xu and R.-C. Che, ACS Appl. Mater. Interfaces, 2017, 9, 16243–16251 CrossRef CAS PubMed.
- Y.-X. Gao, W.-D. Wang, S.-J. Chang and W.-X. Huang, ChemCatChem, 2013, 5, 3610–3620 CrossRef CAS.
- D.-C. Wang, L.-J. Jin, Y. Li and H.-Q. Hu, Fuel, 2017, 210, 803–810 CrossRef CAS.
- K. Tanabe and W. F. Hölderich, Appl. Catal., A, 1999, 181, 399–434 CrossRef CAS.
- T. Mathew, B. B. Tope, N. R. Shiju, S. G. Hegde, B. S. Rao and C. S. Gopinath, Phys. Chem. Chem. Phys., 2002, 4, 4260–4267 RSC.
- C. Brookes, M. Bowker and P. P. Wells, Catalysts, 2016, 6, 92–118 CrossRef.
- J. S. Chung, R. Miranda and C. O. Bennett, J. Catal., 1988, 114, 398–410 CrossRef CAS.
- Y. Nakamura, T. Murayama and W. Ueda, ChemCatChem, 2014, 6, 741–744 CrossRef CAS.
- E. Nowicka, J. P. Hofmann, S. F. Parker, M. Sankar, G. M. Lari, S. A. Kondrat, D. W. Knight, D. Bethell, B. M. Weckhuysen and G. J. Hutchings, Phys. Chem. Chem. Phys., 2013, 15, 12147–12155 RSC.
- T. Pasini, A. Lolli, S. Albonetti, F. Cavani and M. Mella, J. Catal., 2014, 317, 206–219 CrossRef CAS.
- K. H. Bhadra and G. D. Yadav, Appl. Catal., A, 2018, 562, 67–78 CrossRef CAS.
Footnote |
| † Electronic supplementary information (ESI) available. See DOI: 10.1039/d1ra01062j |
| This journal is © The Royal Society of Chemistry 2021 |

