 Open Access Article
Absorption and desorption of hydrogen in Ti1.02Cr1.1Mn0.3Fe0.6RE0.03: experiments, characterization and analytical interpretation using statistical physics treatment
Fatma Aouaini *a,
Nadia Bouazizib,
Maha M. Almoneef*a,
Hanan Al-Ghamdia and
Abdelmottaleb Ben Lamineb
aDepartment of Physics, College of Science, Princess Nourah Bint Abdulrahman University, Riyadh, Saudi Arabia. E-mail: fasaidi@pnu.edu.sa; mmalmoneef@pnu.edu.sa; Tel: +966 508675781
bLaboratory of Quantum and Statistical Physics, LR18ES18, Monastir University, Faculty of Sciences of Monastir, Tunisia
First published on 29th April 2021
Abstract
In this work, the absorption and desorption isotherms of hydrogen on Ti1.02Cr1.1Mn0.3Fe0.6RE0.03 (RE = La, Ce, Ho) metals were collected at three temperatures under the same experimental conditions. This was carried out in order to determine the rare earth effect on the hydrogen storage performance of the Ti1.02Cr1.1Mn0.3Fe0.6 metal. The equilibrium data showing the hydrogen absorbed/released amounts per unit of absorbent mass have provided useful details to describe the absorption/desorption processes. Indeed, statistical physics formalism is appealing to ascribe advanced interpretations to the complexation mechanism. The physico-chemical parameters included in the model analytical expression are numerically determined from the experimental data fitting. We have found that the model can describe the complexation process through steric parameters such as the site densities (N1m and N2m), the numbers of atoms per site (n1 and n2) and energetic parameters (P1 and P2). The behavior of each parameter is examined in relation to the sorption mechanism. Overall, the energetic interpretation reveals that the desorption and absorption of H-gas in the Ti1.02Cr1.1Mn0.3Fe0.6RE0.03 alloys can be characterized by chemical interactions. In addition, the expression of the appropriate model is exploited to determine the thermodynamic potential functions that describe the absorption phenomenon.
1 Introduction
In search for solutions of alternative energies, hydrogen as a carrier of energy has become an important choice to resolve the issue of progressive exhausting fossil fuels and to safeguard the planet's environment, thanks to the renewability and purity of this gas.1–4 Hydrogen storage has presented a basic problem for energy storage exploitation.5 In general, hydrogen is stored as a cryogenic liquid, pressurized gas and chemically or physically related to the suitable solid-state matter.5–8 Among these storage systems, solid-state storage methods depending on metal hydrides, which present high prospects for the great ability of H-storage in an efficient, compact, often reversible and quite safe manner; and, consequently, is progressively acquiring importance in applications for hydrogen storage.9–12In particular, the Laves phases (AB2) have been widely investigated owing to their great hydrogen storage performance, life cycle and good hydrogen absorption/desorption kinetics.13,14 The A metal can be Zr, Ti or Mg, whereas the B metal can be V, Ni, Mn or Cr.15 Amongst them, AB2-type Ti–Cr-based metal as a type of hydrogen storage substance with elevated dehydrogenation pressure, great hydrogen storage capacity, exceptional anti-powdery characteristics and good kinetics is able to absorb or release hydrogen swiftly at room temperature and pressure.16–20 Nevertheless, its hydrogen storage execution highly differs through the impact of metal constitution.21 Consequently, a growing number of investigations have been concentrating on Ti–Cr-based solid solution metals in recent years. It is worth noting that the activation procedure is very necessary to use the hydrogen storage substances, as well as the mild activation condition, is favored. The Ti–Cr–Mn–Fe-based metal is difficult to be activated, which may be an obstruction for the practicable requests.
It is known that rare-earth alloys possess numerous activities. The addition of a few rare earth alloys in a TiFe metal that is hard to be activated leads to storing hydrogen readily.22 Yan et al.23 have discussed the impact of the rare earth Ce addition on the hydrogen storage characteristics and structure of V55Ti22.5Cr16.1Fe6.4. They discovered that, at room temperature, hydrogen can be absorbed rapidly in all Ce-containing metals. Wu et al.24 also have deduced that RE added to V55Ti22.5Cr16.1Fe6.4 metal can ameliorate the absorption capacity rather than the activation property, plateau pressure and kinetics. Furthermore, Liu et al.25 have reported that Ce additive ameliorates the flat appearance of the plateau.
Pressure–composition–temperature P–C–T curve is an efficient method to assess the efficiency of hydrogen storage alloys that are employed to analyze diverse qualities; among them, hydrogen plateau pressure of absorption/desorption process, hydrogen storage capacity, plateau slope, and hysteresis.26–29 Furthermore, the thermodynamic parameters are also determined according to P–C–T curves at various temperatures.30,31 However, with recurrent absorption/desorption of hydrogen, alterations in P–C–T isotherms takes place owing to the change in hydrogen storage characteristics, generally displayed through the reduction in reversible storage ability of hydrogen, rise in plateau slope and so on.32,33
Many researchers have studied hydrogen absorption/desorption isotherms by different models. The application of this method is significant to represent numerous microscopic characteristics.34,35 Some of them are established using certain working hypotheses utilizing the treatment of statistical physics to depict the absorption/desorption phenomenon,34,35 whereas others are purely empirical and have no microscopic or physical investigations.36 To understand the absorption and desorption mechanisms of hydrogen, experimental studies are carried out and a theoretical study is performed to describe both of these processes.
The principal goals of this article are to evolve the activation characteristics of the metal by introducing RE components (La, Ce and Ho) in Ti1.02Cr1.1Mn0.3Fe0.6 metal and also to select a physical model which can analyze the physico-chemical characteristics of hydrogen absorption/desorption isotherms utilizing the grand canonical ensemble of the statistical physics approach. This modeling task is devoted to supplying new investigations at the molecular level. The density of active sites and the number of H-atoms per site have been assessed. The explanation of the alloy's performances by determining the absorbed and desorbed hydrogen quantities is revealed. The identification and description of the interaction type between hydrogen and absorbents have been clarified. Besides, the chosen model was used to calculate the thermodynamic potential functions during the absorption process.
2 Experimental study
2.1 Experimental procedure
The nominal composition of the studied alloys is represented by the following general formula: Ti1.02Cr1.1Mn0.3Fe0.6RE0.03 (RE = La, Ce, Ho). The purity of all the raw materials utilized was at least 99%. The alloys were prepared in a water-cooled copper crucible under an argon atmosphere through induction levitation melting of the metallic components (overall weight of around 30 g). To achieve elevated homogeneity, the ingots were remelted three times.37The crystal structures and lattice parameters of these metals were studied through X-ray diffraction (XRD) utilizing a Rigaku D/max-3B diffractometer with Cu Kα radiation.37
The properties of hydrogen storage of the substances were studied using a homemade Sieverts-type apparatus utilizing hydrogen with a purity of 99.99%. Before the measurement, the samples were preserved for 30 min under vacuum at 373 K and then, for activation, submitted to successive adsorption and desorption cycles of hydrogen at ambient temperature. The adsorption/desorption P–C–T isotherms of hydrogen were collected at T = 243, 253 and 263 K, and measured after an activation.37
2.2 Experimental results
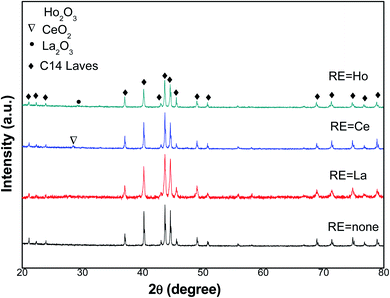
XRD patterns of the tested metals in the 2θ range of 20–80° are presented in Fig. 1. It is obvious that Ti1.02Cr1.1Mn0.3Fe0.6 metal presents one phase, which is the C14-type Laves structure, whereas the RE oxide phase is along with the C14-type Laves phase in metals containing RE. According to XRD analysis data, lattice parameters and cell volumes of all metals were determined and presented in Table 1.| Alloys | Lattice parameters (10−1 nm) | c/a | Unit cell volume, V (10−3 nm3) | |
|---|---|---|---|---|
| a | c | |||
| Ti1.02Cr1.1Mn0.3Fe0.6 | 4.8543 | 7.9676 | 1.6413 | 162.60 |
| Ti1.02Cr1.1Mn0.3Fe0.6La0.03 | 4.8623 | 7.9746 | 1.6400 | 163.28 |
| Ti1.02Cr1.1Mn0.3Fe0.6Ce0.03 | 4.8613 | 7.9726 | 1.6400 | 163.16 |
| Ti1.02Cr1.1Mn0.3Fe0.6Ho0.03 | 4.8601 | 7.9710 | 1.6401 | 163.05 |
We noticed that both lattice constants a and c of the C14 laves phase rise with the introduced RE additives. Consequently, the unit cell volume of Ti1.02Cr1.1Mn0.3Fe0.6RE0.03 alloys increases too. As an example, the addition of La leads to its insertion in the unit cell of the absorbent to increase the dimensions of a, c, and consequently to its volume V, from 4.8543 Å, 7.9676 Å and 162.60 Å3 for Ti1.02Cr1.1Mn0.3Fe0.6, and 4.8613 Å, 7.9726 Å and 163.16 Å3 for Ti1.02Cr1.1Mn0.3Fe0.6Ce0.03, respectively. The lattice parameters of Ho and La containing alloys showed a similar change behavior.
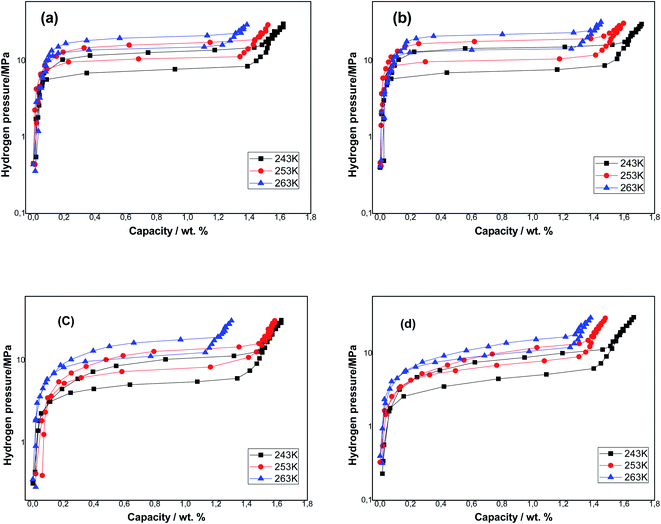
The P–C–T isotherms of the samples obtained at three temperatures T = 243, 253 and 263 K are presented in Fig. 2, and the relative parameters of the absorption/desorption investigation are listed in Table 2. We noticed that each P–C–T curve has a single apparent plateau region. The plateau pressure of each sample rises with the rise of temperature. This is due to the low stabilization of hydrides at higher temperatures. The equilibrium pressures that are specified as the midpoints of absorption/desorption isotherms plateaus are listed in Table 2. As an example, the equilibrium pressure of the Ti1.02Cr1.1Mn0.3Fe0.6 sample was 7.59 MPa and that of the Ti1.02Cr1.1Mn0.3Fe0.6La0.03 sample was 7.33 MPa at T = 243 K. After adding RE elements, the plateau pressure of the metals was reduced, which lead to a more stable hydride compared to Ti1.02Cr1.1Mn0.3Fe0.6 metal and the situation was identical for each tested temperature.
| RE | Cmax (wt%) | Pabseq (MPa) | Pdeseq (MPa) | Hyst | ||||||
|---|---|---|---|---|---|---|---|---|---|---|
| 243 K | 253 K | 263 K | 243 K | 253 K | 263 K | 243 K | 253 K | 263 K | ||
| None | 1.621 | 12.82 | 16.11 | 19.8 | 7.59 | 10.42 | 14.10 | 0.52 | 0.43 | 0.33 |
| La | 1.715 | 15.2 | 17.93 | 22.27 | 7.33 | 10.25 | 13.71 | 0.72 | 0.55 | 0.48 |
| Ce | 1.629 | 10.31 | 12.84 | 16.31 | 5.12 | 7.56 | 10.65 | 0.69 | 0.52 | 0.42 |
| He | 1.663 | 8.8 | 9.83 | 12.45 | 4.37 | 6.57 | 9.06 | 0.7 | 0.35 | 0.31 |
The sample's capacities reduce with the rise of temperature because of the exothermic proprieties of the hydrogen absorption reaction. The amount of hydrogen absorbed on all metals containing RE rise and the La additive-based metal attains the elevated quantity. After the addition of La, Ho and Ce respectively, hydrogen storage capacities rose from 1.621 wt% to 1.715 wt%, 1.663 wt% and 1.629 wt% at T = 243 K.
The hysteresis phenomenon was used to assess the pulverization resistance of the metals during the absorption/desorption phenomenon of hydrogen. In practical applications, a weak hysteresis is anticipated. The hysteresis of the samples is determined from the absorption/desorption pressure at the plateau midpoint depending on the equation Hys = ln(Pa/Pd). The results are presented in Table 2. It can be observed that Ti1.02Cr1.1Mn0.3Fe0.6La0.03 metal presents the highest hysteresis factor equal to 0.72 at T = 243 K, while Ti1.02Cr1.1Mn0.3Fe0.6Ho0.03 metal presents the smallest hysteresis factor of 0.31 at T = 263 K. The increase in temperature leads to the decrease of hysteresis of all alloys. It is well known that the increase in temperature has favorable effects on cycling stability and anti-pulverization ability.
3 Theoretical study: statistical physics analysis
3.1 Similarity between absorption and adsorption modeling
Absorption is the process, which occurs, when one substance penetrates the bulk or the volume of another substance, whereas adsorption occurs when one substance takes place on the surface of another substrate. Many studies have revealed that some statistical physics formalism can be similarly used for both adsorption and absorption38 on account both mechanisms are related to the same category of diffusional equilibrium phenomenon.37,39 Applying a mathematical study, Wjihi et al.35,40 have revealed that the analytical adsorption model expressions were utilized to describe the absorption process too. As a result, the same models can be used to fit absorption isotherms in a manner similar to that performed for adsorption.3.2 Statistical physics analysis
The application of statistical physics is a paramount procedure to study the absorption process since we can typify the considered system by determining the various physicochemical parameters implicated in the physical technique of absorption. The advantage of a statistical physics model is that it contains its analytical expression, significant parameters from a physical point of view, contrary to empirical models such as Langmuir and Freundlich,41,42 in which the parameters do not have a direct physical meaning that we can derive from the measured isotherms after a numerical simulation.The dissociation of the H2 molecules at the contact of the substance results in atomically absorbed hydrogen. Thereafter, H gas is absorbed in the metal M and formed a metal hydride (MH) bulk where hydrogen atoms fill interstitial sites of the receptor substance. The overall reaction, arising during the sorption of hydrogen is, generally, represented through:34,35
 | (1) |
In this work, as a first approach, the modeling is based on the following hypotheses: first, hydrogen is defined as a perfect gas because H2 molecular interactions will be neglected.43–45 Second, freedom internal degrees of hydrogen are neglected, excluding the translational degree and rotational degree which can be activated at room temperature. Finally, the utilization of the grand canonical partition function is required to investigate the absorption/desorption process.43,46 This function for one interstitial site is formulated in the following general form:46,47
 | (2) |
Considering that the sites are independent and identical. In this situation, the total grand canonical partition function of NM identical sites has the form: Zgc = (zgc)NM. Thereby, the expression of the average filled site number is determined using following equation43,48
 | (3) |
For the monolayer model with two energies, sorption is accomplished through two types of sites: some atoms are inserted in the first kind of site, whose energy is (ε1) and defined by the density N1m. We also assume that some atoms, which are inserted in the sites of type 2, whose energy is (ε2), and are characterized by the density N2m.
The total grand canonical partition function is determined by:
| Zgc = (z1gc)N1m(z2gc)N2m | (4) |
The partial grand partition functions z1gc and z2gc have the following expressions:35
 | (5) |
 | (6) |
The formula associated with the diverse chemical potentials is defined by μm = μ/n when the thermodynamic equilibrium is attained in eqn (1). μ is the host site chemical potential, μm is the H2 molecule chemical potential and n is the number of atoms per site.
Based on the perfect gas estimation, the gaseous condition chemical potential is given as follows:49
 | (7) |
 | (8) |
The filled sites average number can be expressed as:46
 | (9) |
Based on the equilibrium state corresponding to the chemical potentials expressed by eqn (7), the filled sites average number represented by formula (9) turns to:46
 | (10) |
Assuming that kBTzge−βεm, we take a number of half-average filled sites N01 = N1m/2 and N02 = N2m/2 corresponding to the pressure at half-saturation defining the two types of sites, which is expressed as:50,51
P1 = kBTZge−β![[thin space (1/6-em)]](https://www.rsc.org/images/entities/char_2009.gif) ε1m and P2 = kBTZge−β ε1m and P2 = kBTZge−β![[thin space (1/6-em)]](https://www.rsc.org/images/entities/char_2009.gif) ε2m ε2m
| (11) |
Thus, the filled sites average number has the relation as follow:
 | (12) |
Eqn (1) and the filled sites average number N0 is used to find the average number of absorbed and released atoms:52
| [H/M] = n1N01 + n2N02 | (13) |
Finally, the relation corresponding to the hydrogen absorbed or released quantity is given by:47
 | (14) |
For this model, the global eqn (1) could be divided into two simultaneous eqn (15) and (16):
 | (15) |
 | (16) |
We can then write the desorption equations as:
 | (17) |
 | (18) |
Since  and
and  are not necessarily identical to n1 and n2.
In the next part, we worked to specify the suitable model, which presents the best accordance with the measured data.
4 Modeling of experimental data using theoretical models
To select a suitable statistical physics model that presents the perfect adjustment with the measured absorption/desorption data, numerical software was used to fit the measured curves by four models (monolayer model with one, two and three energies and double-layer with two energies). This accurate adjusting technique depends on the Levenberg Marquardt iterating algorithm, which used a multivariable nonlinear regression program.The two criteria employed, as indicators of the accuracy of the adjustment, are the multiple correlation coefficients squared R2 and the residual root mean square error RMSE.53,54 When the chosen model offers a great correlation with the absorption/desorption isotherms, the R2 values must be close to 1 and the RMSE values must be near zero.
For all the treated samples, RMSE and R2 values utilizing a numerical simulation with the four statistical models are illustrated in Tables 3 and 4.
| Ti1.02Cr1.1Mn0.3Fe0.6 | Ti1.02Cr1.1Mn0.3Fe0.6La0.06 | Ti1.02Cr1.1Mn0.3Fe0.6Ce0.03 | Ti1.02Cr1.1Mn0.3Fe0.6Ho0.03 | |||||||||
|---|---|---|---|---|---|---|---|---|---|---|---|---|
| T (K) | 243 K | 253 K | 263 K | 243 K | 253 K | 263 K | 243 K | 253 K | 263 K | 243 K | 253 K | 263 K |
| R2 | ||||||||||||
| Model 1 | 0.9953 | 0.9889 | 0.9821 | 0.9911 | 0.9928 | 0.9716 | 0.9809 | 0.9747 | 0.9712 | 0.9908 | 0.9892 | 0.9893 |
| Model 2 | 0.9993 | 0.9994 | 0.9983 | 0.9996 | 0.9998 | 0.9996 | 0.9986 | 0.9986 | 0.9972 | 0.9977 | 0.9986 | 0.9961 |
| Model 3 | 0.9950 | 0.9875 | 0.9971 | 0.9913 | 0.9961 | 0.9991 | 0.9894 | 0.9782 | 0.9660 | 0.9904 | 0.9841 | 0.9798 |
| Model 4 | 0.9920 | 0.8157 | 0.9930 | 0.8209 | 0.8185 | 0.8186 | 0.9283 | 0.9213 | 0.9331 | 0.9465 | 0.9668 | 0.9634 |
![[thin space (1/6-em)]](https://www.rsc.org/images/entities/char_2009.gif) |
||||||||||||
| RMSE | ||||||||||||
| Model 1 | 0.0343 | 0.0587 | 0.0908 | 0.0786 | 0.0544 | 0.1531 | 0.1305 | 0.1697 | 0.1151 | 0.0568 | 0.0496 | 0.0452 |
| Model 2 | 0.0039 | 0.0021 | 0.0066 | 0.0022 | 0.0007 | 0.0015 | 0.0075 | 0.0076 | 0.0085 | 0.0109 | 0.0053 | 0.0062 |
| Model 3 | 0.0218 | 0.0330 | 0.0087 | 0.0460 | 0.0177 | 0.0035 | 0.0454 | 0.3092 | 0.0777 | 0.0353 | 0.0418 | 0.0514 |
| Model 4 | 0.0340 | 0.0912 | 0.0083 | 1.489 | 1.293 | 0.9213 | 0.4605 | 0.4959 | 0.2844 | 0.3081 | 0.1428 | 0.1449 |
| Ti1.02Cr1.1Mn0.3Fe0.6 | Ti1.02Cr1.1Mn0.3Fe0.6La0.03 | Ti1.02Cr1.1Mn0.3Fe0.6Ce0.03 | Ti1.02Cr1.1Mn0.3Fe0.6Ho0.03 | |||||||||
|---|---|---|---|---|---|---|---|---|---|---|---|---|
| T (K) | 243 K | 253 K | 263 K | 243 K | 253 K | 263 K | 243 K | 253 K | 263 K | 243 K | 253 K | 263 K |
| R2 | ||||||||||||
| Model 1 | 0.9947 | 0.9918 | 0.9870 | 0.9942 | 0.9963 | 0.9878 | 0.9898 | 0.9891 | 0.9899 | 0.9952 | 0.9945 | 0.9934 |
| Model 2 | 0.9991 | 0.9988 | 0.9995 | 0.9997 | 0.9999 | 0.9992 | 0.9970 | 0.9965 | 0.9984 | 0.9982 | 0.9984 | 0.9983 |
| Model 3 | 0.9918 | 0.9878 | 0.9783 | 0.9904 | 0.9925 | 0.9842 | 0.9957 | 0.9903 | 0.9844 | 0.9928 | 0.9968 | 0.9755 |
| Model 4 | 0.8529 | 0.7971 | 0.8123 | 0.9943 | 0.8130 | 0.7917 | 0.9926 | 0.9194 | 0.9028 | 0.9472 | 0.9246 | 0.9233 |
![[thin space (1/6-em)]](https://www.rsc.org/images/entities/char_2009.gif) |
||||||||||||
| RMSE | ||||||||||||
| Model 1 | 0.0445 | 0.0535 | 0.0706 | 0.0464 | 0.0397 | 0.0829 | 0.0752 | 0.0719 | 0.0544 | 0.0306 | 0.0351 | 0.0369 |
| Model 2 | 0.0078 | 0.0058 | 0.0017 | 0.0014 | 0.0004 | 0.0041 | 0.0181 | 0.0078 | 0.0078 | 0.0099 | 0.0081 | 0.0076 |
| Model 3 | 0.0445 | 0.0451 | 0.0706 | 0.0465 | 0.0397 | 0.0670 | 0.0210 | 0.0381 | 0.0544 | 0.0275 | 0.0111 | 0.0892 |
| Model 4 | 0.1167 | 0.1329 | 0.1137 | 0.0430 | 1.489 | 1.331 | 0.0518 | 0.4981 | 0.954 | 0.3143 | 0.4013 | 0.4059 |
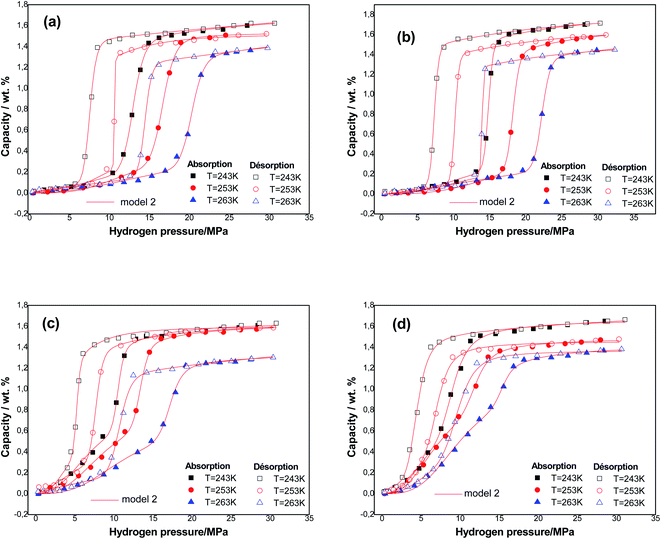
It is clear that the monolayer model with two energies is the most appropriate model to use in order to analyze the hydrogen isotherms of the tested samples for both phenomena at three temperatures. This model presented the greatest values of R2 (R2 > 0.9965) and the lowest values of RMSE (RMSE< 0.009) compared to the other models. In addition, the model parameters can be consistently evaluated. Therefore, it is possible to discuss and interpret the physicochemical interactions with hydrogen–alloy at a molecular level.
In the case of our samples, which belong to the C14 structure, many reports have revealed three types of tetrahedral sites such as [A2B2], [B4] and [AB3] sites for hydrogen absorption.55,56 Many researchers using the density functional theory (DFT) showed that the most beneficial of these sites are the [A2B2] sites pursued by [AB3] sites and the narrowest [B4] sites stay vacant.57,58 Therefore, we deduce that in the C14-type Laves phase hydrogen mostly occupies two kinds of receptor sites: [AB3] and [A2B2].59 Thus, the apparition of two phases (α and β) during the absorption/desorption phenomenon of hydrogen proves that the two levels of energies are revealed in the chosen model.
Fig. 3 presents the experimental curves of alloys simulated utilizing the best fitting model at three temperatures.
The absorption and desorption processes are well described. It is valuable to enrich this point with an energetic and steric interpretation of both of these processes.
5 Results and discussions
The exploitation of the numerical simulations was performed by proposing the next investigations of the parameters, deduced, through an adjustment process using the ideal-fitting model. The fitting parameters are classified as follows: the first category contains the steric parameters as n1 and n2 numbers of H-atoms per site, N1m and N2m densities of interstitial sites and [H/M]1sat and [H/M]2sat the absorbed/desorbed quantities at saturation. The second category contains the energetic parameters as the half-saturation pressures P1 and P2 that reveal the hydrogen absorption/desorption energies in the tested metals. The analysis of these parameters is done by interpreting their behaviors as a function of temperature. Tables 5 and 6 show the values of the adjusted parameters for the absorption/desorption process, respectively.| System | T (K) | n1 | n2 | N1m | N2m | P1 | P2 | [H/M]1sat | [H/M]2sat | [H/M]sat |
|---|---|---|---|---|---|---|---|---|---|---|
| Ti1.02Cr1.1Mn0.3Fe0.6 | 243 K | 1.56 | 18.88 | 0.274 | 0.065 | 12.97 | 15.21 | 0.42 | 1.227 | 1.65 |
| 253 K | 2.54 | 22.86 | 0.152 | 0.053 | 13.46 | 16.7 | 0.385 | 1.211 | 1.597 | |
| 263 K | 1.84 | 27.15 | 0.2 | 0.038 | 18.68 | 20.31 | 0.368 | 1.03 | 1.39 | |
| Ti1.02Cr1.1Mn0.3Fe0.6La0.06 | 243 K | 1.335 | 28.38 | 0.3 | 0.048 | 14.81 | 21.24 | 0.4 | 1.36 | 1.76 |
| 253 K | 2.34 | 30.4 | 0.162 | 0.041 | 17.26 | 19.6 | 0.38 | 1.24 | 1.62 | |
| 263 K | 1.64 | 31.52 | 0.21 | 0.0355 | 18.35 | 22.27 | 0.34 | 1.11 | 1.45 | |
| Ti1.02Cr1.1Mn0.3Fe0.6Ce0.06 | 243 K | 1.49 | 27.73 | 0.344 | 0.042 | 7.41 | 10.53 | 0.51 | 1.16 | 1.67 |
| 253 K | 1.77 | 28.86 | 0.28 | 0.037 | 9.06 | 13.4 | 0.49 | 0.95 | 1.44 | |
| 263 K | 2.01 | 22.3 | 0.219 | 0.029 | 11.38 | 17.19 | 0.44 | 0.64 | 1.28 | |
| Ti1.02Cr1.1Mn0.3Fe0.6Ho0.06 | 243 K | 1.28 | 9.65 | 0.35 | 0.128 | 6.48 | 8.92 | 0.448 | 1.23 | 1.68 |
| 253 K | 1.42 | 13 | 0.31 | 0.08 | 7.16 | 11.83 | 0.44 | 1.04 | 1.48 | |
| 263 K | 1.92 | 13.19 | 0.196 | 0.04 | 10.24 | 15.36 | 0.37 | 0.92 | 1.32 |
| System | T (K) | n1 | n2 | N1m | N2m | P1 | P2 | [H/M]1sat | [H/M]2sat | [H/M]sat |
|---|---|---|---|---|---|---|---|---|---|---|
| Ti1.02Cr1.1Mn0.3Fe0.6 | 243 K | 1.45 | 17.32 | 0.26 | 0.026 | 7.54 | 13.82 | 0.377 | 1.07 | 1.45 |
| 253 K | 1.31 | 20.19 | 0.23 | 0.05 | 10.64 | 16.1 | 0.3 | 1 | 1.3 | |
| 263 K | 1.16 | 24.8 | 0.21 | 0.04 | 14.46 | 17.28 | 0.24 | 0.98 | 1.22 | |
| Ti1.02Cr1.1Mn0.3Fe0.6La0.06 | 243 K | 1.24 | 24.33 | 0.257 | 0.05 | 7.31 | 16.28 | 0.318 | 1.21 | 1.52 |
| 253 K | 2.07 | 27.84 | 0.15 | 0.039 | 10.19 | 16.6 | 0.31 | 1.08 | 1.39 | |
| 263 K | 1.46 | 28 | 0.19 | 0.037 | 13.94 | 16.8 | 0.27 | 1.03 | 1.3 | |
| Ti1.02Cr1.1Mn0.3Fe0.6Ce0.06 | 243 K | 1.22 | 21.8 | 0.25 | 0.051 | 4.96 | 5.79 | 0.3 | 1.11 | 1.41 |
| 253 K | 1.12 | 17.93 | 0.21 | 0.057 | 5.7 | 7.36 | 0.23 | 1.02 | 1.25 | |
| 263 K | 1.08 | 15.82 | 0.2 | 0.06 | 9.8 | 11 | 0.21 | 0.94 | 1.15 | |
| Ti1.02Cr1.1Mn0.3Fe0.6Ho0.06 | 243 K | 084 | 6.44 | 0.53 | 0.17 | 4.46 | 5.28 | 0.44 | 0.9 | 1.34 |
| 253 K | 1.35 | 9.3 | 0.22 | 0.09 | 5.41 | 7.01 | 0.29 | 0.837 | 1.12 | |
| 263 K | 1.62 | 10.21 | 0.16 | 0.081 | 6.77 | 9.65 | 0.25 | 0.82 | 1.07 |
5.1 Stereographic parameters
ni and (i = 1, 2) are stoichiometric coefficients that represent the number of absorbed or released atoms per site, respectively. This parameter can also be considered as a steric coefficient, which can describe how H-atoms are inserted or dis-inserted in the host sites.
According to Tables 5 and 6, it can be seen that the number of absorbed/desorbed atoms per site, n1 and n2 is superior to 1 for all different temperatures and for all the studied alloys except for Ti1.02Cr1.1Mn0.3Fe0.6Ho0.03 alloy where  at T = 243 K. This means that the hydrogen absorption expects in this case, is occurring in a multi-atom manner where more than one atom is inserted per site. As an example, for hydrogen absorption on Ti1.02Cr1.1Mn0.3Fe0.6La0.03 at T = 243 K, n1 = 1.56. First of all, we can notice that all the ni adjusted values are not integers although they should be integers since the H-atom is indivisible. So, we can attribute the calculated non-integer values to an average value of a multitude of integer values. So, it is simple to describe this value (n1 = 1.56) at minimum two integers. Since 1 < n < 2, this expresses that the H-atoms are absorbed either by one or by two atoms per site with proportions x and (1 − x), respectively. Then, we can write the following equation: x × 1 + (1 − x) × 2 = 1.56. This reveals that 44% of sites are inserted by one H-atom and 56% are inserted by two H-atoms. The variation of n1 and n2 in all the studied alloys in the absorption or desorption process versus temperature is given in Fig. 4. It was observed that for all the tested metals, n1 was slightly constant with temperature. As we will see later, absorbed/desorbed energies for the first type of site α, which are greater compared to the second type β, explain this constant behavior. n1 varies between 1.49 and 2.01 for Ti1.02Cr1.1Mn0.3Fe0.6Ce0.03 sample as an example. The values of n1 for all metals are lower than those for n2, which is attributed to the narrow volume of α sites and their relatively high energies.
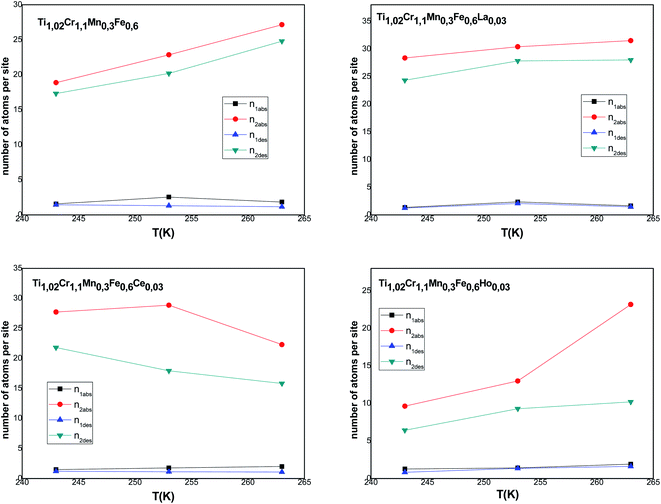 | ||
| Fig. 4 Evolution of the number of atoms per site in absorption and desorption according to the temperature. | ||
On the other hand, the values of n2 are between 13 and 31 in the absorption process that means that the dynamics of H2 molecules exchange and the capacity of hydrogen uptake of the β sites are higher than that of α sites. Therefore, we conclude that the size of the second insertion sites is superior to the first type of site.
For Ti1.02Cr1.1Mn0.3Fe0.6RE0.03 (RE = La, Ho) metals, n2 rises with the increase of temperature. This behavior is a property of an endothermic aggregation of H-atoms catalyzed by the presence of metallic interstices. However, for the other alloy Ti1.02Cr1.1Mn0.3Fe0.6Ce0.03, n2 first increases due to the endothermicity of the aggregation process. Then, it decreases at T = 263 K due to the thermal agitation, which governs and leads to the destruction of the aggregate.
Comparing the values of this parameter during absorption and desorption processes, we can observe that  and
and  are respectively inferior to n1 and n2 for hysteresis causes and matter conservation since hydrogen atoms are deliberated with difficulty. Thus, the same α or β site will be emptied with lower numbers of hydrogen atoms
  and
and  . In desorption with a lower dis-anchorage during α and β phases, the quantities of H-atoms
  and
and  are preserved by the site, which reveals the existence of the hysteresis process in the isotherm desorption curves of hydrogen in all substances.
The host site densities N1m and N2m are also steric parameters correlated with the effectively inserted interstitial sites at saturation. Returning to the evolution of these parameters during the absorption/desorption process presented in Fig. 5, a decrease of these parameters is noticed in most cases with the temperature though slightly for N1m. They generally change in the opposite way of n1 and n2. This opposite change of densities faces to n1 and n2 indicates an antagonistic effect, which is inflicted through the invariance of space volume. As for the decrease in Nim, it can be attributed to the classical thermal agitation. It can also be due to the existence of structural defects, which can intensely influence the hydrogen absorption process. Thus, the absorption of impurities in the volume can arise from both blocking of some receptor sites.
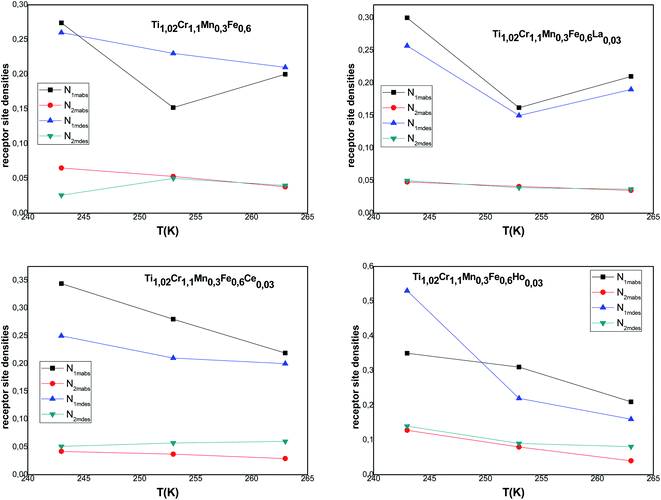 | ||
| Fig. 5 Evolution of the interstitial site densities in absorption and desorption according to the temperature. | ||
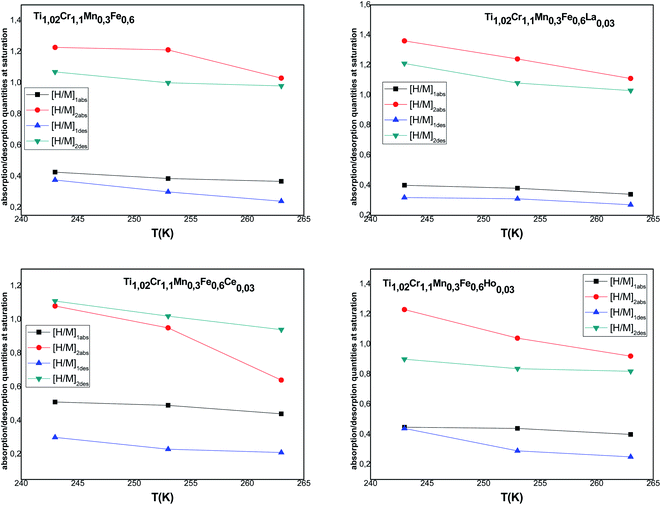
[H/M]1sat = n1N1m and [H/M]2sat = n2N2m are the capacity during both processes for α and β phases, respectively. The overall [H/M]sat presents the sum of the two inputs of the two kinds of receptor sites: [H/M]sat = [H/M]1sat + [H/M]2sat. The evolution of [H/M]1sat and [H/M]2sat against temperature for both processes is depicted in Fig. 6.
According to the variation of this parameter, it is clear that the increment of temperature causes the decrease of [H/M]1sat and [H/M]2sat, thus the decrease of [H/M]sat affirms the exothermic character of absorption.
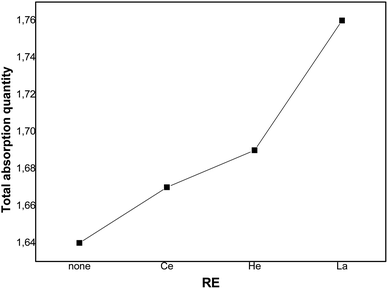
Fig. 7 depicts the evolution of the overall saturation absorption quantities of all the studied materials at T = 243 K. Obviously, the hydrogen storage capacity of each sample containing RE increases and the La additive-based metal reaches the most elevated capacity. Returning to the values of [H/M]sat determined by the numerical simulation summarized in Table 4, we have noticed that adding Ce, Ho and La leads to the increase of hydrogen absorption amount from 1.65 wt% to 1.67 wt%, 1.68 wt% and 1.76 wt%, respectively, at T = 243 K. Whereas, the experimental values of [H/M]sat presented in Table 2 vary from 1.621 wt% to 1.629 wt%, 1.663 wt% and 1.715 wt% for Ce, Ho and La, respectively. The prospective cause for these ameliorated characteristics is the interfacial effect due to RE addition. As RE additives disseminated excellently at the elevated density interface, which supplied the canal for the distribution of H-atoms and ameliorated the performance of hydrogen absorption.37,60 The rise of the unit cell volume is also another reason providing more locations for hydrogen to reside in.
5.2 Energetic parameters: absorption/desorption energies
Based on the energetic parameters P1 and P2 evaluated by fitting the measured isotherms with the chosen model, we calculate the absorption/desorption energies given by the following relations:61
 | (19) |
 | (20) |
Table 7 summarizes the absorption/desorption energy values determined at three temperatures for all studied alloys.
| System | T (K) | Absorption | Desorption | ||
|---|---|---|---|---|---|
| ΔE1 (kJ mol−1) | ΔE1 (kJ mol−1) | ΔE1 (kJ mol−1) | ΔE1 (kJ mol−1) | ||
| Ti1.02Cr1.1Mn0.3Fe0.6 | 243 K | 71.286 | 70.964 | 72.382 | 71.158 |
| 253 K | 77.595 | 77.142 | 78.090 | 77.219 | |
| 263 K | 83.897 | 83.714 | 84.457 | 84.067 | |
| Ti1.02Cr1.1Mn0.3Fe0.6La0.06 | 243 K | 71.018 | 70.289 | 72.444 | 71.158 |
| 253 K | 77.072 | 76.805 | 78.181 | 77.154 | |
| 263 K | 83.936 | 83.513 | 84.537 | 84.129 | |
| Ti1.02Cr1.1Mn0.3Fe0.6Ce0.06 | 243 K | 72.417 | 71.707 | 73.228 | 73.117 |
| 253 K | 78.428 | 77.605 | 79.403 | 78.865 | |
| 263 K | 84.981 | 84.079 | 85.308 | 85.055 | |
| Ti1.02Cr1.1Mn0.3Fe0.6Ho0.06 | 243 K | 72.688 | 72.042 | 73.443 | 72.596 |
| 253 K | 78.923 | 77.867 | 79.513 | 78.968 | |
| 263 K | 85.212 | 84.325 | 86.968 | 85.341 | |
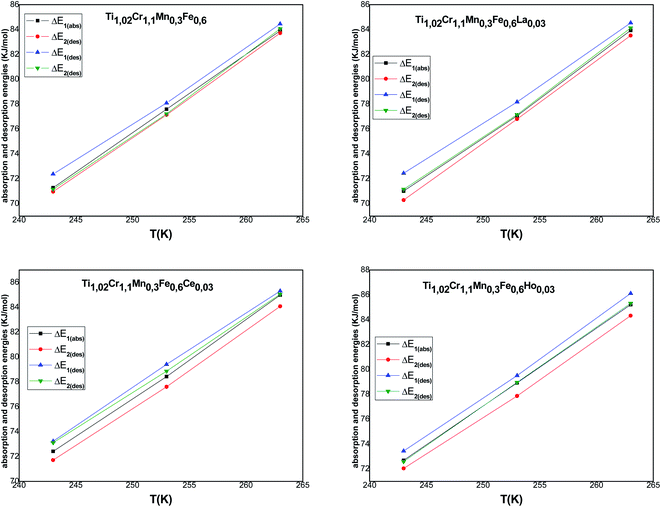
Fig. 8 represents the temperature dependence of absorption/desorption energies.
Compared to the RE-free sample, the plateau pressures in the RE-containing samples become smaller because of the rise of unit cell volume. The bigger the unit cell volume is, the bigger the interstitial size is, and the lower the platform pressure will be. This result is consistent in accordance between unit cell volume and plateau pressure as previously revealed by Lundin et al.62 Hang et al.63 and Chen et al.64 have also divulged the same results. It is generally accepted that small cell volume results in the decrement of the stability of the metal hydride and has been proven accordingly. Moreover, we have noticed the appearance of a significant fact that the smallest plateau pressure of RE components is related to the biggest atomic number. For example, at T = 243 K, Ho (atomic number, 67) provides hydrogen desorption pressure during α and β phases of  and
and  while Ce (atomic number, 58) provides
  and
and  . Both of them are smaller compared to the release plateau pressure of the RE-free sample at T = 243 K, 253 K and 263 K. On the one hand, the absorption/desorption pressures P1 and P2 of the four samples increase with the rise of temperature due to the low stabilization of hydrides at elevated temperatures. On the other hand, the hysteresis phenomenon observed in the studied isotherms permits H-atoms to be inserted at a specific pressure plateau but dis-inserted at a lower pressure plateau with absorption.65 This is certainly due to a relaxation process that minimizes the energy of the site and increases chemical binding.
Concerning the calculated energies related to the equilibrium pressures (Table 7), we can note that the absorption energies ranged from 70 kJ mol−1 to 85 kJ mol−1 and the desorption energies ranged from 72 kJ mol−1 to 86 kJ mol−1. These values indicated that the interaction between hydrogen and metal occurred by chemical absorption (chemisorption). The absorption/desorption energies at each site for the tested alloys are very close to each other. Besides, we can observe that the absorption energy of the first site α is superior to the second: |ΔE2| < |ΔE1|. This behavior can be attributed to the dislocation density occurring at the end of the α phase, which is sufficient to assist both the creation, additionally, during the phase β, the appearance of the migration of incoherent surface. This requires just a few of the dislocation rearrangement, which has appeared and that requires less energy during the β phase.65,66 It is obvious that the modulus of the released energy is greater than the absorbed energy for all the tested alloys. This is due to the excess energy required to accommodate the restrictions correlated to the expansion volume during the hydride distortion after the hysteresis effect.67
6 Thermodynamic interpretation
Thermodynamic potential functions are studied by utilizing the analytical expression related to the appropriate model or more clearly on its partition function. These functions are macroscopic characteristics of the sorption phenomenon. Entropy, internal energy and Gibbs free enthalpy are instances of the macroscopic description of the process.6.1 Entropy
The entropy is associated with the grand potential through the following expressions:68,69
J = −kBT![[thin space (1/6-em)]](https://www.rsc.org/images/entities/char_2009.gif) ln ln![[thin space (1/6-em)]](https://www.rsc.org/images/entities/char_2009.gif) Zgc Zgc
| (21) |
 | (22) |
Then, the entropy can be obtained by:
 | (23) |
Depending on the chosen model and utilizing the grand canonical partition function, the statistical entropy Sa is obtained as follow:
 | (24) |
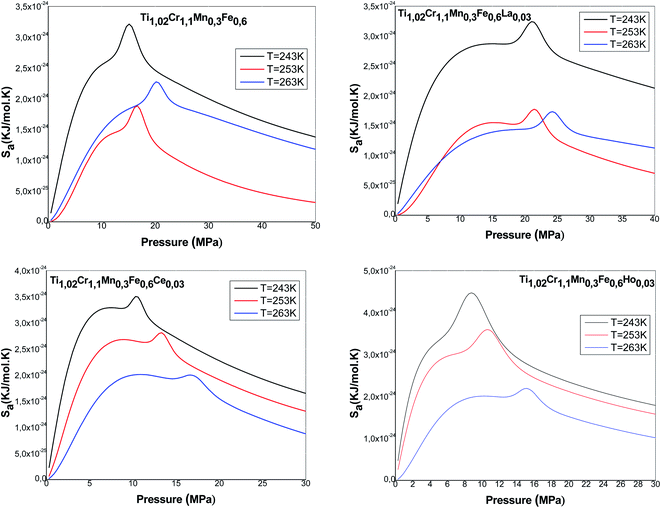
Fig. 9 presents the entropy evolution versus pressure at various temperatures for all the studied alloys. We note that the entropy presents an almost identical form for all the alloys. It is clearly shown that the entropy is composed mainly of two maxima, revolved around values related to the halves-saturation pressures of α and β sites. Regarding both maxima, the entropy presents two behaviors below and above P1 and P2. Actually, the entropy Sa1 defining the phase α increases at low pressure and achieves a maximum in the proximity of P1. This can be attributed to the various possibilities of the atoms to pick a free site amongst N1m host sites. These several potentials rise with pressure until a maximum at P1. After P1, the entropy gradually decreases due to the reduction in the number of α-free sites and the accessible state's number becomes relatively limited. Then, the entropy Sa2 corresponding to the phase β starts to rise and to attain, at P = P2, the second maximum. At elevated pressure, atoms have a low possibility to pick a free host site since the alloy tends toward the saturated state and consequently tends toward the order. When the saturated state is completely accomplished, the entropy attains a zero value.
Moreover, we observe that at an appointed pressure, the greater the temperature is, the lower the disorder is. We can also notice that the interstitial site densities decrease with temperature (Fig. 5), thereby there is a decrease in entropy.
6.2 Internal energy
The internal energy is written as follow:68
 | (25) |
Thus, we obtain the expression of the internal energy:
 | (26) |
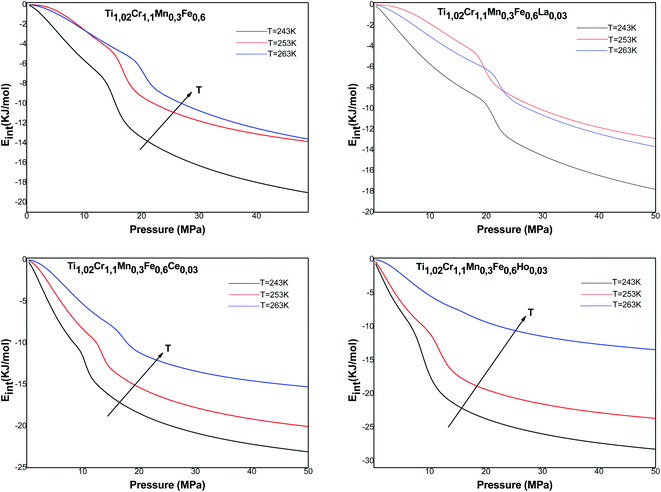
The variation of the internal energy versus pressure is depicted in Fig. 10. Based on this figure, we observed that the values of Eint are negative for the treated alloys at various temperatures. Therefore, during absorption, the alloys release energy, from which the exothermic character of the phenomenon arises.
The increase in temperature, at a fixed pressure, leads to an increase of Eint algebraically although there is a decrease in absolute values due to thermal agitation. At high pressure, ΔEint tenders to be zero and therefore Eint tenders to limit values, which disclose the saturation state.
6.3 Gibbs free energy
The Gibbs free energy is given by following equation68| Ga = μnN0 = μQ0 | (27) |
Thus, the obtained expression of Ga is:
 | (28) |
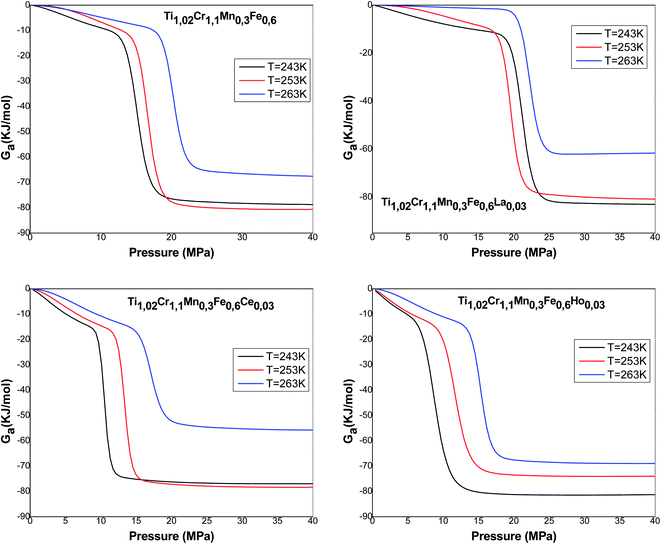
Fig. 11 presents the Gibbs free energy evolution versus pressure. The negative values of Ga indicate that the absorption phenomenon is thermodynamically spontaneous in nature. The Gibbs free energy values increase with the rise of temperature, which shows a lowering of absorption possibility at elevated temperature. The temperature prevents the absorption mechanism to be accomplished.
7 Conclusion
The hydrogen absorption/desorption equilibrium for Ti1.02Cr1.1Mn0.3Fe0.6RE0.03 (RE = La, Ce, Ho) metals has been experimentally and theoretically analyzed to reveal the RE adding effect on hydrogen storage and to analyze the absorption/desorption processes. The crystallographic properties and hydrogen storage characteristics of the tested metals were interpreted. The investigation has revealed that all the metals present a gray phase structure defining the C14-type Laves phase and a certain particle phase that is specified like RE oxides. The RE additives in Ti1.02Cr1.1Mn0.3Fe0.6RE0.03 metals extend the unit cell and raise the hydrogen storage amount. However, it reduces the absorption/desorption platform pressure of hydrogen.The monolayer model with two energies is in good accordance with the measured isotherms for all the alloys. The behavior of the adjusted parameters indicated that the hydrogen absorption occurred in a multi-atom manner. The study of the receptor site density indicates that the rise of temperature results in the filling of the host sites. We concluded then that the number of active sites Nm valid for H atoms is generally reduced as a function of temperature. The magnitudes of the calculated absorption/desorption energies show that the hydrogen atoms are chemisorbed on Ti1.02Cr1.1Mn0.3Fe0.6RE0.03 alloys. The thermodynamic potential functions have shown that hydrogen absorption was spontaneous and exothermic. The outcome of configurational entropy presented two maxima of disorder at half-saturation pressures.
Conflicts of interest
There are no conflicts to declare.Acknowledgements
This research was funded by the Deanship of Scientific Research at Princess Nourah bint Abdulrahman University through the Fast-track Research Funding Program to support publication in the top journal (Grant no. 42-FTTJ-02).References
- H. C. Lin, K. M. Lin, K. C. Wu, H. H. Hsiung and H. K. Tsai, Cyclic hydrogen absorption-desorption characteristics of TiCrV and Ti08Cr1.2V alloys, Int. J. Hydrogen Energy, 2007, 32, 4966–4972 CrossRef CAS.
- H. Zhou, H. Z. Liu, L. Xu, S. C. Gao, X. H. Wang and M. Yan, Hydrogen storage properties of Nb-compounds-catalyzed LiBH4–MgH2, Rare Met., 2017, 36, 723–728 CrossRef CAS.
- Z. M. Yuan, W. Zhang, P. L. Zhang, Y. H. Zhang, W. G. Bu and S. H. Guo, et al., Improvement in the hydrogen storage performance of the as-milled Sm-Mg alloys using MoS2 nano-particle catalysts, RSC Adv., 2017, 7, 56365–56374 RSC.
- Y. Yin, B. Li, Z. M. Yuan, Y. Qi and Y. H. Zhang, A comparison of TiF3 and NbF5 catalytic effects on hydrogen absorption and desorption kinetics of a ball-milled Mg85Zn5Ni10 alloy, RSC Adv., 2018, 8, 34525–34535 RSC.
- N. A. A. Rusman and M. Dahari, A review on the current progress of metal hydrides material for solid-state hydrogen storage applications, Int. J. Hydrogen Energy, 2016, 41, 12108–12126 CrossRef CAS.
- Y. Zhang, et al., Development and application of hydrogen storage, J. Iron Steel Res. Int., 2015, 22, 757–770 CrossRef.
- B. Zhang and Y. Wu, Recent advances in improving performances of the lightweight complex hydrides Li-MgN-H system, Prog. Nat. Sci.: Mater. Int., 2017, 27, 21–33 CrossRef CAS.
- S. Niaz, T. Manzoor and A. H. Pandith, Hydrogen storage: materials, methods and perspectives, Renewable Sustainable Energy Rev., 2015, 50, 457–469 CrossRef CAS.
- R. Prabhukhot, M. M. Wagh and A. C. Gangal, A review on solid state hydrogen storage material, Adv. Energy Power, 2016, 4, 11–22 Search PubMed.
- Y. Jia, et al., Combination of nanosizing and interfacial effect: future perspective for designing Mg-based nanomaterials for hydrogen storage, Renewable Sustainable Energy Rev., 2015, 44, 289–303 CrossRef CAS.
- A. Eftekhari and B. Fang, Electrochemical hydrogen storage: opportunities for fuel storage, batteries, fuel cells, and supercapacitors, Int. J. Hydrogen Energy, 2017, 42, 25143–25165 CrossRef CAS.
- C. J. Webb, A review of catalyst-enhanced magnesium hydride as a hydrogen storage material, J. Phys. Chem. Solids, 2015, 84, 96–106 CrossRef CAS.
- H. Yamada, Electronic structure and magnetic properties of the cubic laves phase transition metal compound, Phys. B, 1988, 149, 390–402 CrossRef CAS.
- X. Q. Chen, W. Wolf, R. Podloucky and P. Rogl, Ab initio study of ground state properties of the Laves phase compounds. TiCr2, ZrCr2, and HfCr2, Phys. Rev. B: Condens. Matter Mater. Phys., 2005, 71, 174101 CrossRef.
- S. B. Gesari, M. E. Pronsato, A. Visintin and A. Juan, Hydrogen storage in AB2 Laves phase (A = Zr, Ti; B = Ni, Mn, Cr, V): binding energy and electronic structure, J. Phys. Chem. C, 2010, 114, 16832–16836 CrossRef CAS.
- M. Guo and E. Wu, Thermodynamics of hydrogenation for Ti1−xZrxMnCr Laves phase alloys, J. Alloys Compd., 2008, 455, 191–196 CrossRef.
- Z. Cao, L. Ouyang, H. Wang, J. Liu, D. Sun, Q. Zhang and M. Zhu, Advanced high pressure metal hydride fabricated via Ti-Cr-Mn alloys for hybrid tank, Int. J. Hydrogen Energy, 2015, 40, 2717–2728 CrossRef CAS.
- S. N. Klyamkin, A. Y. Kovriga and V. N. Verbetsky, Effect of substitution on F.C.C. and B.C.C. hydride phase formation in the TiCr2-H2 system, Int. J. Hydrogen Energy, 1999, 24, 149–152 CrossRef CAS.
- J. G. Park, H. Y. Jang, S. C. Han, P. S. Lee and J. Y. Lee, The thermodynamic properties of Ti-Zr-Cr-Mn Laves phase alloys, J. Alloys Compd., 2001, 325, 293–298 CrossRef CAS.
- O. Beeri, D. Cohen, Z. Gavra and M. H. Mintz, Sites occupation and thermodynamic properties of the TiCr2−xMnx-H2 (0 < x < 1) system: statistical thermodynamics analysis, J. Alloys Compd., 2003, 352, 111–122 CrossRef CAS.
- E. D. Wu, W. H. Li and J. Li, Int. J. Hydrogen Energy, 2012, 37, 1509–1517 CrossRef CAS.
- V. Bronca, P. Bergman, V. Ghaemmaghami, D. Khatamian and F. D. Manchester, Hydrogen absorption characteristics of an FeTi + misch metal alloy, J. Less-Common Met., 1985, 108, 313–325 CrossRef CAS.
- Y. Yan, Y. Chen, H. Liang, X. Zhou, C. Wu and M. Tao, Effect of Ce on the structure and hydrogen storage properties of V55Ti22.5Cr16.1Fe6.4, J. Alloys Compd., 2007, 429, 301–305 CrossRef CAS.
- C. Wu, Y. Yan, Y. Chen, M. Tao and X. Zheng, Effect of rare earth (RE) elements on V-based hydrogen storage alloys, Int. J. Hydrogen Energy, 2008, 33, 93–97 CrossRef CAS.
- X. Liu, L. Jiang, Z. Li, Z. Huang and S. Wang, Improve plateau property of Ti32Cr46V22 BCC alloy with heat treatment and Ce additive, J. Alloys Compd., 2009, 471, 36–38 CrossRef.
- E. M. Borzone, A. Baruj, M. V. Blanco and G. O. Meyer, Dynamic measurements of hydrogen reaction with LaNi5−xSnx alloys, Int. J. Hydrogen Energy, 2013, 38, 7335–7343 CrossRef CAS.
- G. Liu, D. Chen, Y. Wang and K. Yang, Experimental and computational investigations of LaNi5−xAlx (x = 0, 0.25, 0.5, 0.75 and 1.0) tritium-storage alloys, J. Mater. Sci. Technol., 2018, 34, 1699–1712 CrossRef.
- X. Hou, R. Hu, Y. Yang, L. Feng and G. Suo, Modification based on internal refinement and external decoration: a powerful strategy for superior thermodynamics and hysteresis of Mg-Ni hydrogen energy storage alloys, J. Alloys Compd., 2018, 766, 112–122 CrossRef CAS.
- D. C. Feng, H. Sun, X. T. Wang and Y. H. Zhang, Effect of milling duration on hydrogen storage thermodynamics and kinetics of ball-milled Ce-Mg-Ni-based alloy powders, J. Iron Steel Res. Int., 2018, 25, 746–754 CrossRef.
- J. J. Liu, S. Zhu, Z. Zheng, H. H. Cheng, K. Yan and Z. D. Zhu, Long-term hydrogen absorption/desorption properties and structural changes of LaNi4Co alloy with double desorption plateaus, J. Alloys Compd., 2019, 778, 681–690 CrossRef CAS.
- V. Yartys and R. Denys, Structure properties relationship in RE3−xMgxNi9H10−13 (RE = La, Pr, Nd) hydrides for energy storage, J. Alloys Compd., 2015, 645, 412–418 CrossRef.
- M. Spodaryk, L. Shcherbakova, A. Sameljuk, A. Wichser, V. Zakaznova-Herzog, M. Holzer, B. Braem, O. Khyzhun, P. Mauron, A. Remhof, Y. Solonin and A. Züttel, Description of the capacity degradation mechanism in LaNi5-based alloy electrodes, J. Alloys Compd., 2015, 621, 225–231 CrossRef CAS.
- E. R. Pinatel, M. Palumbo, F. Massimino, P. Rizzi and M. Baricco, Hydrogen sorption in the LaNi5−xAlx-H system (0 < x < 1), Intermetallics, 2015, 62, 7–16 CrossRef CAS.
- M. Ben Yahia, S. Knani, H. Dhaou, M. A. Hachicha, A. Jemni and A. Ben Lamine, Modeling and interpretations by the statistical physics formalism of hydrogen adsorption isotherm on LaNi4.75Fe0.25, Int. J. Hydrogen Energy, 2013, 38, 536–542 CrossRef.
- S. Wjihi, M. Bouzid, L. Sellaoui, S. Knani and H. Dhaoui, Statistical physics modeling of hydrogen sorption onto LaNi4.75Fe0.25: microscopic interpretation and thermodynamic potential investigation, Fluid Phase Equilib., 2016, 414, 170–181 CrossRef CAS.
- J. Blahovec and S. Yanniotis, Modified classification of sorption isotherms, J. Food Eng., 2009, 91, 72–77 CrossRef.
- Z. Yao, L. Liu, X. Xiao, C. Wang, L. Jiang and L. Chen, Effect of rare earth doping on the hydrogen storage performance of Ti1.02Cr1.1Mn0.3Fe0.6 alloy for hybrid hydrogen storage application, J. Alloys Compd., 2018, 731, 524–530 CrossRef CAS.
- T. Chi, Adsorption calculation and modeling, New York 2, 1994 Search PubMed.
- I. Richard, Massel Principe's of adsorption and reaction on solid surface, Urbana, Illinois, 1951, p. 110 Search PubMed.
- S. Wjihi, L. Sellaoui, M. Bouzid, H. Dhaou, S. Knani and A. Jemni, et al., Theoretical study of hydrogen sorption on LaNi5 using statistical physics treatment: microscopic and macroscopic investigation, Int. J. Hydrogen Energy, 2017, 42, 2699–2712 CrossRef CAS.
- S. Brunauer, P. H. Emmet and E. Teller, Adsorption of gases in multimolecular layers, J. Am. Chem. Soc., 1938, 60, 309–319 CrossRef CAS.
- J. Rouquerol, D. Avnir, C. W. Fairbridge and D. H. Everett, Recommendations for the characterization of porous solids, Pure Appl. Chem., 1994, 66, 1739–1758 CAS.
- A. Ben Lamine and Y. Bouazra, Application of statistical thermodynamics to the olfaction mechanism, Chem. Senses, 1997, 22, 67 CrossRef CAS PubMed.
- L. Sellaoui, D. I. Mendoza-Castillo, H. E. Reynel-Ávila, A. Bonilla-Petriciolet, A. Ben Lamine and A. Erto, A new statistical physics model for the ternary adsorption of Cu2+, Cd3+ and Zn2+ ions on bone char: Experimental investigation and simulations, Chem. Eng. J., 2018, 343, 544–553 CrossRef CAS.
- R. A. Swalin, Thermodynamics of solids, John Wiley & Sons, New York, 1962 Search PubMed.
- S. Knani, M. Mathlouthi and A. Ben Lamine, Modeling of the psychophysical response curves using the grand canonical ensemble in statistical physics, Food Biophys., 2007, 2, 183–192 CrossRef.
- N. Bouaziz, M. Ben Manaa and A. Ben Lamine, Theoretical study of hydrogen absorption-desorption on LaNi3.8Al1.2−xMnx using statistical physics treatment, Phys. B, 2017, 525, 46–59 CrossRef CAS.
- S. Knani, F. Aouainia, N. Bahloul, M. Khalfaoui, M. A. Hachicha and A. Ben Lamine, et al., Modeling of adsorption isotherms of water vapor on Tunisian olive leaves using statistical mechanical formulation, Phys. A, 2014, 400, 57–70 CrossRef CAS.
- B. Diu, C. Guthmann, D. Lederer and B. Roulet, Physique Statistique, Hermann, Paris, 1989 Search PubMed.
- C. Tien, Adsorption calculations and modeling, in Series in chemical engineering, Butterworth-Heinemann, London, 1994 Search PubMed.
- J. Li and C. J. Werth, Modeling sorption isotherms of volatile organic chemical mixtures in model and natural solids, Environ. Toxicol. Chem., 2002, 21, 1377–1383 CrossRef CAS PubMed.
- S. Wjihi, C. Briki, L. Sellaoui, A. Jemni and A. Ben Lamine, Theoretical study of hydrogen desorption on Mg50Ni50 using statistical physics treatment, Int. J. Hydrogen Energy, 2016, 42, 8733–8743 CrossRef.
- D. W. Marquardt, An algorithmfor least-squares estimation of nonlinear parameters, J. Soc. Ind. Appl. Math., 1963, 11, 431–441 CrossRef.
- A. Kapoor and R. T. Yang, Correlation of equilibrium adsorption data of condensable vapours on porous adsorbents, Gas Sep. Purif., 1989, 3, 187–192 CrossRef CAS.
- D. P. Shoemaker and C. B. Shoemaker, Concerning atomic sites and capacities for hydrogen absorption in the AB2 Friauf-Laves phases, J. Less-Common Met., 1979, 68, 43–58 CrossRef CAS.
- R. G. Agostino, G. Liberti, V. Formoso and E. Colavita, In situ X-ray absorption study of Zr(V0.29Ni0.71)3 hydride electrodes, Phys. Rev. B: Condens. Matter Mater. Phys., 2000, 61, 13647–13648 CrossRef CAS.
- S. Hong and C. L. Fu, Hydrogen in Laves phase ZrX2 (X = V, Cr, Mn, Fe, Co, Ni) compounds: binding energies and electronic and magnetic structure, Phys. Rev. B: Condens. Matter Mater. Phys., 2002, 66, 094109 CrossRef.
- S. B. Gesari, M. E. Pronsato, A. Visintin and A. Juan, Hydrogen storage in AB2 laves phase (A = Zr, Ti; B = Ni, Mn, Cr, V): binding energy and electronic structure, J. Phys. Chem., 2010, 114, 16832–16836 CrossRef CAS PubMed.
- Y. Anikina and V. N. Verbetsky, Calorimetric investigation of the hydrogen interaction with Ti0.9Zr0.1Mn1.2V0.1, Int. J. Hydrogen Energy, 2011, 36, 1344–1348 CrossRef.
- X. Liu, L. Jiang, Z. Li, Z. Huang and S. Wang, Improve plateau property of Ti32Cr46V22 BCC alloy with heat treatment and Ce additive, J. Alloys Compd., 2009, 471, 36e38 CrossRef.
- N. Bouaziz, M. Bouzid and A. Ben Lamine, Theoretical study of hydrogen absorption and desorption in Ti1−xZrxMn1.4 using statistical physics treatment: Microscopic investigation and thermodynamic potential interpretation, Int. J. Hydrogen Energy, 2018, 43, 1615–1633 CrossRef CAS.
- C. Lundin, F. Lynch and C. Magee, A correlation between the interstitial hole sizes in intermetallic compounds and the thermodynamic properties of the hydrides formed from those compounds, J. Less-Common Met., 1977, 56, 19–37 CrossRef CAS.
- Z. Hang, L. Chen, X. Xiao, S. Li, C. Chen, Y. Lei and Q. Wang, The effect of Cr content on the structural and hydrogen storage characteristics of Ti10V80−xFe6Zr4Crx (x = 0–14) alloys, J. Alloys Compd., 2010, 493, 396–400 CrossRef CAS.
- Z. Chen, X. Xiao, L. Chen, X. Fan, L. Liu, S. Li, H. Ge and Q. Wang, Influence of Ti super-stoichiometry on the hydrogen storage properties of Ti1+xCr1.2Mn0.2Fe0.6 (x = 0–0.1) alloys for hybrid hydrogen storage application, J. Alloys Compd., 2014, 585, 307–311 CrossRef CAS.
- P. J. Cappillino, E. J. Lavernia, M. D. Ong, W. G. Wolfer and N. Y. Yang, Plastic deformation and hysteresis for hydrogen storage in Pd-Rh alloys, J. Alloys Compd., 2014, 586, 59–65 CrossRef CAS.
- Q. Kong, W. Feng, X. Zhong, Y. Liu and L. Lian, Hydrogen absorption/desorption properties of porous hollow palladium spheres prepared by templating method, J. Alloys Compd., 2016, 664, 188–192 CrossRef CAS.
- R. Balasubramaniam, Hysteresis in metal-hydrogen systems, J. Alloys Compd., 1997, 253, 203–206 CrossRef.
- L. Couture and R. Zitoun, Physique statistique, J. Ellipses, 1992, 524, 375 Search PubMed.
- K. H. Norwich, Determination of saltiness from the laws of thermodynamics estimating the gas constant from psychophysical experiments, Chem. Senses, 2001, 26, 1015–1022 CrossRef CAS PubMed.
| This journal is © The Royal Society of Chemistry 2021 |

