 Open Access Article
Chitosan-based carbon nanoparticles as a heavy metal indicator and for wastewater treatment†
Panyong Wangab,
Li Li *b,
Xinpei Pangab,
Yan Zhangb,
Yang Zhangb,
Wen-Fei Dong
 b and
Ruhong Yan*c
aSchool of Biomedical Engineering (Suzhou), Division of Life Sciences and Medicine, University of Science and Technology of China, Hefei 230026, China
bCAS Key Laboratory of Biomedical Diagnostics, Suzhou Institute of Biomedical Engineering and Technology, Chinese Academy of Science (CAS), Suzhou 215163, China. E-mail: lil@sibet.ac.cn
cThe Affiliated Suzhou Science & Technology Town Hospital of Nanjing Medical University, Suzhou 215153, China. E-mail: yrhzl@hotmail.com
First published on 24th March 2021
Abstract
The increasingly serious problem of heavy metal ion pollution has caused great harm to human health and the environment. It is urgent to develop a simple and feasible method to remove heavy metal ions in wastewater. In this paper, we prepared blue-green fluorescent carbon nanoparticles (chi-CNPs) with chitosan as the raw material, which realized the efficient removal of heavy metal ions. In addition, the removal effect of heavy metal ions can be evaluated by the fluorescence changes of chi-CNPs. Finally, we applied chi-CNPs to the treatment of industrial wastewater. The value of the total dissolved solids (TDS) was used to evaluate the treatment effect. The removal rate of heavy metal ions by chi-CNPs was 54.6%, which was much higher than that of other carbon dots or semiconductors. Because of its simplicity, safety and cleanliness, it is suitable for large-scale production and is expected to become a general method to solve the pollution of heavy metal ions in wastewater.
1. Introduction
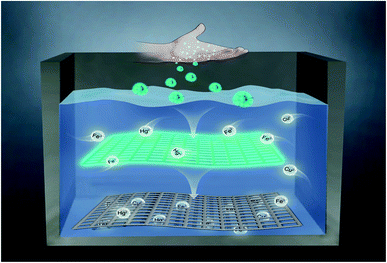
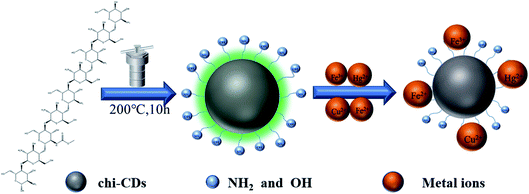
Pollution of heavy metal ions has become one of the important problems in the field of environmental sanitation.1 Excessive heavy metal ions in domestic water will seriously threaten human health.2 It is well known that mercury pollution, such as the Minamata disease in Japan, has caused great damage to property and health.3,4 In addition, excess metal ions such as iron, copper, lead, cadmium and other metal ions in the human body will destroy bones and kidneys, cause hypertension, nervous system diseases and brain diseases.5–7 For the detection of heavy metal ions, mass spectrometry,8,9 electrochemical detection10 and X-ray fluorescence spectrometry11 are commonly used. However, most of these methods are difficult to be widely used due to economic factors. As is known, carbon dots (CDs, encompassing carbon nanoparticles, C-dots, carbon quantum dots and graphene quantum dots) have been treated as having a carbon core with an sp2 domain and surface functional groups.12 CDs from biomaterials13 have good biocompatibility, stable fluorescence properties, non-toxic and great prospects in this field.14–17 Chitosan,18,19 as a linear polysaccharide linked by β-glucoside bond, is the product of deacetylation of chitin widely distributed in nature.20 Because of its easy availability and good biocompatibility, chitosan was widely used in drug delivery,21 wound healing,22 antibacterial treatment,23 food manufacturing,24,25 biochemical analysis26 and other fields. Also, chitosan-based carbon dots were mostly used for biosensor27–31 and bioimaging.32,33 Pawar et al. have reported functionalized chitosan–carbon dots as a probe to detect trace amount of water.31 Damera et al. have synthesized a full-color fluorescence nanoprobe using Eucalyptus Twigs as the carbon source for detecting Brilliant Blue and bioimaging.34Herein, chitosan was used as raw material to prepare a kind of blue-green fluorescent carbon nanoparticles (chi-CNPs) to achieve the efficient removal of heavy metal ions (Scheme 1). The chi-CNPs were synthesized by one-step hydrothermal method, which is simple, cheap, environmentally friendly and suitable for large-scale production. In addition, the chitosan branched chain structure of chi-CNPs is easily hydrolyzed to form a cross-linked network structure (Scheme 1), which can effectively collect and adsorb heavy metal ions. At the same time, the rich hydroxyl and amino groups on the surface of chi-CNPs can also form a stable complexation with heavy metal ions, and then the metal ions were dragged away from the water and removed by sedimentation. Such similar swelling-induced reticular crosslinking was more effective than the single nanospheres or microspheres in removing heavy metal ions,35–37 and the removal efficiency of chitosan to heavy metal ions reached 54.6%, much higher than other carbon quantum dots and semiconductors.38,39 In addition, the fluorescence intensity of chi-CNPs quickly decreased or even quenched after complexation with heavy metal ions, due to the combined action of electron transfer and aggregation. Through the fluorescence quenching effect, the linear analysis between the concentration of heavy metal ions and chi-CNPs fluorescence intensity showed that chi-CNPs could detect Fe3+, Hg2+, Cu2+, Fe2+ and other heavy metal ions in wastewater, and chi-CNPs with the network structure could adsorb heavy metals and settle to the bottom, which was easy to separate. In order to evaluate the removal level of heavy metal ions in the industrial wastewater, the content of total dissolved solids (TDS) in wastewater was measured by the conductivity method. Since chi-CNPs could combine with multiple metal ions, the indicator method for single metal ion was obviously inconvenient to evaluate multiple metal ions. Fortunately, the conductivity method can solve this problem and evaluate the change of the total heavy metal ions content in the wastewater. This work shows that chi-CNPs can effectively capture heavy metal ions in wastewater and evaluate their removal effect by conductivity changes. Therefore, the chi-CNPs are expected to be widely used in wastewater treatment.
2. Experimental section
2.1 Synthesis of chi-CNPs
Highly fluorescent chi-CNPs were synthesized by hydrothermal methods (Scheme 2). 1 g of chitosan solid was dissolved in 30 mL of deionized water to prepare the aqueous solution, which was put into an autoclave (50 mL). The solution was heated at 200 °C for 10 hours. The autoclave was naturally cooled to room temperature and the large insoluble particles were removed by filtration with filter paper. Dialysis was performed for 8 hours with a membrane (Mw = 1000), and the water was changed every four hours. The solution was frozen at −80 °C and then chi-CNPs powders were obtained in a freeze dryer.2.2 The characterization of chi-CNPs was studied by various analytical methods
Freeze dryers (Scientz-10N, China) was used to obtain chi-CNPs solid powders. Transmission electron microscopy (TEM, JEOL Ltd, Japan) was used to characterize the morphology of the chi-CNPs. Nano ZS/ZEN3690 (Malvern, UK) was used to investigate the particle size distribution and surface potential of the chi-CNPs. Fourier transform infrared (FT-IR) spectra was acquired using an FT-IR spectrometer (Agilent Cary 660, USA). The conductivity meter (DDS307, China) was used to measure the conductivity of the solution.2.3 Fluorescence detection of Hg2+, Fe3+, Fe2+, Cu2+ and mixed metal solution
The concentration of chi-CNPs was 0.2 mg mL−1 in water. To evaluate the sensitivity of the Hg2+, Fe3+, Fe2+, Cu2+ detection, the metal ions solutions of Hg2+, Fe3+, Fe2+, Cu2+ (0.1 M) were prepared. In order to evaluate the ability of chi-CNPs to remove mixed heavy metal ions, the mixed metal ions solutions (Al3+, Cd2+, Co2+, Cu2+, Fe3+, Fe2+, Hg2+, Mg2+, Ni2+, and Pb2+, total concentration is 0.1 M) were prepared. The same volume of heavy metal ions and mixed metal ions were added to the chi-CNPs solution. The change in value during fluorescence quenching and the concentration of metal ions were recorded for linear analysis. All the fluorescence spectra were measured from 410 nm to 700 nm (λex = 400 nm) at room temperature.2.4 Electrical conductivity meter was used to indicate the removal efficiency of heavy metal ions in the solution
The conductivity of a solution is positively correlated to the total amount of ions contained.40,41 Therefore, the conductivity value can be used to assess the changes of ions concentration in a solution. Since chi-CNPs are capable of scavenging multiple metal ions, it is difficult to characterize the ion scavenging effect with a single indicator method. After adding of chi-CNPs, the polymer was synthesized by chelating with heavy metal ions and settled at the bottom, resulting in the decrease in electrical conductivity. The electrical conductivity of the mixed metal solution was measured before and after adding chi-CNPs. The removal efficiency of heavy metal ions was characterized by the change of electrical conductivity and the formation of a complex in the solution.3. Results and conclusion
3.1 Characterization of chi-CNPs
The morphology and structure of the chi-CNPs were shown in Fig. 1A. TEM images showed that the diameter of chi-CNPs was about 50 nm. The results of Nano ZS90 (inset in Fig. 1A) confirmed the conclusion of TEM, showing that the diameter of chi-CNPs mainly distributed in the wide range of 60–100 nm, with an average diameter size of 79.06 nm. The size of carbon nanoparticles prepared in this study are larger than the traditional carbon dots (3–10 nm),42–44 which might be due to the fact that chitosan is a natural polymer and contains a variety of hydrolysates in the process of forming chi-CNPs. Besides, a polymer film was formed on the surface of the chi-CNPs by dissolving chitosan, which increased the particle size (the particle size is 54.84 nm, the polymer film is 5.82 nm, and the polymer film accounts for about one-tenth of the total particle size). The formation of polymer films promoted the chelation of chi-CNPs with heavy metal ions. At the same time, larger chi-CNPs can better adsorb and settle heavy metal ions with higher removal efficiency. The surface functional groups of chi-CNPs were determined by FT-IR. As shown in Fig. 1B, the structure of the absorption peak at 3164 cm−1 was considered to be from the stretching vibration of N–H/O–H which is similar to the functional groups of chitosan. The peak at 1577 cm−1 corresponded to the stretching vibration peak of C![[double bond, length as m-dash]](https://www.rsc.org/images/entities/char_e001.gif) O and the peaks at 1000–1500 cm−1 were attributed to the presence of C
O and the peaks at 1000–1500 cm−1 were attributed to the presence of C![[double bond, length as m-dash]](https://www.rsc.org/images/entities/char_e001.gif) C and C–O bond. That the peak at 937 cm−1 was from the stretching vibration peak of C–C bond. The results show that there were hydrophilic functional groups on the surface of chi-CNPs, such as –NH2 and –OH, which made chi-CNPs have good water solubility and binding ability to heavy metal ions, thus achieving a more thorough removal effect.
C and C–O bond. That the peak at 937 cm−1 was from the stretching vibration peak of C–C bond. The results show that there were hydrophilic functional groups on the surface of chi-CNPs, such as –NH2 and –OH, which made chi-CNPs have good water solubility and binding ability to heavy metal ions, thus achieving a more thorough removal effect.
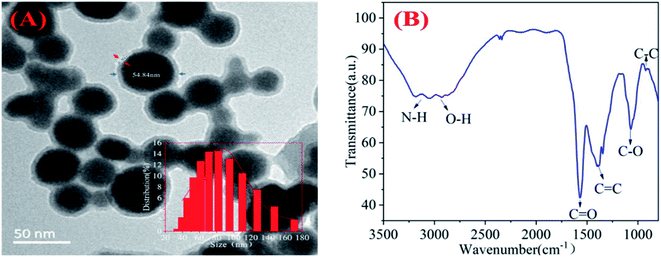 | ||
| Fig. 1 (A) TEM images of chi-CNPs dispersion in water and a Gaussian particle size distribution profile of chi-CNPs is observed. (B) FT-IR spectrum of chi-CNPs. | ||
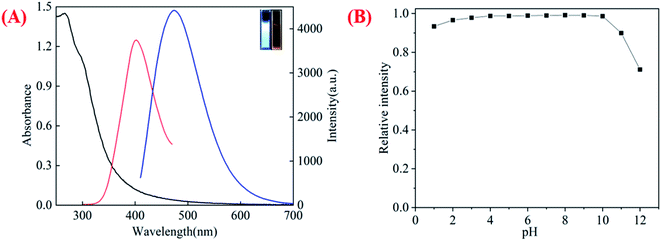
The optical absorption spectra of chi-CNPs show intense peaks in the UV region centered at 265 nm and the emission peak is located at 478 nm with the excitation of 400 nm (Fig. 2A). Therefore, under the excitation light, the chi-CNPs emitted bright blue-green fluorescence (inset in Fig. 2A). To investigate the stability, the FL relative intensity of the chi-CNPs toward extreme pH in solution was measured (Fig. 2B) which gives the effect of pH on the fluorescence intensity of chi-CNPs. Under acidic conditions, the fluorescence of chi-CNPs almost did not change (the relative fluorescence intensity only decreases by less than 5%). Under alkaline conditions, the fluorescence intensity changed slightly, but the relative fluorescence intensity decreased to 70% at pH 12. In the range of pH 1–11, chi-CNPs show stable fluorescent even under extreme pH conditions, which can be understood that there are abundant amino and hydroxyl groups on the surface of chi-CNPs. The fluorescence stability at different pH values also shows that the chi-CNPs can work in a wider and more complex water environment.
3.2 Fluorescence detection of Fe3+, Fe2+, Cu2+ and Hg2+ in aqueous solution
Iron ions play an important role in human physiological functions.45,46 As shown in Fig. S1,† after adding metal ions with the concentration of 300 μM, the fluorescence quenching of chi-CNPs by Fe3+ was the most obvious, followed by Hg2+, Fe2+ and Cu2+. Because the trivalent iron ions have more positive charges than monovalent and divalent cations and are easier to combine with groups such as hydroxyl and amino groups on the surface of the chi-CNPs. In addition, the iron ions in the solution will easily absorb the fluorescence emission of the chi-CNPs because the emission energy just matches the d–d electron transition in the iron ions.47 We have studied the change of fluorescence intensity of chi-CNPs after adding Fe3+ at 478 nm. As shown in Fig. 3, with the addition of Fe3+, the fluorescence intensity of the chi-CNPs gradually decreased and there was a good linear relationship (y = −0.977x + 2036.8, R2 = 0.991) between the change of fluorescence intensity and the concentration of Fe3+ in the ranging from 600 to 1800 μM. The detection limit of Fe3+ was calculated to be 0.345 μM. Using the same method, Hg2+, Fe2+ and Cu2+ were measured. The detection limits of Cu2+, Fe2+ and Hg2+ were 1.17 μM (y = −0.421x + 2299.1, R2 = 0.991, Fig. S2†), 1.64 μM (y = −0.333x + 1961.9, R2 = 0.993, Fig. S3†) and 0.737 μM (y = −0.457x + 2079.4, R2 = 0.991, Fig. S4†). The change of chi-CNPs fluorescence intensity showed a good linear correlation with the concentration of the heavy metal ions added. Further, in order to investigate the selectivity of chi-CNPs for heavy metal ions, the change of fluorescence intensity was measured in the presence of various ions. As shown in Fig. S5,† the influence of other ions was almost negligible. The minimum detection limit of the chi-CNPs probe toward metal ions is lower than that previously reported metal ions detection assay (see Table 1). Therefore, the results show that chi-CNPs can be considered as a good fluorescent probe for detecting the concentration of heavy metal ions in a certain range.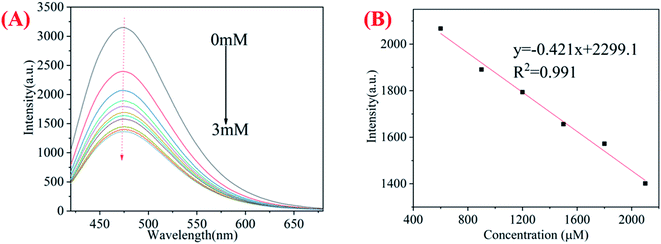 | ||
| Fig. 3 (A) Fluorescence quenching curve of chi-CNPs with iron ion (0–3 mM); (B) the correlation between chi-CNPs fluorescence intensity and Fe3+ at the various concentrations of 0.6–2.1 mM. | ||
3.3 Detection and removal of heavy metal ions by chi-CNPs
The mixed metal solutions of Al3+, Cd2+, Co2+, Cu2+, Fe3+, Fe2+, Hg2+, Mg2+, Ni2+, Pb2+ with a concentration of 0.1 M were prepared and added to the chi-CNPs solution (0.2 mg mL−1). The fluorescence intensity of chi-CNPs was measured by fluorescence spectrometer under the excitation of 400 nm. As shown in Fig. 4B, there is a good linear correlation (y = −0.336x + 2753.3, R2 = 0.998) between the fluorescence intensity of chi-CNPs and the concentration of mixed heavy metal ions (900–3600 μM), and the detection limit of mixed heavy metal ions was calculated to be 1.787 μM, which indicated that the concentration of heavy metal ions in a certain range could be detected according to the change of fluorescence intensity of chi-CNPs. The same amount of the chi-CNPs solid and chitosan was separately added into the mixed heavy metal ions solution of the same concentration, and the chelate precipitate was formed in both solutions. The conductivity of the solution was measured by conductivity meter, and the conductivity decreased to 45.4% (Fig. 4C) after adding chi-CNPs, which indicates that chi-CNPs could remove heavy metal ions in wastewater. It indicated that the chelation of chitosan with heavy metal ions was further strengthened after the formation of chi-CNPs. It is possible that after the formation of chi-CNPs, the cross-linking action will be enhanced, while the enrichment of coordination groups such as hydroxyl and amino and the enhanced solubility caused by hydrolysis will lead to a better binding effect with heavy metal ions.3.4 Possible mechanism of the FL response of chi-CNPs to heavy mental ions
The chi-CNPs are rich in hydroxyl and amino groups and have a good chelating effect on metal ions. As shown in Fig. 5A, on the one hand, after the formation of chi-CNPs, the water solubility was enhanced and the surface was rich in strong coordination groups such as hydroxyl and amino, which together promoted the higher chelating efficiency with heavy metal ions and a great number of chi-CNPs aggregated to form static quenching; on the other hand (Fig. 5B), the strong electron absorption capacity of heavy metal ions caused electron cloud to be biased towards the metal ions. As a result, the electron cloud density of the chi-CNPs decreased, which led to the decrease of the emission fluorescence and even fluorescence quenching. Combined with chelation at the bottom, it is speculated that static quenching and dynamic quenching lead to fluorescence quenching of chi-CNPs. To verify this hypothesis, time correlated single photon counting experiments were investigated. As shown in Fig S6,† the fluorescence lifetime of the chi-CNPs was displayed no obvious change in the presence and absence of metal ions and it is different from a dynamic fluorescence quenching mechanism, implying that the quenching process involves static quenching. | ||
| Fig. 5 (A) Schematic diagram of chi-CNPs static quenching. (B) A dynamic fluorescence quenching mechanism of chi-CNPs with metal ions. | ||
3.5 Application of chi-CNPs in removing heavy metal ions
Heavy metal ions pollution is harmful to the environment and human health, in order to explore the practical applicability of chi-CNPs, 50 mL of industrial wastewater was obtained from a nearby factory. The conductivity of wastewater was determined to be 12.48 mS cm−1 by conductivity meter. After adding 0.01 g of chi-CNPs into wastewater, due to the chelation of heavy metal ions by chi-CNPs and their cross-linking polymerization, the total dissolved solids (TDS) accumulated at the bottom in the wastewater and the conductivity decreased to 6.05 mS cm−1 (Fig. 6A). Under the irradiation of ultraviolet light, the wastewater added with chi-CNPs would emit bright blue-green fluorescence (Fig. 6B). Then, the wastewater containing chi-CNPs was allowed to stand for 24 hours and there was chelate precipitation at the bottom. From 1 hour to 24 hours, the precipitation of heavy metal ions gradually increased, forming granular solids at first, and then slowly precipitating at the bottom. At the same time as precipitation formation, the fluorescence intensity changes obviously from bright to dark under the ultraviolet excitation light with the wavelength of 365 nm. These results further confirmed the reliability of chi-CNPs in the removal of heavy metal ions in aqueous solutions.4. Conclusion
In summary, by using biological macromolecular chitosan as the only material, bright blue-green chi-CNPs can be obtained by one-step hydrothermal method and its fluorescence properties are stable. There is a good linear relationship between the fluorescence intensity of chi-CNPs and the concentration of heavy metal ions. The measurement of conductivity before and after adding chi-CNPs in the solution of heavy metal ions can indicate the scavenging effect of chi-CNPs on heavy metal ions. Therefore, the chi-CNPs are an effective indicator and a scavenger for heavy metal ions, which have the characteristics of simple preparation and convenient use, and have the potential of large-scale application.Conflicts of interest
There are no conflicts of interest to declare.Acknowledgements
This research was funded by the National Key R&D Program of China (Grand No. 2020YFC2004600), the National Natural Science Foundation of China (Grand No. 8160071152, 21803075, 61805273, and 81902166), the Science and Technology Department of Jinan City (2018GXRC016), and the Science Foundation of the Chinese Academy of Sciences (Grand No. 2020SYHZ0041).References
- D. Hou, D. O'Connor, A. D. Igalavithana, D. S. Alessi, J. Luo, D. C. W. Tsang, D. L. Sparks, Y. Yamauchi, J. Rinklebe and Y. S. Ok, Nature Reviews Earth & Environment, 2020, 1, 366–381 Search PubMed.
- Y. Huang, Q. Chen, M. Deng, J. Japenga, T. Li, X. Yang and Z. He, J. Environ. Manage., 2018, 207, 159–168 CrossRef CAS.
- S. Nishigaki and M. Harada, Nature, 1975, 258, 324–325 CrossRef CAS PubMed.
- R. Li, H. Wu, J. Ding, W. Fu, L. Gan and Y. Li, Sci. Rep., 2017, 7, 46545 CrossRef CAS.
- H. Kozlowski, M. Luczkowski, M. Remelli and D. Valensin, Coord. Chem. Rev., 2012, 256, 2129–2141 CrossRef CAS.
- W. Cerpa, L. Varela-Nallar, A. E. Reyes, A. N. Minniti and N. C. Inestrosa, Mol. Aspects Med., 2005, 26, 405–420 CrossRef CAS PubMed.
- A. Khan, P. Singh and A. Srivastava, J. Trace Elem. Med. Biol., 2020, 62, 126582 CrossRef CAS.
- L. Z. Suo, X. Y. Dong, X. Gao, J. F. Xu, Z. Huang, J. Ye, X. M. Lu and L. S. Zhao, Microchem. J., 2019, 149, 10 CrossRef.
- P. M. Leal, E. V. Alonso, M. M. L. Guerrero, M. T. L. Cordero, J. M. C. Pavon and A. G. de Torres, Talanta, 2018, 184, 251–259 CrossRef.
- A. Waheed, M. Mansha and N. Ullah, TrAC, Trends Anal. Chem., 2018, 105, 37–51 CrossRef CAS.
- E. Kamilari, K. Farsalinos, K. Poulas, C. G. Kontoyannis and M. G. Orkoula, Food Chem. Toxicol., 2018, 116, 233–237 CrossRef CAS.
- D. Qu and Z. Sun, Mater. Chem. Front., 2020, 4, 400–420 RSC.
- R. Das, R. Bandyopadhyay and P. Pramanik, Mater. Today Chem., 2018, 8, 96–109 CrossRef CAS.
- T. N. J. I. Edison, R. Atchudan, J.-J. Shim, S. Kalimuthu, B.-C. Ahn and Y. R. Lee, J. Photochem. Photobiol., B, 2016, 158, 235–242 CrossRef CAS PubMed.
- S. Y. Lim, W. Shen and Z. Gao, Chem. Soc. Rev., 2015, 44, 362–381 RSC.
- M. J. Molaei, Talanta, 2019, 196, 456–478 CrossRef CAS.
- J. Yue, L. Li, L. Cao, M. Zan, D. Yang, Z. Wang, Z. Chang, Q. Mei, P. Miao and W.-F. Dong, ACS Appl. Mater. Interfaces, 2019, 11, 44566–44572 CrossRef CAS.
- A. Muxika, A. Etxabide, J. Uranga, P. Guerrero and K. de la Caba, Int. J. Biol. Macromol., 2017, 105, 1358–1368 CrossRef CAS.
- T. A. Ahmed and B. M. Aljaeid, Drug Des., Dev. Ther., 2016, 10, 483–507 CrossRef CAS.
- K. Divya and M. S. Jisha, Environ. Chem. Lett., 2018, 16, 101–112 CrossRef CAS.
- A. Ali and S. Ahmed, Int. J. Biol. Macromol., 2018, 109, 273–286 CrossRef CAS.
- R. Augustine, S. R. U. Rehman, R. Ahmed, A. A. Zahid, M. Sharifi, M. Falahati and A. Hasan, Int. J. Biol. Macromol., 2020, 156, 153–170 CrossRef CAS PubMed.
- M. A. Hassan, A. M. Omer, E. Abbas, W. M. A. Baset and T. M. Tamer, Sci. Rep., 2018, 8, 11416 CrossRef PubMed.
- A. Castro Marín, D. Colangelo, M. Lambri, C. Riponi and F. Chinnici, Crit. Rev. Food Sci. Nutr., 2020, 1–15, DOI:10.1080/10408398.2020.1798871.
- P. Kulawik, E. Jamróz and F. Özogul, Environ. Chem. Lett., 2020, 18, 61–74 CrossRef CAS.
- M. M. Jaworska, D. Antos and A. Górak, React. Funct. Polym., 2020, 152, 104606 CrossRef CAS.
- S. Ben Aoun, R. Soc. Open Sci., 2017, 4, 171199 CrossRef.
- F. Mollarasouli, K. Asadpour-Zeynali, S. Campuzano, P. Yáñez-Sedeño and J. M. Pingarrón, Electrochim. Acta, 2017, 246, 303–314 CrossRef CAS.
- F. Shi, J. Li, J. Sun, H. Huang, X. Su and Z. Wang, Talanta, 2020, 207, 120341 CrossRef CAS.
- F. Abazar and A. Noorbakhsh, Sens. Actuators, B, 2020, 304, 127281 CrossRef CAS.
- S. Pawar, U. K. Togiti, A. Bhattacharya and A. Nag, ACS Omega, 2019, 4, 11301–11311 CrossRef CAS PubMed.
- L. Tan, R. Huang, X. Li, S. Liu, Y.-M. Shen and Z. Shao, Carbohydr. Polym., 2017, 157, 325–334 CrossRef CAS.
- Z. Shekarbeygi, N. Farhadian, M. Ansari, M. Shahlaei and S. Moradi, Spectrochim. Acta, Part A, 2020, 228, 117848 CrossRef CAS.
- D. P. Damera, R. Manimaran, V. V. Krishna Venuganti and A. Nag, ACS Omega, 2020, 5, 19905–19918 CrossRef CAS.
- Q. Huang, Y. Liu, T. Cai and X. Xia, J. Photochem. Photobiol., A, 2019, 375, 201–208 CrossRef CAS.
- X. Wang, W. Cai, S. Liu, G. Wang, Z. Wu and H. Zhao, Colloids Surf., A, 2013, 422, 199–205 CrossRef CAS.
- X. Luo, X. Lei, N. Cai, X. Xie, Y. Xue and F. Yu, ACS Sustainable Chem. Eng., 2016, 4, 3960–3969 CrossRef CAS.
- N. Gogoi, M. Barooah, G. Majumdar and D. Chowdhury, ACS Appl. Mater. Interfaces, 2015, 7, 3058–3067 CrossRef CAS.
- A. Sayari, S. Hamoudi and Y. Yang, Chem. Mater., 2005, 17, 212–216 CrossRef CAS.
- L. S. Xie, L. Sun, R. Wan, S. S. Park, J. A. DeGayner, C. H. Hendon and M. Dincă, J. Am. Chem. Soc., 2018, 140, 7411–7414 CrossRef CAS PubMed.
- J. Y. Wang, J. Tang, T. Guo, S. H. Zhang, W. Xia, H. B. Tan, Y. Bando, X. Wang and Y. Yamauchi, J. Mater. Chem. A, 2019, 7, 18388–18396 RSC.
- S.-T. Yang, L. Cao, P. G. Luo, F. Lu, X. Wang, H. Wang, M. J. Meziani, Y. Liu, G. Qi and Y.-P. Sun, J. Am. Chem. Soc., 2009, 131, 11308–11309 CrossRef CAS.
- Y. Sun, S. Liu, L. Sun, S. Wu, G. Hu, X. Pang, A. T. Smith, C. Hu, S. Zeng, W. Wang, Y. Liu and M. Zheng, Nat. Commun., 2020, 11, 5591 CrossRef CAS.
- Y. Lin, Z. Wang, X. Zhang, T. Zeng, L. Bai, Z. Kang, C. Wang, X. Zhao, H. Xu and Y. Liu, NPG Asia Mater., 2020, 12, 64 CrossRef CAS.
- Y. Jiang, C. Li, Q. Wu, P. An, L. Huang, J. Wang, C. Chen, X. Chen, F. Zhang, L. Ma, S. Liu, H. He, S. Xie, Y. Sun, H. Liu, Y. Zhan, Y. Tao, Z. Liu, X. Sun, Y. Hu, Q. Wang, D. Ye, J. Zhang, S. Zou, Y. Wang, G. Wei, Y. Liu, Y. Shi, Y. Eugene Chin, Y. Hao, F. Wang and X. Zhang, Nat. Commun., 2019, 10, 2935 CrossRef PubMed.
- S. Lynch, C. M. Pfeiffer, M. K. Georgieff, G. Brittenham, S. Fairweather-Tait, R. F. Hurrell, H. J. McArdle and D. J. Raiten, J. Nutr., 2018, 148, 1001S–1067S CrossRef.
- Y. Song, S. Zhu, S. Xiang, X. Zhao, J. Zhang, H. Zhang, Y. Fu and B. Yang, Nanoscale, 2014, 6, 4676–4682 RSC.
- S. P. Wu, Y. P. Chen and Y. M. Sung, Analyst, 2011, 136, 1887–1891 RSC.
- X. Ma, Y. Dong, H. Sun and N. Chen, Mater. Today Chem., 2017, 5, 1–10 CrossRef.
- N. Chaudhary, P. K. Gupta, S. Eremin and P. R. Solanki, J. Environ. Chem. Eng., 2020, 8, 103720 CrossRef CAS.
- A. Ananthanarayanan, X. Wang, P. Routh, B. Sana, S. Lim, D.-H. Kim, K.-H. Lim, J. Li and P. Chen, Adv. Funct. Mater., 2014, 24, 3021–3026 CrossRef CAS.
- B. Wang, S. Zhuo, L. Chen and Y. Zhang, Spectrochim. Acta, Part A, 2014, 131, 384–387 CrossRef CAS.
- K. Farhadi, M. Forough, R. Molaei, S. Hajizadeh and A. Rafipour, Sens. Actuators, B, 2012, 161, 880–885 CrossRef CAS.
Footnote |
| † Electronic supplementary information (ESI) available. See DOI: 10.1039/d1ra00692d |
| This journal is © The Royal Society of Chemistry 2021 |

