
 Open Access Article
 This Open Access Article is licensed under a Creative Commons Attribution-Non Commercial 3.0 Unported Licence
Fullerene translocation through peroxidized lipid membranes†
Gulsah Gul and
Nazar Ileri-Ercan*
and
Nazar Ileri-Ercan*
Department of Chemical Engineering, Bogazici University, Istanbul, Turkey. E-mail: nazar.ileri@boun.edu.tr
First published on 15th February 2021
Abstract
Recent cytotoxicity research suggests that fullerenes can enter the cell and cross the blood–brain barrier. However, the underlying toxicity mechanism behind the penetration of fullerenes through biological membranes is still not well understood. Here we perform coarse-grained molecular dynamics simulations to investigate the interactions of fullerenes and their polar derivatives (Janus) with model regular and peroxidized bilayers. We show that the translocation of fullerenes and their residence time in bulk water vary depending on the bilayer's peroxidation degree and fullerene polarity. The distribution of fullerenes inside the bilayer is mainly determined by the peroxidation degree and the saturation level of lipid acyl chains. The transport of pristine fullerenes through bilayers occurs at nano timescale while the complete diffusion may not be achieved for Janus fullerenes in micro timescale. As for the toxic response of fullerenes in terms of membrane damage, no mechanical disruption of model bilayers is observed throughout the studied simulation times.
Introduction
Since their discovery in 1985, fullerenes (C60) have become the focus of many studies due to their unique properties.1 Their application range includes photovoltaic devices,2 composite materials,3 artificial photosynthesis,4 energy conversion and storage3 and biomedical systems.5 While their superior electron-acceptor abilities allow fullerenes to be used conveniently in electronic systems,4 their antioxidant behavior,6 high permeability, and biocompatibility make them particularly suitable for drug delivery and photodynamic therapy agents.5,7Still, there are a limited number of studies on the environmental risk analysis of fullerene nanoparticles,8 and their biological effects present contradictory perspectives.9 Therefore, the rapid growth of fullerene use has raised concerns about their potential adverse impact on health and the environment. Although fullerenes dissolve in many organic solvents, they disperse in the form of aggregates in polar solvents such as water.10 These colloidal suspensions have shown that the size of fullerene nanoparticles varies between tens and a few hundreds of nanometers.11,12 Despite their large aggregate size, experimental evidence reveals that fullerene nanoparticles can penetrate cells and cross the blood–brain barrier (BBB).13 Several papers have addressed the biocompatible nature of fullerenes14–17 and their ability to penetrate efficiently through the BBB for delivering drugs into the brain.18,19 On the other hand, reactive oxygen species (ROS)-induced permeability increase and impairment in BBB have also been reported.20 BBB is composed of endothelial cells in complex junctions, being a multi-component system. Simple models including lipid bilayers (e.g., POPC or DOPC) in the absence21 and presence22 of protein molecule have been used to study the BBB before. However, the permeation and cytotoxicity mechanism of fullerenes through such systems as well as biological membranes is not yet well determined. Previous studies associated toxicity with water solubility behavior of fullerenes.23,24 It was reported that the toxicity of pristine fullerenes is seven orders of magnitude higher than functionalized water-soluble fullerene nanoparticles.23 Recent research proposed that the primary toxicity mechanism induced by fullerenes is ROS mediated lipid peroxidation.25–28 While water-soluble fullerenes are more prone to lipid peroxidation, both pristine fullerene and its hydroxyl derivative exhibited toxic responses through lipid peroxidation which results in membrane damage.25 Paradoxically, fullerenes have been utilized as antioxidant agents against radical-mediated lipid peroxidation and disruption of membrane integrity. Pristine fullerenes were found to be more favorable compared to its polar and water-soluble conjugates in terms of the maintenance of membrane integrity.29 There is also evidence that lipid peroxidation is a step in the chain of events involved in cytotoxicity rather than a triggering factor.30 Since this paradigm is still a topic of discussion, understanding the interactions between fullerenes and biological membranes (specifically oxidized membranes) is of central importance to determine their toxicity mechanism.
In the current study, we compare pristine and Janus fullerene nanoparticles through their interactions with various lipid bilayers, including DOPC, POPC, and their different levels of peroxidized forms, via MARTINI coarse-grained (CG) force field.31,32 Previous computational studies covered the permeation of monomeric fullerene across a lipid bilayer,33 solvation of fullerene in water,34 interactions of fullerene dimers inside a bilayer,35 effects of fullerene on liquid ordering,36 and fullerene aggregation on lipid membranes.37–39 To our knowledge, however, no study to date has examined the interactions of fullerene molecules with peroxidized lipid membranes, which is a so-called indicator of toxicity. This work provides an insight into the fullerene permeation across lipid membranes depending on the concentration and polarity of fullerene as well as the level of peroxidation of bilayers and suggests that the peroxidation is not likely the cause of membrane integrity disruption in the toxicity mechanism of fullerenes at the concentration levels tested.
Computational methods
Coarse-grained models
We performed CG molecular dynamics simulations to study the influence of fullerenes and their polar derivatives on lipid membranes by using the GROMACS 5.1.1 software package40 and MARTINI force field.31,32 A total of eight types of membrane models at four peroxidation levels (0, 30, 70, 100%) were used with either 1,2-dioleoyl-sn-glycero-3-phosphocholine (DOPC), or 1-palmitoyl-2-oleoyl-sn-glycero-3-phosphocholine (POPC) phospholipids that correspond to two different saturation levels. Initial configurations of the membranes were formed by insane.py script.41 The script was modified for peroxidized lipids based on their MARTINI force field description.42 The 16-bead CG representation of the fullerene molecule used in this study was developed by Monticelli et al.43 through Monte Carlo simulations on the sphere surface with a diameter of 0.72 nm. To obtain Janus form of fullerenes, half of the CNP (Carbon Nanoparticle) beads defined by Monticelli et al. were replaced by the more polar P5 bead.44 The structure of lipids and fullerene models are depicted in Fig. 1.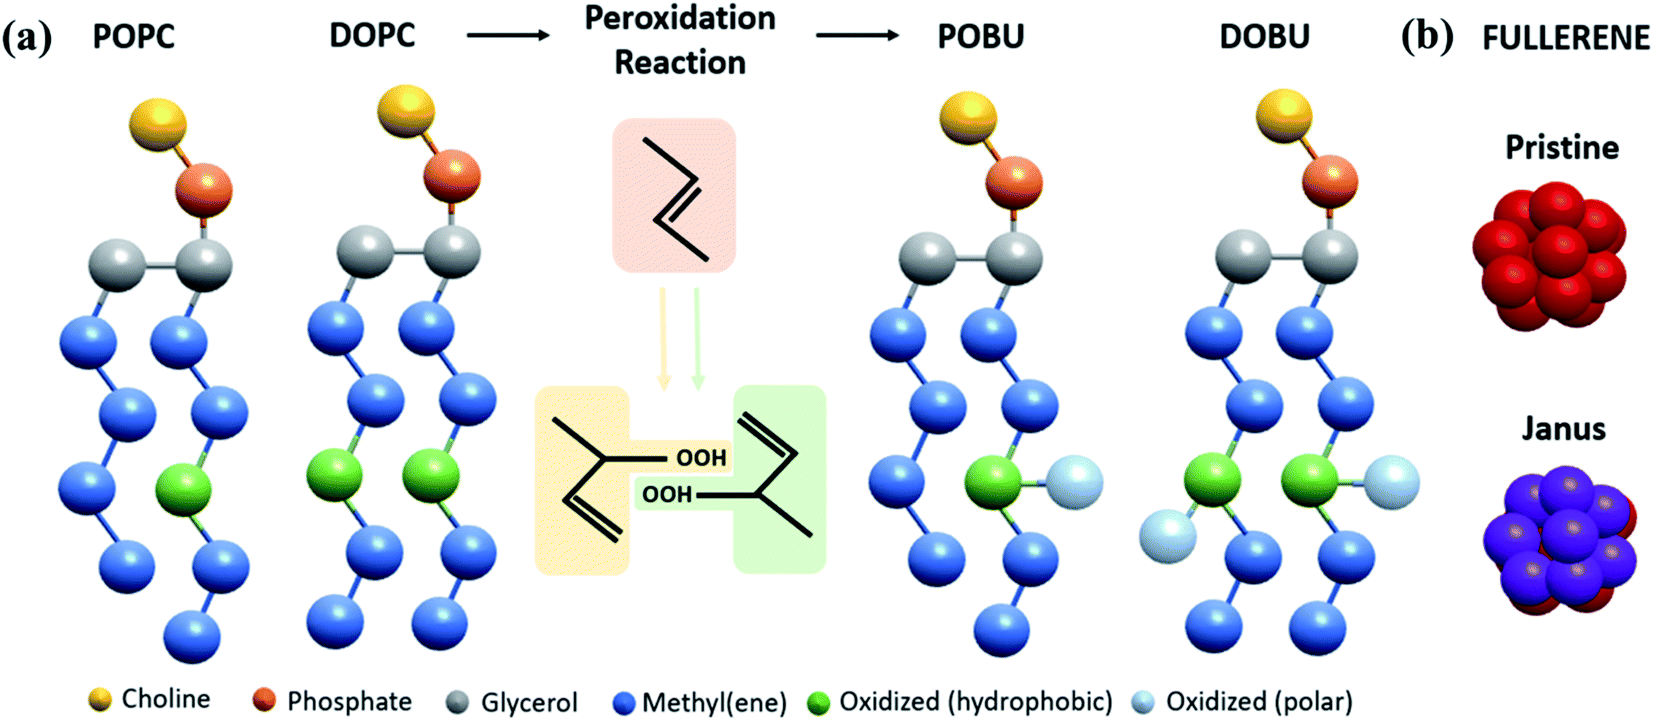 | ||
| Fig. 1 MARTINI representation of (a) POPC, DOPC and their oxidized analogs POBU and DOBU, (b) fullerene molecules. | ||
The simulated systems contained 512 lipids, 12![[thin space (1/6-em)]](https://www.rsc.org/images/entities/char_2009.gif) 312 CG water molecules, and 0.15 M NaCl salt concentration to mimic the physiological cell environment. Detailed information on the simulated systems is provided in Table S1 in the ESI.† The fullerene to lipid ratio was set to 0.002 and 0.02, which corresponds to 1 and 10 fullerene particles respectively, to observe the concentration effect on fullerene permeation. Each of 8 membrane systems was simulated both in the absence of fullerenes, as well as in the presence of 1 and 10 pristine/Janus fullerene molecules. Initially, fullerenes were randomly placed in the bulk water phase, approximately 1.5 nm away from the membrane head groups. For convenience, peroxidized POPC was renamed as POBU while peroxidized DOPC was called as DOBU. In the manuscript, the simulated system has been referred to as Lipid (% Peroxidation)-Number of Pristine/Janus Fullerene; for instance, POBU30-10P corresponds to a POPC bilayer containing a 30 mol% peroxidized POPC (POBU) and 10 pristine fullerene nanoparticles.
312 CG water molecules, and 0.15 M NaCl salt concentration to mimic the physiological cell environment. Detailed information on the simulated systems is provided in Table S1 in the ESI.† The fullerene to lipid ratio was set to 0.002 and 0.02, which corresponds to 1 and 10 fullerene particles respectively, to observe the concentration effect on fullerene permeation. Each of 8 membrane systems was simulated both in the absence of fullerenes, as well as in the presence of 1 and 10 pristine/Janus fullerene molecules. Initially, fullerenes were randomly placed in the bulk water phase, approximately 1.5 nm away from the membrane head groups. For convenience, peroxidized POPC was renamed as POBU while peroxidized DOPC was called as DOBU. In the manuscript, the simulated system has been referred to as Lipid (% Peroxidation)-Number of Pristine/Janus Fullerene; for instance, POBU30-10P corresponds to a POPC bilayer containing a 30 mol% peroxidized POPC (POBU) and 10 pristine fullerene nanoparticles.
MD simulation parameters
Initial systems were subjected to energy minimization using the steepest descent method and equilibrated for 60 ns with 10 fs time step to remove atomic overlaps and bad contacts that may occur during molecular setup. During equilibration, pressure was relaxed with Berendsen barostat45 with a coupling constant of 5 ps. Simulations (a total of 40 runs) were carried out under constant particle number, pressure, and temperature (NPT) ensemble. Temperature was maintained at 310 K by velocity-rescaling thermostat46 with a time constant of 1.0 ps. The semi-isotropic pressure coupling was used by setting reference pressure to 1 bar. Pressure of the system was controlled by using Parrinello–Rahman barostat47 with a coupling constant of 5 ps and a compressibility factor of 3 × 10⁻⁴ bar−1. Periodic boundary conditions were applied in all three dimensions, and the neighbor list was updated every 10 steps. A cutoff distance of 1.2 nm was employed for non-bonded interactions. The Lennard-Jones interactions were treated with a cut-off scheme48 and were shifted to zero between 0.9 and 1.2 nm by using Potential-Shift modifier.49 The Coulomb potential was based on Reaction Field scheme49,50 and shifted to zero between 0 and 1.2 nm with a permittivity constant of εr = 15. All systems were simulated for 10 μs with a time constant of 20 fs, and the analysis was performed by averaging the last 5 μs of trajectories that were saved for every 0.5 ns. To visualize the molecules and trajectories, the Visual Molecular Dynamics (VMD) software51 was utilized.MD analysis
The membrane properties and the interactions of fullerenes with membranes were evaluated through area per lipid (APL) and volume per lipid (VPL) values, lipid bilayer thicknesses, lateral diffusion coefficients, density distributions, and radial distribution functions (RDFs) by using corresponding GROMACS modules. APL was calculated by dividing the box area in xy direction to half of the total lipid number. In VPL calculation, box area in xy direction was multiplied with the z-dimension of the bilayer which is obtained from the distance between the headgroup peaks in the density profile and divided by the total lipid number. Bilayer thickness was found through calculating PO4 distance from upper to lower leaflet of the bilayer in z-direction. The lipid lateral diffusion values were obtained from the mean square displacement (MSD) curves by fitting the 5 to 9 μs section of the curve to MSD(t) = 4Dt + c where the constant c reflects the offset at t = 0.52 The lateral and longitudinal diffusion constants of fullerene and water molecules were calculated by the linear fitting of MSD curves between 8.5 and 9.5 μs.Potential of mean force (PMF) simulations
To further understand the translocation of a single fullerene through a lipid bilayer, the umbrella sampling technique53 with the weighted histogram analysis method (WHAM)54,55 was applied for DOPC, POPC, and their fully peroxidized forms (DOBU and POBU). A fullerene molecule was initially placed in the water phase at a 4.5 nm distance of the membrane center. Once the systems were energetically minimized and equilibrated for 60 ns, the fullerene was pulled to the center of the bilayer with 0.1 nm intervals in which resulted in evenly spaced 45 configurations. The distance between the center of mass (COM) of the fullerene and the membrane was restrained in the z-direction with a harmonic potential force constant 1000 kJ mol−1. Each umbrella window was simulated for 600 ns (100 ns equilibration) under the NPT ensemble at 310 K for a total time of 27 μs. The energetic description of fullerene transport through the bilayer was analyzed via combining separate windows on WHAM to obtain additional evidence for its translocation behavior and to calculate its free energy minima within peroxidized lipids for the first time in literature.Results & discussion
Structural properties of lipid bilayers in the absence and presence of fullerene nanoparticles are given in Table 1. Since the excess area sourced by the undulations of bilayers is small, the area of the periodic box can be considered equal to the bilayer area. However, there is a significant difference between the volume of the bilayer and the volume of the simulation box due to the presence of water and ion molecules. Therefore, VPL values have also been calculated and given in Table 1.| Model | P/J no | Box area (nm2) | Area per lipid (nm2) | Box volume (nm3) | Volume per lipid (nm3) | Bilayer thickness (nm) | Lateral diffusion coefficient (μm2 s−1) | Longitudinal diffusion coefficient (μm2 s−1) | ||
|---|---|---|---|---|---|---|---|---|---|---|
| Lipid | P/J | P/J | Water | |||||||
| DOPC | No | 169.0 ± 1.3 | 0.660 ± 0.005 | 2250.3 ± 3.8 | 1.49 ± 0.01 | 4.44 ± 0.03 | 39.8 ± 2.2 | — | — | 0.23 ± 0.02 |
| 1P | 169.1 ± 1.3 | 0.661 ± 0.005 | 2248.7 ± 3.9 | 1.49 ± 0.01 | 4.44 ± 0.03 | 36.5 ± 1.2 | — | — | 0.23 ± 0.00 | |
| 1J | 169.1 ± 1.3 | 0.661 ± 0.005 | 2248.7 ± 3.9 | 1.50 ± 0.01 | 4.44 ± 0.03 | 36.4 ± 2.3 | — | — | 0.21 ± 0.03 | |
| 10P | 170.5 ± 1.3 | 0.666 ± 0.005 | 2252.3 ± 3.8 | 1.50 ± 0.01 | 4.44 ± 0.03 | 38.1 ± 3.6 | 54.8 ± 2.7 | −0.15 ± 1.13 | 0.24 ± 0.01 | |
| 10J | 169.9 ± 1.3 | 0.664 ± 0.005 | 2251.5 ± 3.9 | 1.50 ± 0.01 | 4.43 ± 0.03 | 33.3 ± 1.2 | 14.0 ± 6.1 | −0.00 ± 0.00 | 0.35 ± 0.04 | |
| DOBU30 | No | 183.5 ± 1.7 | 0.717 ± 0.007 | 2272.7 ± 3.8 | 1.48 ± 0.01 | 4.22 ± 0.03 | 29.5 ± 4.7 | — | — | 0.51 ± 0.09 |
| 1P | 183.6 ± 1.7 | 0.717 ± 0.007 | 2271.3 ± 3.8 | 1.49 ± 0.01 | 4.22 ± 0.03 | 30.7 ± 2.1 | — | — | 0.54 ± 0.03 | |
| 1J | 183.7 ± 1.7 | 0.717 ± 0.007 | 2271.2 ± 3.8 | 1.51 ± 0.01 | 4.21 ± 0.03 | 32.3 ± 2.5 | — | — | 0.48 ± 0.06 | |
| 10P | 184.0 ± 1.7 | 0.719 ± 0.007 | 2275.7 ± 3.9 | 1.58 ± 0.02 | 4.24 ± 0.03 | 28.2 ± 0.7 | 27.9 ± 25.7 | 0.03 ± 0.02 | 0.44 ± 0.08 | |
| 10J | 184.9 ± 1.7 | 0.722 ± 0.007 | 2275.6 ± 3.8 | 1.62 ± 0.02 | 4.21 ± 0.03 | 27.5 ± 0.3 | 12.0 ± 2.6 | 0.01 ± 0.00 | 0.51 ± 0.01 | |
| DOBU70 | No | 195.7 ± 2.1 | 0.764 ± 0.008 | 2303.6 ± 3.8 | 1.64 ± 0.02 | 4.14 ± 0.04 | 26.9 ± 1.8 | — | — | 1.36 ± 0.01 |
| 1P | 195.8 ± 2.1 | 0.765 ± 0.008 | 2301.7 ± 3.7 | 1.64 ± 0.02 | 4.15 ± 0.04 | 24.9 ± 2.9 | — | — | 1.28 ± 0.05 | |
| 1J | 195.9 ± 2.1 | 0.765 ± 0.008 | 2301.6 ± 3.8 | 1.63 ± 0.02 | 4.14 ± 0.04 | 30.6 ± 3.7 | — | — | 1.21 ± 0.02 | |
| 10P | 195.9 ± 2.1 | 0.765 ± 0.008 | 2305.7 ± 3.8 | 1.64 ± 0.02 | 4.18 ± 0.04 | 26.6 ± 0.4 | 35.0 ± 9.5 | 0.01 ± 0.01 | 1.06 ± 0.05 | |
| 10J | 192.3 ± 2.1 | 0.771 ± 0.008 | 2305.5 ± 3.8 | 1.64 ± 0.02 | 4.13 ± 0.04 | 23.0 ± 2.5 | 14.4 ± 3.6 | −0.00 ± 0.00 | 1.20 ± 0.06 | |
| DOBU | No | 203.5 ± 2.4 | 0.795 ± 0.010 | 2326.5 ± 3.8 | 1.73 ± 0.02 | 4.12 ± 0.04 | 26.6 ± 0.1 | — | — | 1.98 ± 0.03 |
| 1P | 203.5 ± 2.4 | 0.795 ± 0.009 | 2324.9 ± 3.8 | 1.73 ± 0.02 | 4.12 ± 0.04 | 28.3 ± 0.5 | — | — | 2.24 ± 0.00 | |
| 1J | 203.7 ± 2.4 | 0.796 ± 0.010 | 2324.8 ± 3.8 | 1.73 ± 0.02 | 4.12 ± 0.04 | 23.3 ± 2.4 | — | — | 2.10 ± 0.13 | |
| 10P | 203.4 ± 2.5 | 0.794 ± 0.010 | 2328.6 ± 3.8 | 1.64 ± 0.02 | 4.15 ± 0.04 | 24.2 ± 2.0 | 35.4 ± 13.0 | −0.01 ± 0.01 | 1.84 ± 0.07 | |
| 10J | 205.2 ± 2.4 | 0.802 ± 0.010 | 2328.4 ± 3.8 | 1.64 ± 0.02 | 4.10 ± 0.04 | 24.1 ± 1.5 | 15.8 ± 2.4 | −0.00 ± 0.01 | 2.17 ± 0.12 | |
| POPC | No | 161.5 ± 1.3 | 0.631 ± 0.005 | 2194.5 ± 3.8 | 1.37 ± 0.01 | 4.27 ± 0.03 | 42.0 ± 4.3 | — | — | 0.18 ± 0.04 |
| 1P | 161.6 ± 1.3 | 0.631 ± 0.005 | 2192.4 ± 3.8 | 1.35 ± 0.01 | 4.27 ± 0.03 | 40.1 ± 1.6 | — | — | 0.25 ± 0.02 | |
| 1J | 161.6 ± 1.3 | 0.631 ± 0.005 | 2192.3 ± 3.8 | 1.37 ± 0.01 | 4.26 ± 0.03 | 41.5 ± 0.3 | — | — | 0.25 ± 0.05 | |
| 10P | 163.1 ± 1.3 | 0.637 ± 0.005 | 2197.1 ± 3.8 | 1.37 ± 0.01 | 4.27 ± 0.03 | 41.4 ± 3.4 | 21.1 ± 12.5 | 0.10 ± 0.61 | 0.25 ± 0.00 | |
| 10J | 162.1 ± 1.3 | 0.633 ± 0.005 | 2197.2 ± 3.8 | 1.37 ± 0.01 | 4.26 ± 0.03 | 39.4 ± 2.8 | 10.3 ± 19.7 | −0.00 ± 0.00 | 0.22 ± 0.02 | |
| POBU30 | No | 171.8 ± 1.5 | 0.671 ± 0.006 | 2205.3 ± 3.8 | 1.39 ± 0.01 | 4.09 ± 0.03 | 35.9 ± 1.9 | — | — | 0.42 ± 0.04 |
| 1P | 171.9 ± 1.5 | 0.671 ± 0.006 | 2203.3 ± 3.8 | 1.36 ± 0.01 | 4.09 ± 0.03 | 35.8 ± 0.5 | — | — | 0.36 ± 0.01 | |
| 1J | 171.9 ± 1.5 | 0.672 ± 0.006 | 2203.3 ± 3.8 | 1.37 ± 0.01 | 4.09 ± 0.03 | 34.2 ± 4.5 | — | — | 0.33 ± 0.04 | |
| 10P | 173.1 ± 1.5 | 0.676 ± 0.006 | 2207.5 ± 3.9 | 1.38 ± 0.01 | 4.10 ± 0.03 | 33.0 ± 2.8 | 27.3 ± 11.2 | 0.01 ± 0.12 | 0.26 ± 0.01 | |
| 10J | 173.0 ± 1.5 | 0.676 ± 0.006 | 2207.5 ± 3.9 | 1.39 ± 0.01 | 4.08 ± 0.03 | 31.4 ± 2.5 | 12.6 ± 18.3 | −0.00 ± 0.00 | 0.36 ± 0.09 | |
| POBU70 | No | 183.6 ± 1.8 | 0.717 ± 0.007 | 2221.1 ± 3.7 | 1.38 ± 0.01 | 3.95 ± 0.03 | 33.5 ± 1.0 | — | — | 0.61 ± 0.07 |
| 1P | 183.6 ± 1.8 | 0.717 ± 0.007 | 2219.3 ± 3.8 | 1.46 ± 0.01 | 3.96 ± 0.03 | 32.8 ± 1.1 | — | — | 0.59 ± 0.12 | |
| 1J | 183.8 ± 1.8 | 0.718 ± 0.007 | 2219.3 ± 3.8 | 1.45 ± 0.01 | 3.95 ± 0.03 | 33.1 ± 0.6 | — | — | 0.61 ± 0.03 | |
| 10P | 184.0 ± 1.8 | 0.719 ± 0.007 | 2223.5 ± 3.8 | 1.45 ± 0.01 | 3.98 ± 0.03 | 28.4 ± 4.2 | 28.3 ± 12.0 | 0.02 ± 0.00 | 0.53 ± 0.01 | |
| 10J | 185.1 ± 1.8 | 0.723 ± 0.007 | 2223.6 ± 3.8 | 1.48 ± 0.01 | 3.94 ± 0.03 | 30.3 ± 2.0 | 27.4 ± 4.3 | −0.00 ± 0.00 | 0.58 ± 0.02 | |
| POBU | No | 189.2 ± 2.0 | 0.739 ± 0.008 | 2233.4 ± 3.7 | 1.48 ± 0.02 | 3.92 ± 0.03 | 33.7 ± 1.3 | — | — | 0.81 ± 0.07 |
| 1P | 189.2 ± 1.9 | 0.739 ± 0.008 | 2231.4 ± 3.7 | 1.46 ± 0.02 | 3.92 ± 0.03 | 34.8 ± 3.0 | — | — | 0.89 ± 0.04 | |
| 1J | 189.3 ± 1.9 | 0.740 ± 0.008 | 2231.4 ± 3.7 | 1.47 ± 0.02 | 3.92 ± 0.03 | 33.8 ± 1.7 | — | — | 0.96 ± 0.02 | |
| 10P | 189.4 ± 1.9 | 0.740 ± 0.008 | 2235.7 ± 3.8 | 1.49 ± 0.02 | 3.95 ± 0.03 | 31.2 ± 1.9 | 24.1 ± 7.0 | 0.01 ± 0.02 | 0.90 ± 0.11 | |
| 10J | 190.7 ± 1.9 | 0.745 ± 0.008 | 2235.7 ± 3.8 | 1.48 ± 0.02 | 3.91 ± 0.03 | 31.7 ± 2.0 | 8.4 ± 6.8 | −0.04 ± 0.03 | 0.95 ± 0.01 | |
The computed APL and bilayer thickness values are in close agreement with the previous experimental and computational results. For regular DOPC bilayer, APL and thickness values are calculated as 0.660 ± 0.005 nm2 and 4.44 ± 0.03 nm, respectively, whereas the reported experimental values range 0.67–0.73 nm2 and 3.53–4.60 nm.56–58 In a similar fashion, the APL and thickness in POPC bilayer are found as 0.631 ± 0.005 nm2 and 4.27 ± 0.03 nm, respectively, comparable to previously reported experimental and computational ranges of 0.63–0.68 nm2 and 3.70–4.31 nm.42,59–63 Furthermore, Table 1 indicates that APL values increase while bilayer thickness decrease with increased peroxidation. In fully peroxidized DOBU and POBU bilayers, we have obtained 20.4% and 17.2% increase in APL values but 7.2% and 8.2% decrease in thickness values as reported elsewhere.42,64 No significant change in the APL and bilayer thickness values are observed upon introduction of a single pristine/Janus fullerene molecule. In the presence of 10 pristine fullerenes, the bilayer thickness and APL values slightly increase except for 100% oxidized DOPC where the thickness slightly increases but the APL remains approximately constant. The change in thickness values is more apparent for higher peroxidation levels while the opposite is true for the APL. On the other hand, the presence of 10 Janus fullerenes have resulted in a slight increase in APL values but a decrease in bilayer thickness. Nevertheless, these changes are below 1% in all cases in agreement with the passive diffusion of fullerene molecules.
The VPL values listed in Table 1 show that peroxidation increases the volume of the bilayer resulting in higher VPL values in DOBU and POBU bilayers compared to regular DOPC and POPC. Experimental studies have reported VPL values of 1.303 nm3 for DOPC and 1.256 nm3 for POPC at 303 K, respectively.59 Our results demonstrate VPL values of 1.491 nm3 for DOPC and 1.373 nm3 for POPC at 310 K which are 14% and 9% higher than those of the experiments. However, considering the approximation made in the volume calculation and the effect of temperature, this variation is in the acceptable range. Similarly, Guo et al. have found the VPL of DOPC and POPC as 1.488 nm3 and 1.379 nm3, respectively, which are in close agreement with our results.42 The addition of pristine and Janus fullerenes to bilayer systems has no significant effect on the VPL values, in general, except for 70% peroxidized POPC. About 8% and 6% increase in VPL values are obtained, respectively, upon the addition of 10 P/J fullerene molecules into 30% peroxidized DOPC and 70% peroxidized POPC. However, ∼5% reduction in VPL is recorded with 100% peroxidized DOPC when 10 P/J fullerene molecules are added.
The lipid lateral diffusion coefficients at 310 K have been calculated as 39.8 and 42 μm2 s−1 for DOPC and POPC bilayers, respectively, which are larger than their corresponding experimental analogs of 16 and 15.3 μm2 s−1.65 However, it is a known fact that CG simulations predict 2 to 10 times faster diffusion than experimental observations based on the temperature. Therefore, not the numeric value but the relative trend of diffusion coefficients should be evaluated. In general, the lipid mobility decreases with increasing peroxidation level. However, the decrease is more significant at 30% lipid peroxidation, whereas the mobility values are about the same between 70% and 100% peroxidation level. The diffusion coefficients are 33.2% and 19.8% lower for fully peroxidized DOPC and POPC bilayers, respectively, compared to their corresponding regular bilayers. Thus, previously reported42 average 25% drop in lipid mobility is confirmed in our study. The reduction of lateral diffusion coefficients by hydroperoxidation has been attributed either to stronger cohesion between lipid molecules or increased friction between water–bilayer interface.42
Lateral and longitudinal diffusion coefficients for pristine and Janus molecules are also given in Table 1. Due to the large oscillations in MSD calculations, the values are reported only for systems including 10 pristine/Janus fullerene molecules. The lateral diffusion of fullerene is affected by both lipid peroxidation and saturation levels. In agreement with the previous findings,66 pristine fullerenes move faster in unsaturated lipids than in saturated ones. The highest fullerene mobility is observed in DOPC bilayer, which is almost twice as those of the POPC and its peroxidized forms. In DOBU30 and POPC bilayers where aggregation of pristine and Janus fullerenes is observed, the fullerene mobility is decreased, and the collective oscillations have considerably increased the standard error values. In other words, aggregation behavior is detected for the systems where the standard error of lateral diffusion constant of fullerenes is high. In addition, Janus fullerenes move slower than pristine fullerenes, indicating higher tendency of polar derivatives of fullerenes to aggregate. Longitudinal diffusion coefficient values of pristine and Janus fullerenes, on the other hand, are relatively small with large standard errors. This is due to low transport of fullerenes within the bilayer once they reach their preferred location (discussed further below). Another important point is the diffusion constant of water molecules in the z-direction. The values increase, in general, with increasing peroxidation level. The longitudinal diffusion constants of water molecules in the presence of pristine fullerenes are very similar in both DOPC and POPC bilayers. However, the mobility differs with lipid peroxidation being higher in more peroxidized lipids. These findings are also confirmed in our density distribution analysis (cf. Fig. S3†), in which water permeability is high in peroxidized lipids, especially in peroxidized DOPC. In the presence of single fullerene molecule, the longitudinal diffusion constants of water molecules are about the same or slightly change, whereas increasing the fullerene concentration results in a decrease in the values especially with pristine fullerenes at 30 and 70% peroxidation.
The density distribution profiles of lipid head, linker, and tail groups, as well as water and ions, are presented in Fig. 2 and 3 in the presence of 10 pristine and 10 Janus fullerene molecules for DOPC and POPC bilayers at various peroxidation degrees. The density distributions for one pristine/Janus fullerene molecule with all lipid types are given in Fig. S1 and S2 in the ESI.† When peroxidized lipids are compared to their regular PC counterparts, the density profiles of head and linker groups are found to be more broadened with a decrease in their density peak values. This drop increases with increasing peroxidation level, i.e., the more peroxidized the bilayer is, the less density peak values of head and glycerol groups are observed. Furthermore, the density values of the water are not completely vanished in the center of the peroxidized membranes. This is attributed to the water diffusion across the peroxidized lipids, which is more pronounced in DOBU bilayer as they are more prone to peroxidation due to the presence of double unsaturation in their carbon chains.
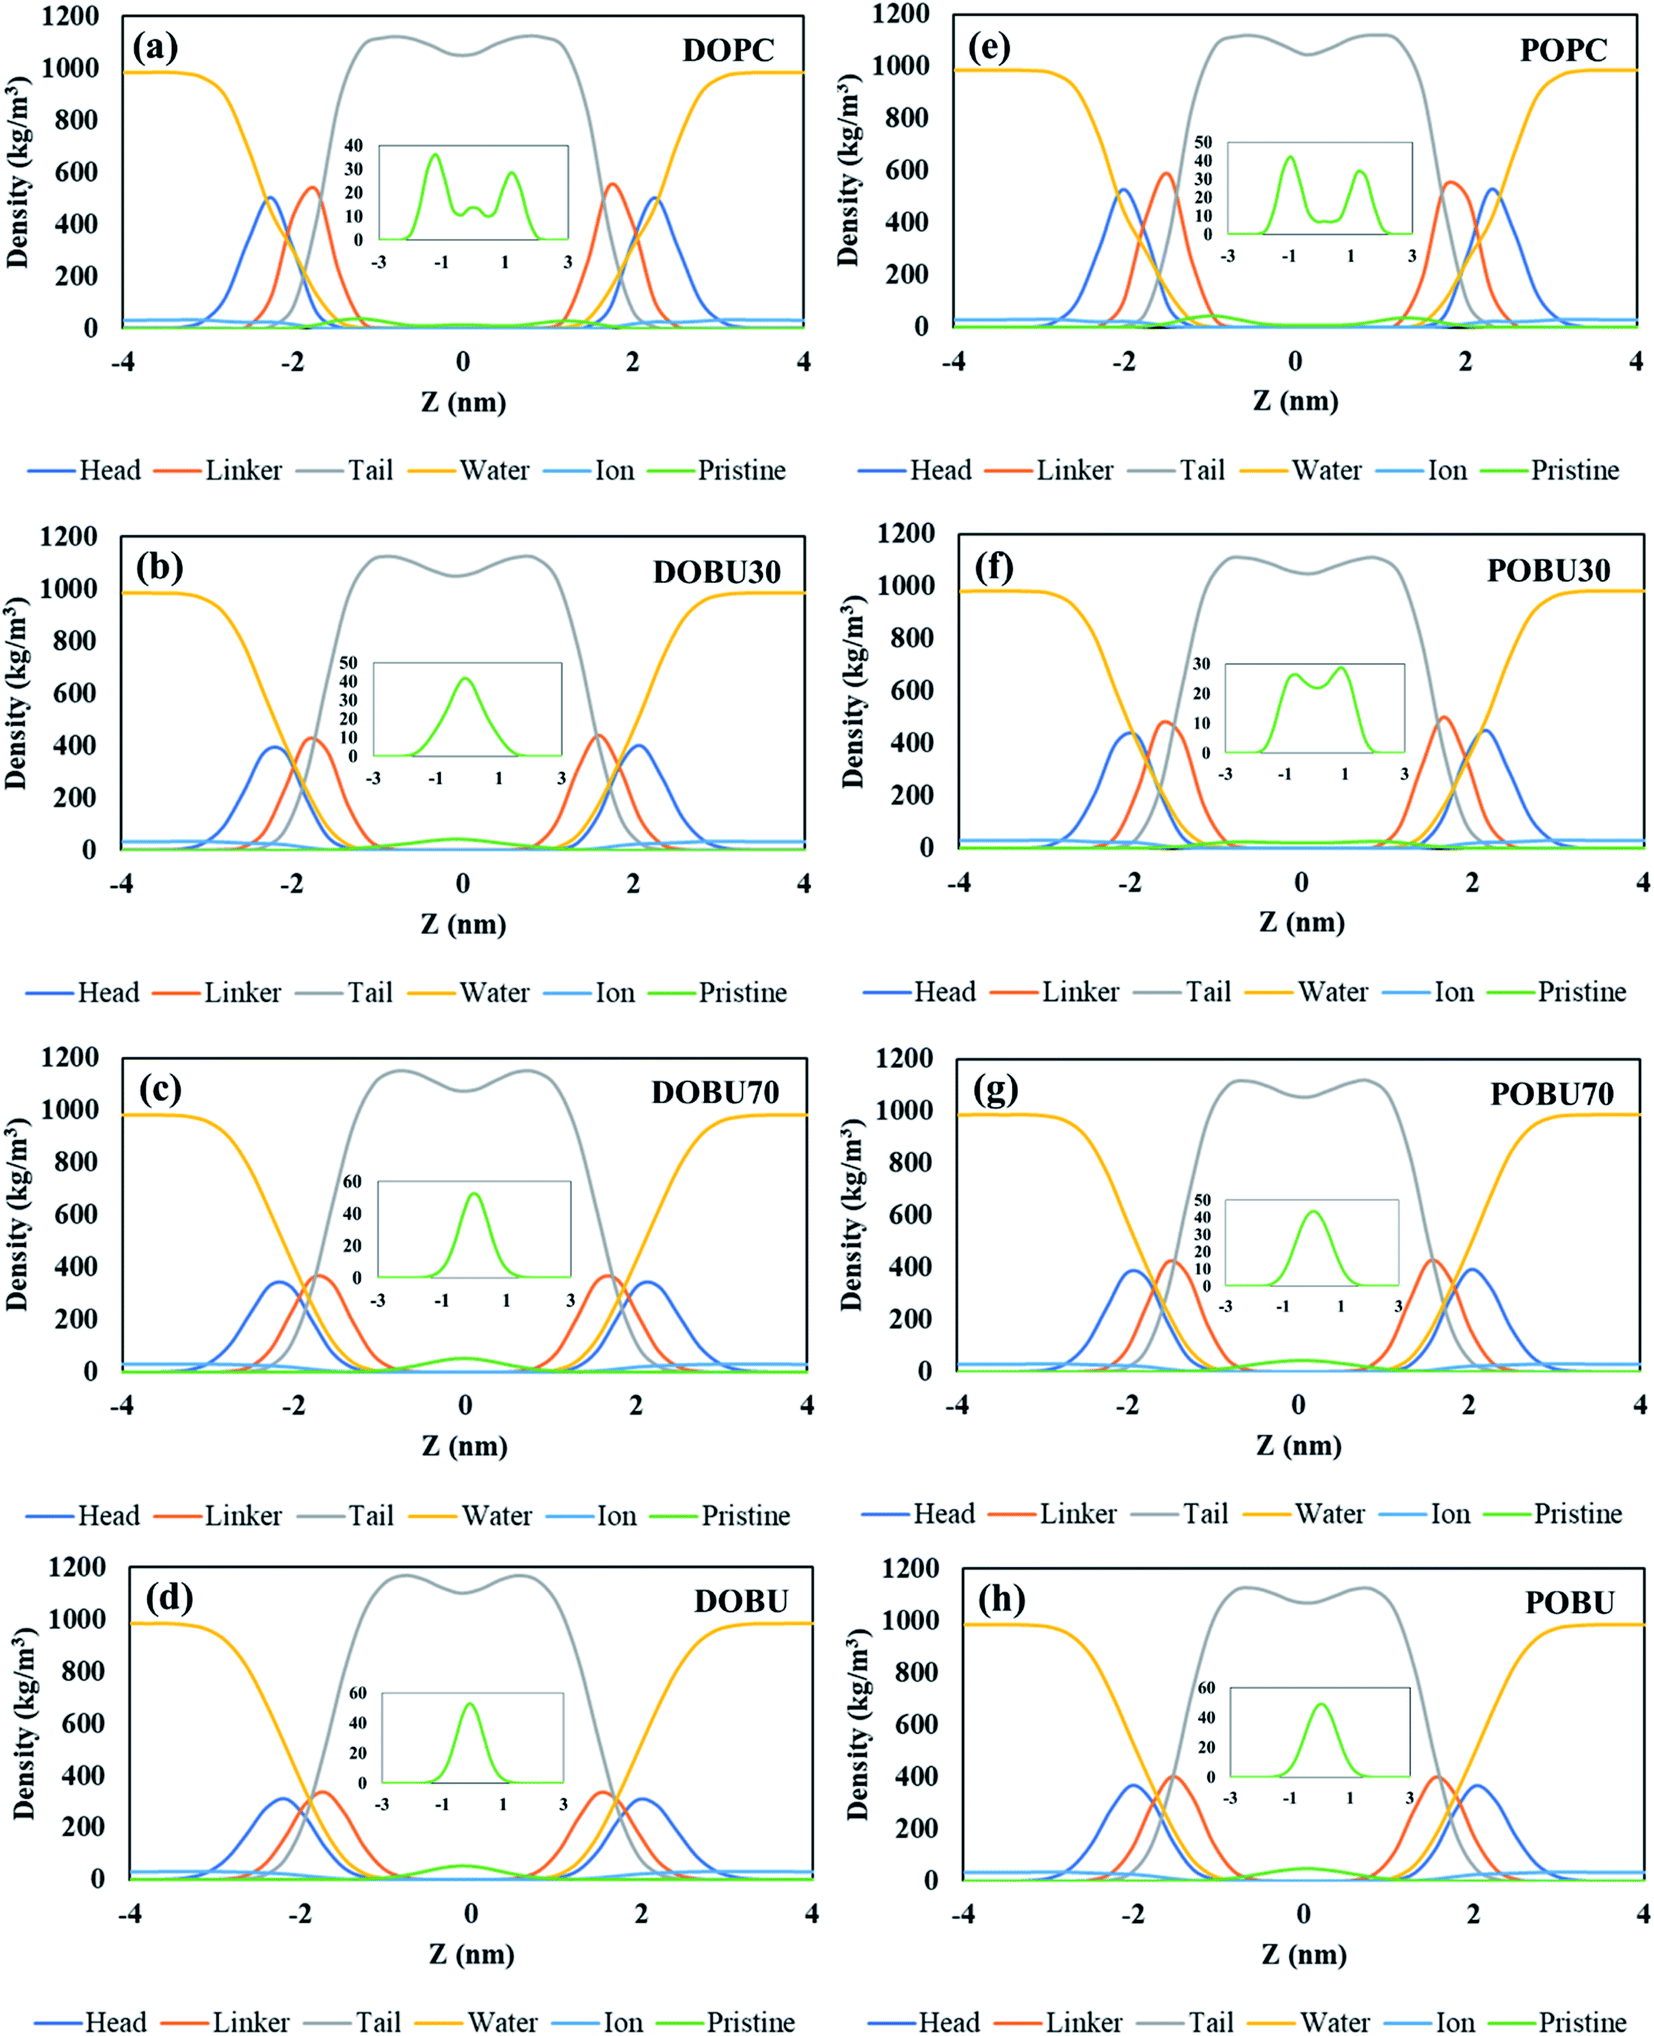 | ||
| Fig. 2 Density distribution profiles of lipid head (NC3 & PO4 beads), linker (GL1 & GL2 beads), and tail groups together with water, ion and pristine fullerenes (enlarged in insets), (a–d) for DOPC and its oxidized forms, (e–h) for POPC and its oxidized forms at fullerene to lipid ratio of F/L = 10/512. | ||
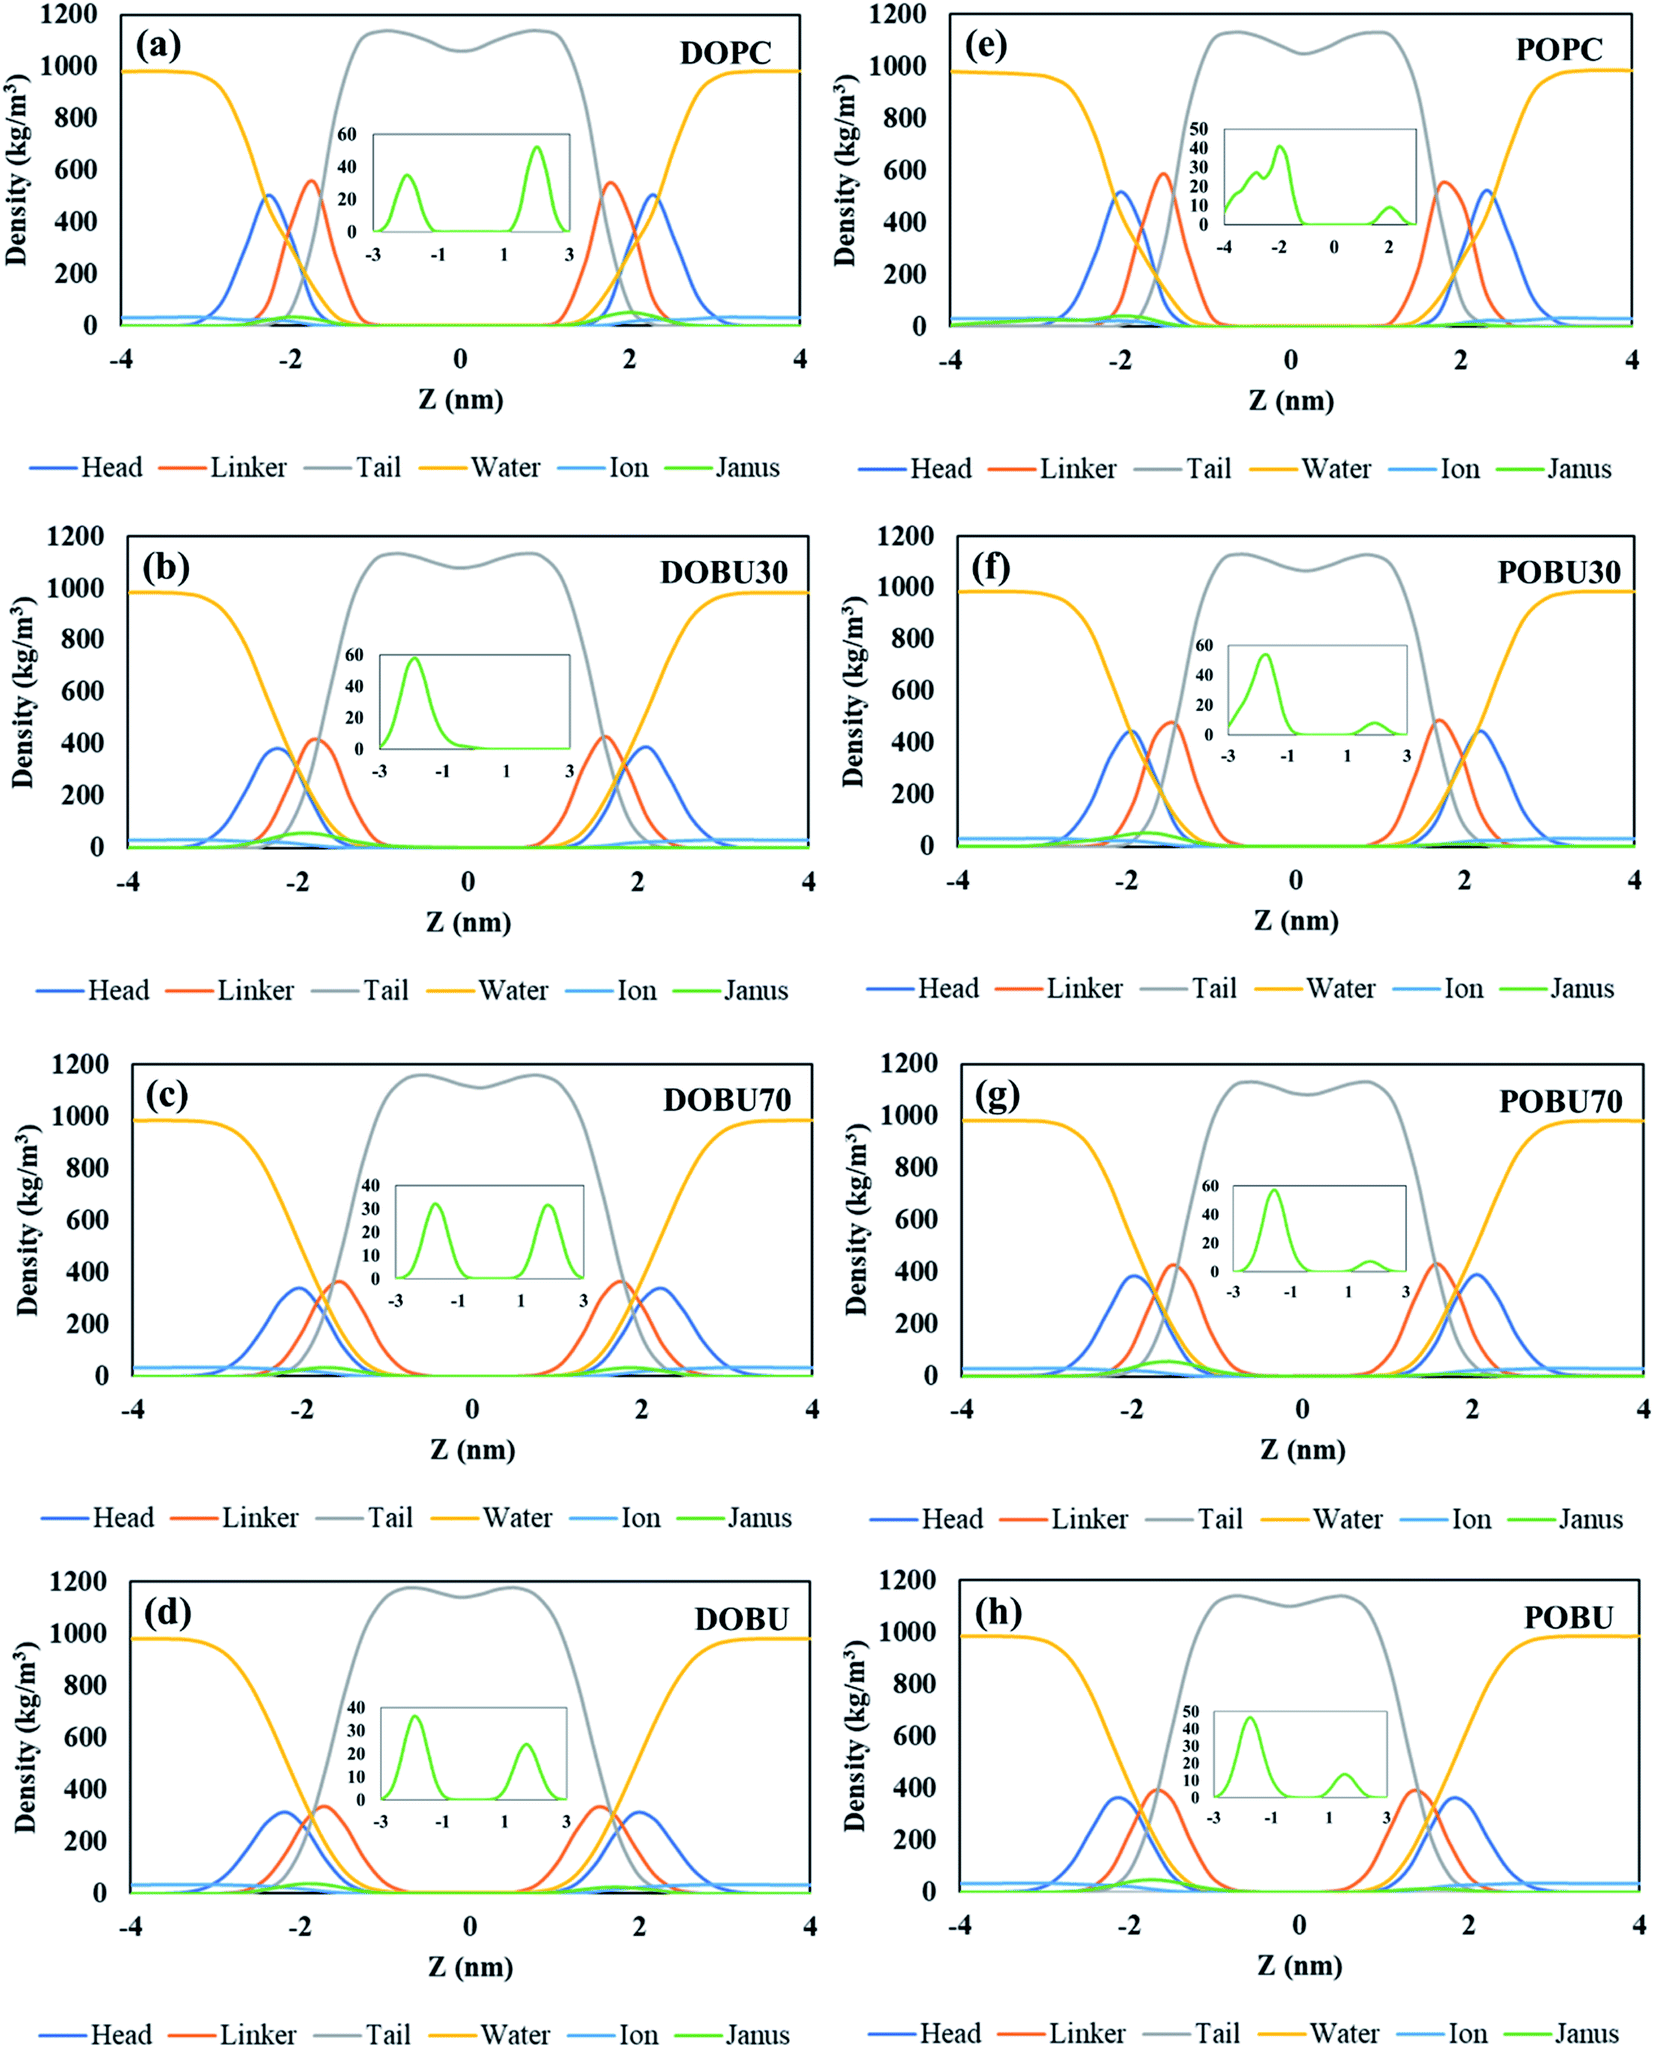 | ||
| Fig. 3 Density distribution profiles of lipid head (NC3 & PO4 beads), linker (GL1 & GL2 beads), and tail groups together with water, ion and Janus fullerenes (enlarged in insets), (a–d) for DOPC and its oxidized forms, (e–h) for POPC and its oxidized forms at fullerene to lipid ratio of F/L = 10/512. | ||
As previously demonstrated by atomistic simulations,33 the hydrophobicity of pristine fullerene nanoparticles mainly leads to its accumulation inside the lipid bilayer interior region. In general, fullerene molecules traverse the interfacial polar headgroup and place on hydrophobic part of the membrane.36 Our simulations also confirm this observation such that pristine fullerene nanoparticles reside close to the linker groups within DOPC and POPC bilayers and at the membrane center within the fully peroxidized DOBU and POBU bilayers (cf. Fig. 2). Higher density distributions of pristine fullerene near the linker groups in regular PC bilayers may be attributed to the presence of C double bonds. The unsaturated bonds in regular PC lipids impose an energy penalty restricting the translocation and accumulation of fullerenes in the central region of the bilayer as opposed to the oxidized bilayers (cf. Fig. 2(a) and (d)).
In peroxidized DOPC, pristine fullerenes concentrate in the center regardless of the lipid peroxidation level. Both 30% and 70% peroxidation results in fullerene translocation to the membrane center. On the other hand, the residence behavior depends on the peroxidation level for oxidized POPC. At 30% peroxidation, fullerenes mimic the translocation attitude of POPC bilayer, i.e., being close to linker groups, while at 70% peroxidation, they behave like in POBU bilayer, i.e., accumulating at the bilayer center. This may be due to the difference in lipid saturation levels and some threshold value to exceed the energy penalty caused by the C double bonds. DOPC bilayers have two double bonds in their carbon chains which result in double unsaturation, however, POPC bilayers exhibit mono unsaturation caused by the single double-bond in their carbon chains. Thus, with a higher degree of peroxidation, it may be easier to exceed the energy penalty imposed by C double bond. It should be noteworthy to mention that throughout the simulation time no pristine fullerene molecules are observed to return to the aqueous phase after internalization in any of the membrane systems studied.
Fullerenes must be able to pass through the membrane in order to be used as an effective drug carrier. In contrast to this fact, Janus fullerenes (half polar, half hydrophobic), are found to be directed to the head groups rather than the membrane interior regardless of the peroxidation level (cf. Fig. 3). Furthermore, diffusion across the bilayer is not observed in any of the membrane systems tested. The hydrophobic part of the fullerenes is found mostly facing the membrane head while the polar part tends to the bulk water phase. It has been previously reported44 that the Janus fullerenes quickly cross the membrane before settling in the opposite head groups. The dual characteristics of Janus particles have been suggested to be advantageous for drug delivery processes even though the desired exit from membrane head to the aqueous phase was not seen.44 However, in our study, we have not observed the aforementioned rapid diffusion of Janus fullerenes across the membranes tested. It should be noted that our CG model of Janus particles have been formed by the exchange of the half of CNP beads with MARTINI P5 beads and does not represent a validated model. Therefore, our results give insight about the penetration of Janus particles but drawing conclusions can be misleading.
The PMF values obtained from umbrella sampling and WHAM calculation are demonstrated in Fig. 4. The free energy minima with respect to the bilayer center are found at around 1 nm for DOPC and POPC and at around 0 nm for DOBU and POBU bilayers. This is consistent with the residence locations of pristine fullerenes in our study, i.e., being close to the glycerol groups in regular PC bilayers and at the center in peroxidized PC bilayers. Monticelli et al. estimated the free energy minimum as 80 kJ mol−1 through POPC bilayer via both atomistic and CG simulations.43 Similarly, D'Rozario et al. obtained about 80 kJ mol−1 energy through a 1,2-dipalmitoyl-sn-glycero-3-phosphocholine (DPPC) model where they used 20 beads representation of fullerene by 3-to-1 CG mapping.67 By using a five-bead tail DOPC membrane, Wong-Ekkabut et al. approximated the depth of energy well as 110 kJ mol−1.37 Fig. 4 confirms the free energy minima of pristine fullerene at approximately 80 kJ mol−1 and 100 kJ mol−1 within POPC and DOPC bilayers, respectively. As far as we know, the energy differential of fullerenes in peroxidized membranes have not been reported so far. Our PMF results show that the free energy minima are around 95 kJ mol−1 for both DOBU and POBU bilayers. Therefore, we conclude that about 10 kJ mol−1 energy penalty is added in the expense of peroxidation.
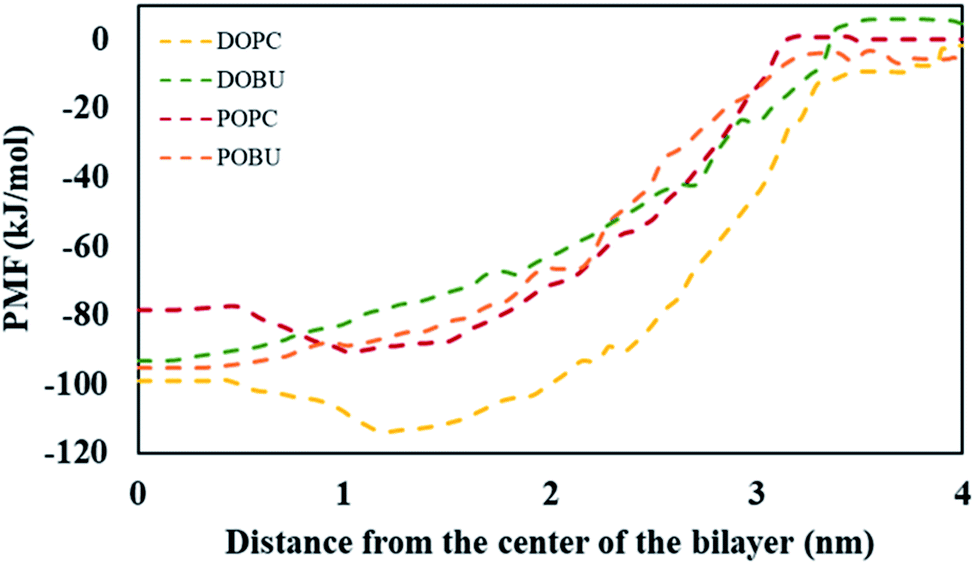 | ||
| Fig. 4 PMF for systems with a single pristine fullerene and model bilayers as a function of the distance between their centers of mass. | ||
The residence time in bulk water is found to be lower with the hydrophobic pristine nanoparticle than with the polar Janus, as previously reported44 (cf. Fig. 5 and 6). Higher residence time with Janus NPs is attributed to their more hydrophilic nature. Among all cases, fullerenes permeate into the fully peroxidized membranes faster than into the DOPC or POPC, which is ascribed to higher longitudinal diffusion coefficients of water molecules and hence higher permeation of water through peroxidized bilayers. The longest time in the aqueous phase, i.e., up to 171 ns for pristine and 327 ns for Janus nanoparticle, has been spent on the DOPC membrane among all membrane models studied. The time difference is more apparent when DOPC and DOBU are compared rather than POPC and POBU membranes. Still, simulation repetitions with different starting configurations are suggested for more accurate results, since the time passes in the aqueous phase depend on the initial position of fullerenes. However, our simulations in the presence of 10 fullerene molecules also result in a similar pattern in terms of relative residence time.
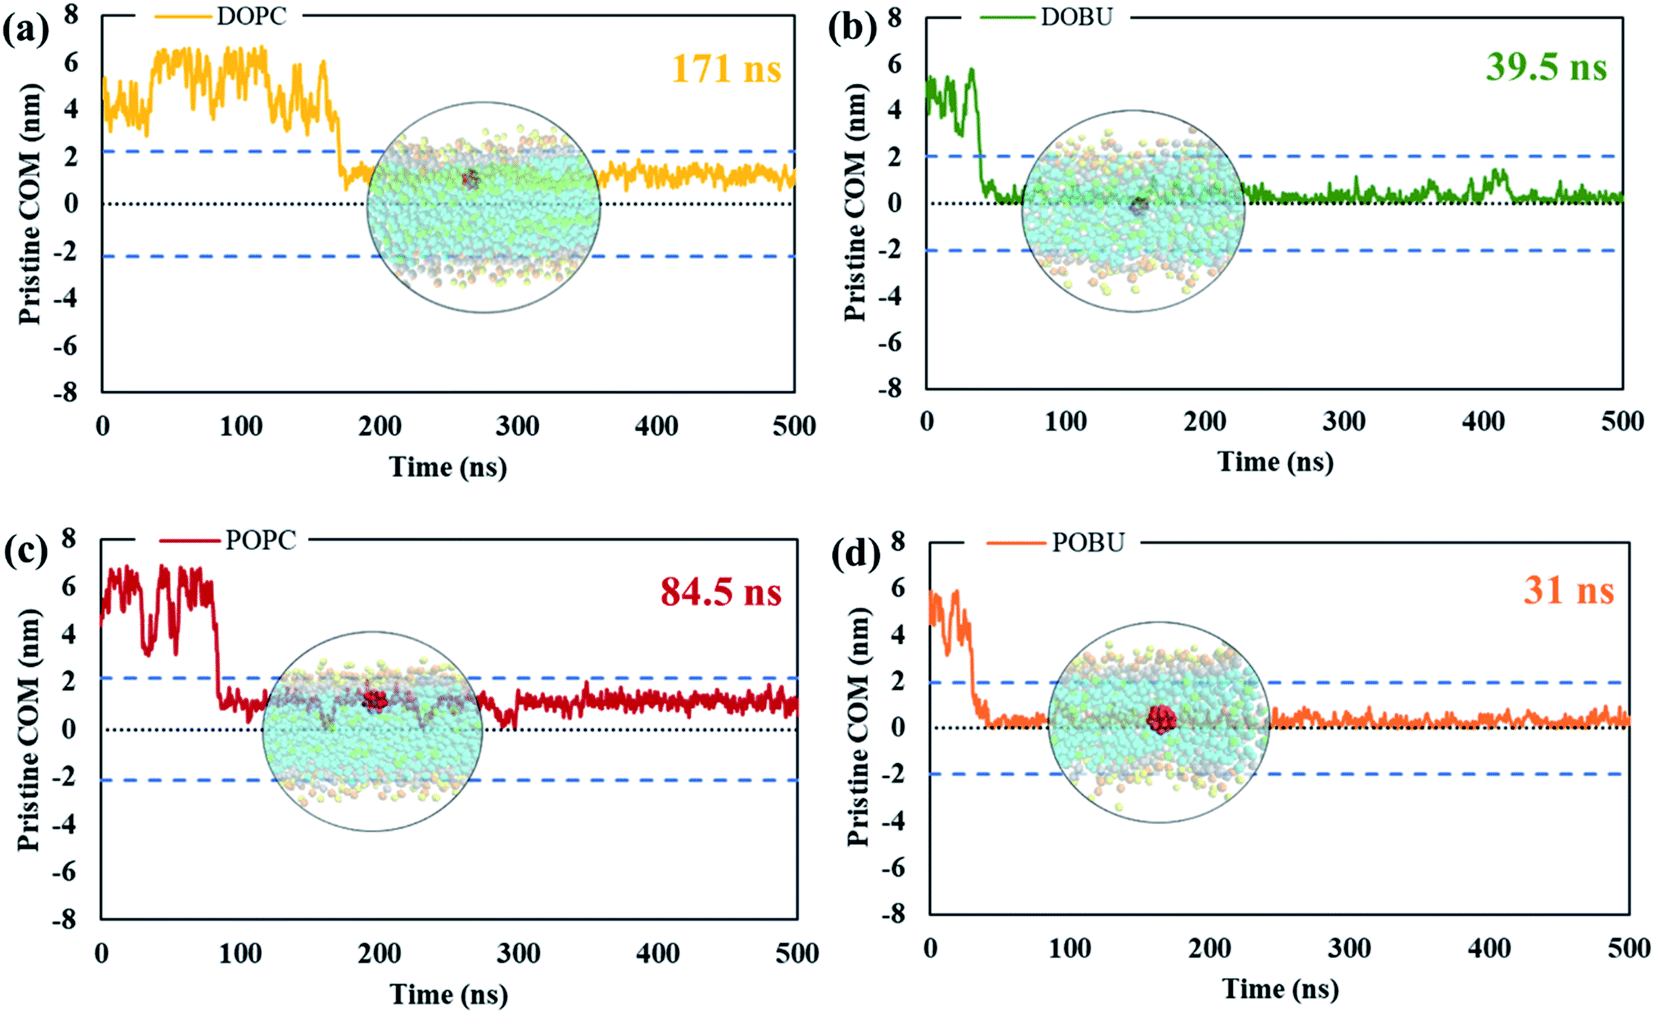 | ||
| Fig. 5 The absolute center-of-mass distance of pristine fullerene NP from (a) DOPC, (b) DOBU, (c) POPC and (d) POBU bilayers, respectively. The two dashed lines in blue denote the bilayer thickness in terms of the distance of PO4 beads between upper and lower leaflet in the corresponding bilayer. The center dashed line in black shows the center of the corresponding bilayer. The times on the upper right of the graphs represent the time fullerene spends in bulk water before entering the corresponding bilayer. The circular pictures demonstrate the average position of fullerene after entering the bilayer (taken from trajectories at 175 ns, 53 ns, 95 ns, and 44 ns for DOPC, DOBU, POPC and POBU bilayers). | ||
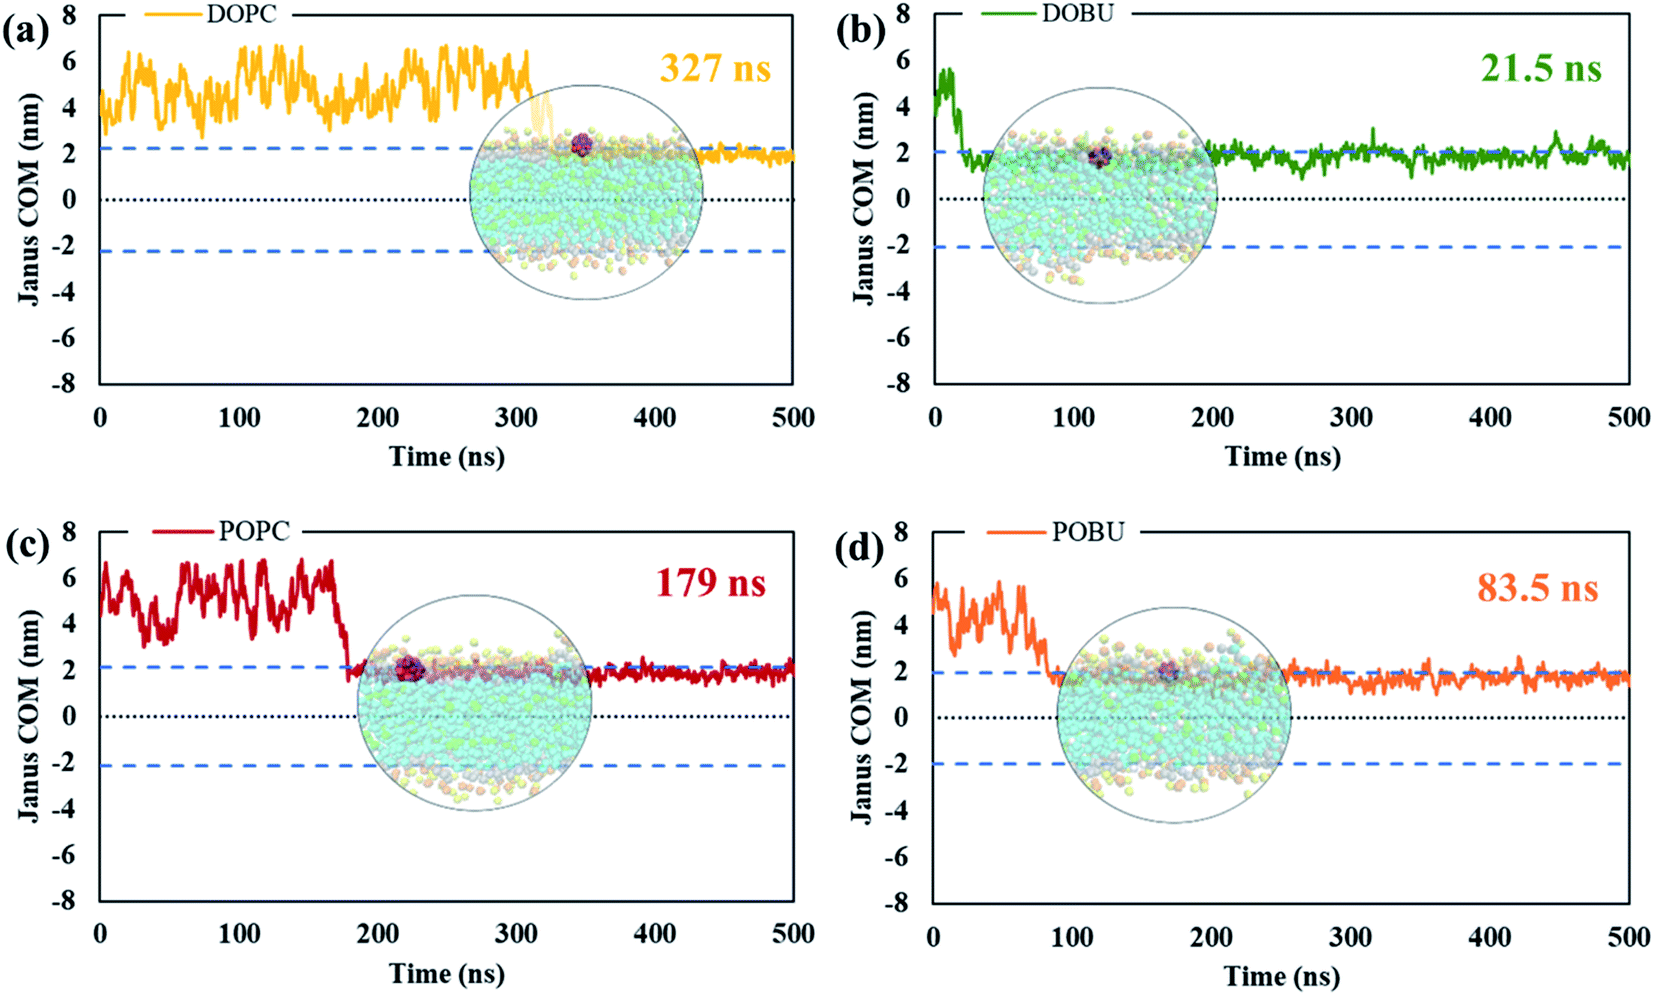 | ||
| Fig. 6 The absolute center-of-mass distance of Janus fullerene NP from (a) DOPC, (b) DOBU, (c) POPC and (d) POBU bilayers, respectively. The two dashed lines in blue denote the bilayer thickness in terms of the distance of PO4 beads between upper and lower leaflet in the corresponding bilayer. The center dashed line in black shows the center of the corresponding bilayer. The times on the upper right of the graphs represent the time fullerene spends in bulk water before entering the corresponding bilayer. The circular pictures demonstrate the average position of fullerene after entering the bilayer (taken from trajectories at 353 ns, 22 ns, 200 ns, and 105 ns for DOPC, DOBU, POPC and POBU bilayers). | ||
Fig. 7 shows the COM radial distribution functions (RDFs) of fullerene with respect to the membrane COM in the presence of 10 fullerenes. The single fullerene–membrane COM distributions are given in Fig. S4 in the ESI.† It has been observed that the interaction of one or 10 pristine fullerene molecules with the lipid membranes yield almost the same profiles. That is, the pristine fullerenes display random or near-random distributions with respect to the membranes, regardless of their concentration in the studied concentration range. On the other hand, a concentration-dependent ordering is observed with Janus fullerenes as demonstrated by the new peaks in RDF profiles.
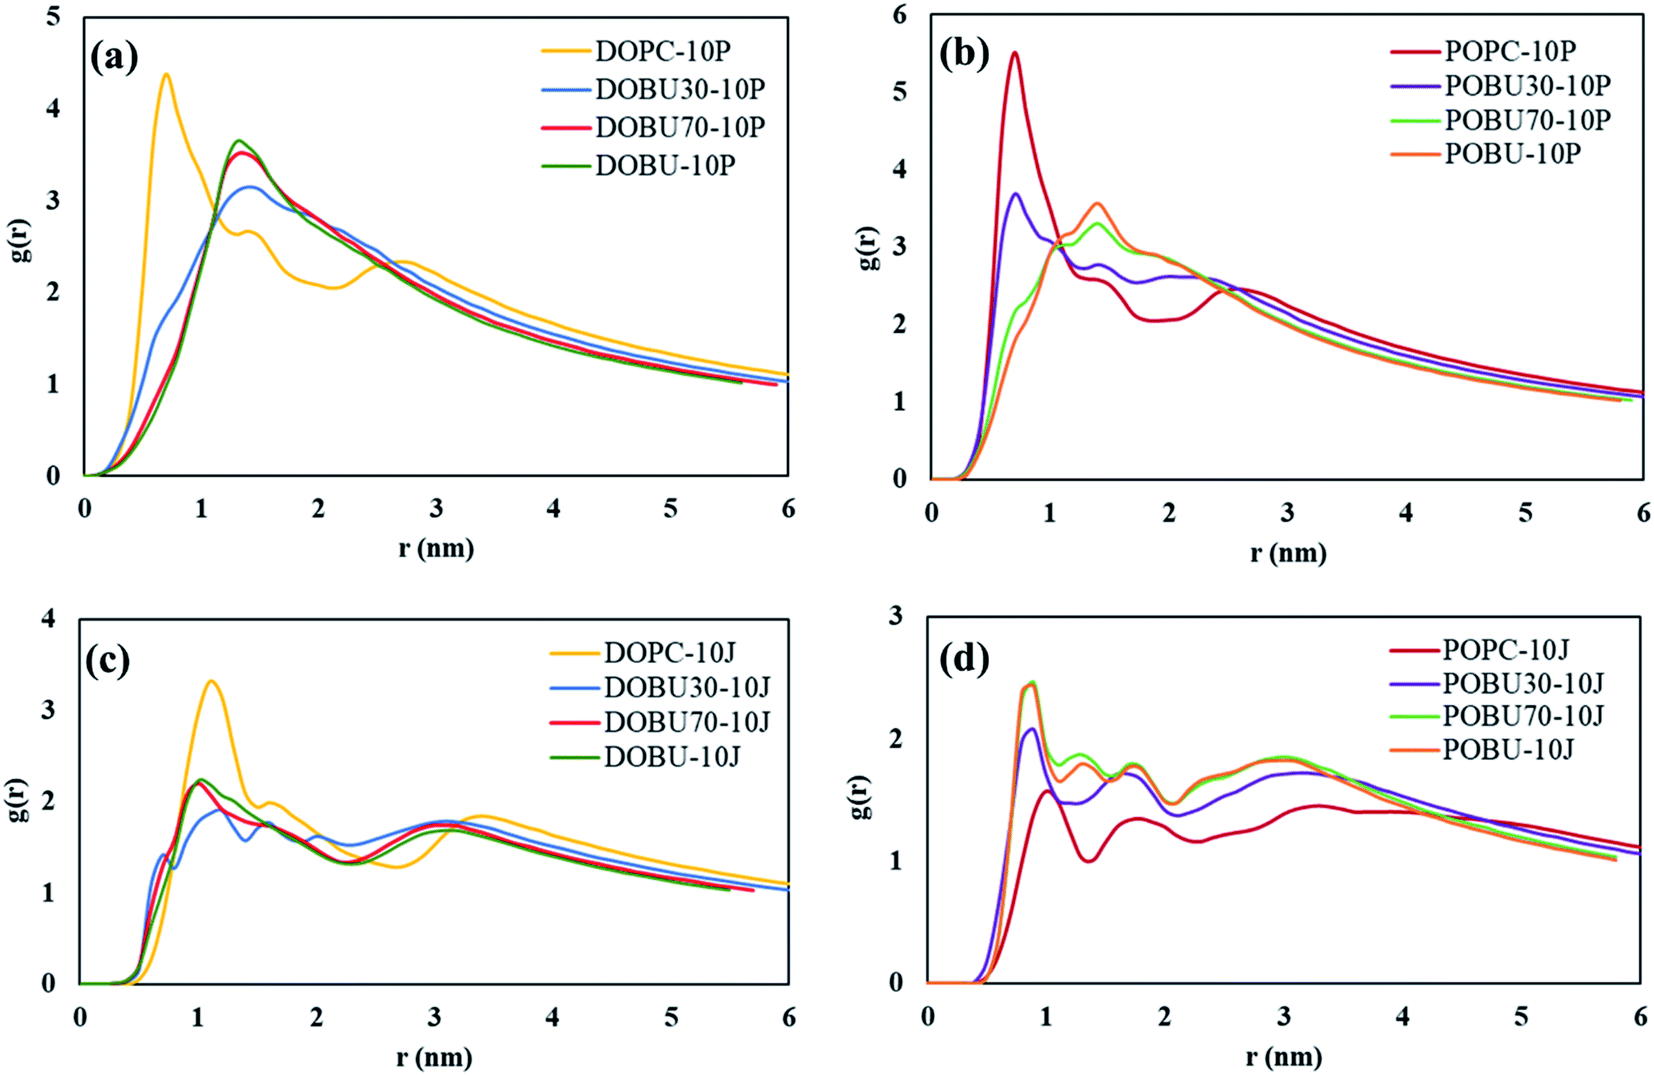 | ||
| Fig. 7 Membrane–fullerene COM radial distribution functions for (a, b) pristine fullerenes, (c, d) Janus fullerenes at fullerene-to-lipid ratio of F/L = 10/512. | ||
Fig. 7(a) and (b) also demonstrate that the radial distribution profiles of pristine fullerenes in regular DOPC and POPC bilayers have similar peak locations. However, the intensities are slightly higher in POPC bilayers suggesting stronger interactions with fullerene nanoparticles in POPC. Increasing the peroxidation level results in more random distributions with pristine fullerenes, where the profiles of 70% and 100% oxidized membranes are almost the same. With Janus fullerenes (cf. Fig. 7(c) and (d)), the ordering in POPC bilayers increases with increasing peroxidation level, while the opposite trend is observed in DOPC bilayers. This is attributed to the different aggregation behavior of Janus NPs in different bilayers (explained further below).
To further analyze the order and aggregation of fullerene molecules, fullerene–fullerene COM radial distribution profiles are presented in Fig. 8 and supported by trajectory snapshots given in Fig. 9 and S4.† The RDFs are found to be in reasonable agreement with previous studies.39,66 The relative distances of pristine fullerenes have been determined to be similar in all membrane types despite the variations in peak intensities. For example, the peak around 1.05 nm is observed to have higher intensity in peroxidized membranes particularly in DOBU30 and POBU70 than regular DOPC or POPC. The first shell around 1 nm represents the nearest neighbor distance. As we support with our simulations, pristine fullerenes are internalized into the DOPC and POPC membrane as single or in double-triple agglomerates, however, they penetrate DOBU30 membrane in agglomerates of 7 (cf. Fig. 9(a)). What is more, the first peak is also found to be very high indicating aggregation for Janus fullerenes, especially in POPC bilayers. This is confirmed by our trajectories where for all POPC and its oxidized forms, Janus fullerenes interact with the head region of lipid bilayers in aggregates of 7 to 9 molecules (cf. Fig. 9(b)). The second peak at 1.55 nm is attributed to the configuration when part of the lipid tail penetrates between two fullerenes.66 Another point worth mentioning is that an intermediate peak, which is not seen in pristine fullerene at the tested concentrations, occurs around 1.75 nm as the second highest peak in Janus fullerenes. Ding et al. suggested that when part of the second nearest shell is shared by more than two atoms, the peak is splitted.68 In the case of Janus particles, the cluster formations may be the reason for peak splitting in the second shell which results in an intermediate peak.
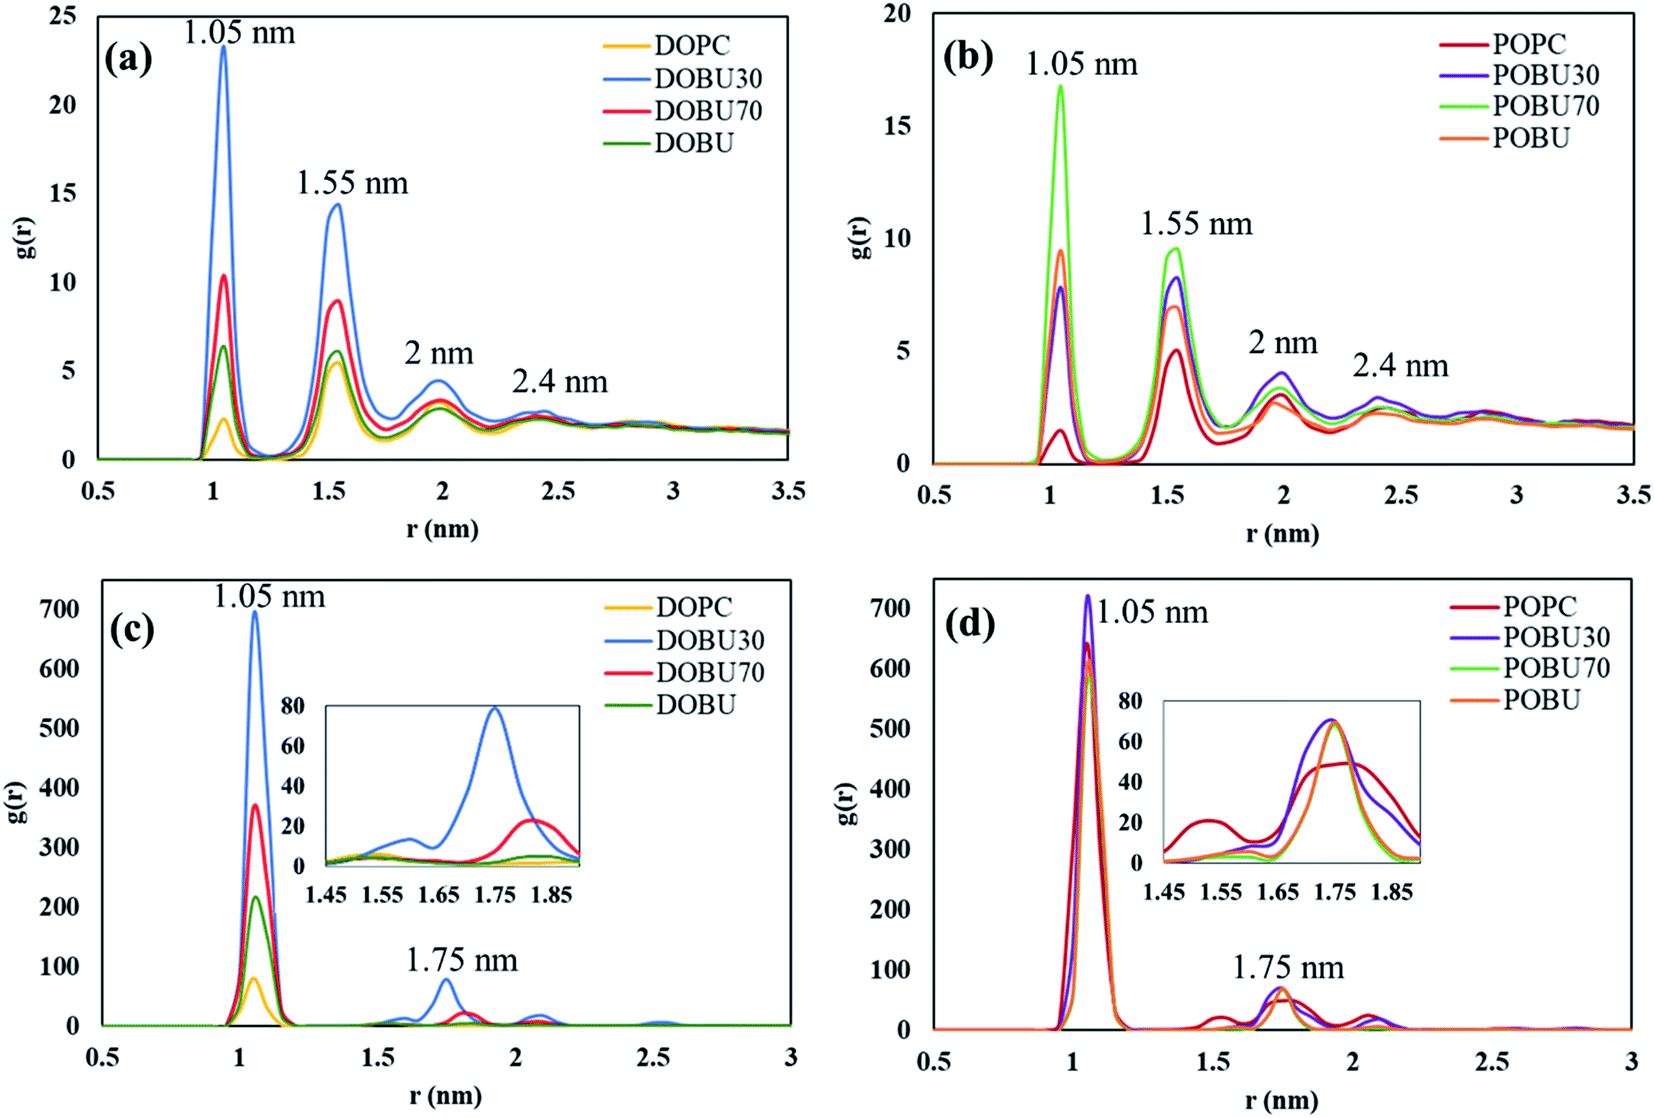 | ||
| Fig. 8 Fullerene–fullerene COM radial distribution functions for (a, b) pristine fullerenes, (c, d) Janus fullerenes (enlarged between 1.45–1.90 nm in insets) at fullerene-to-lipid ratio of F/L = 10/512. | ||
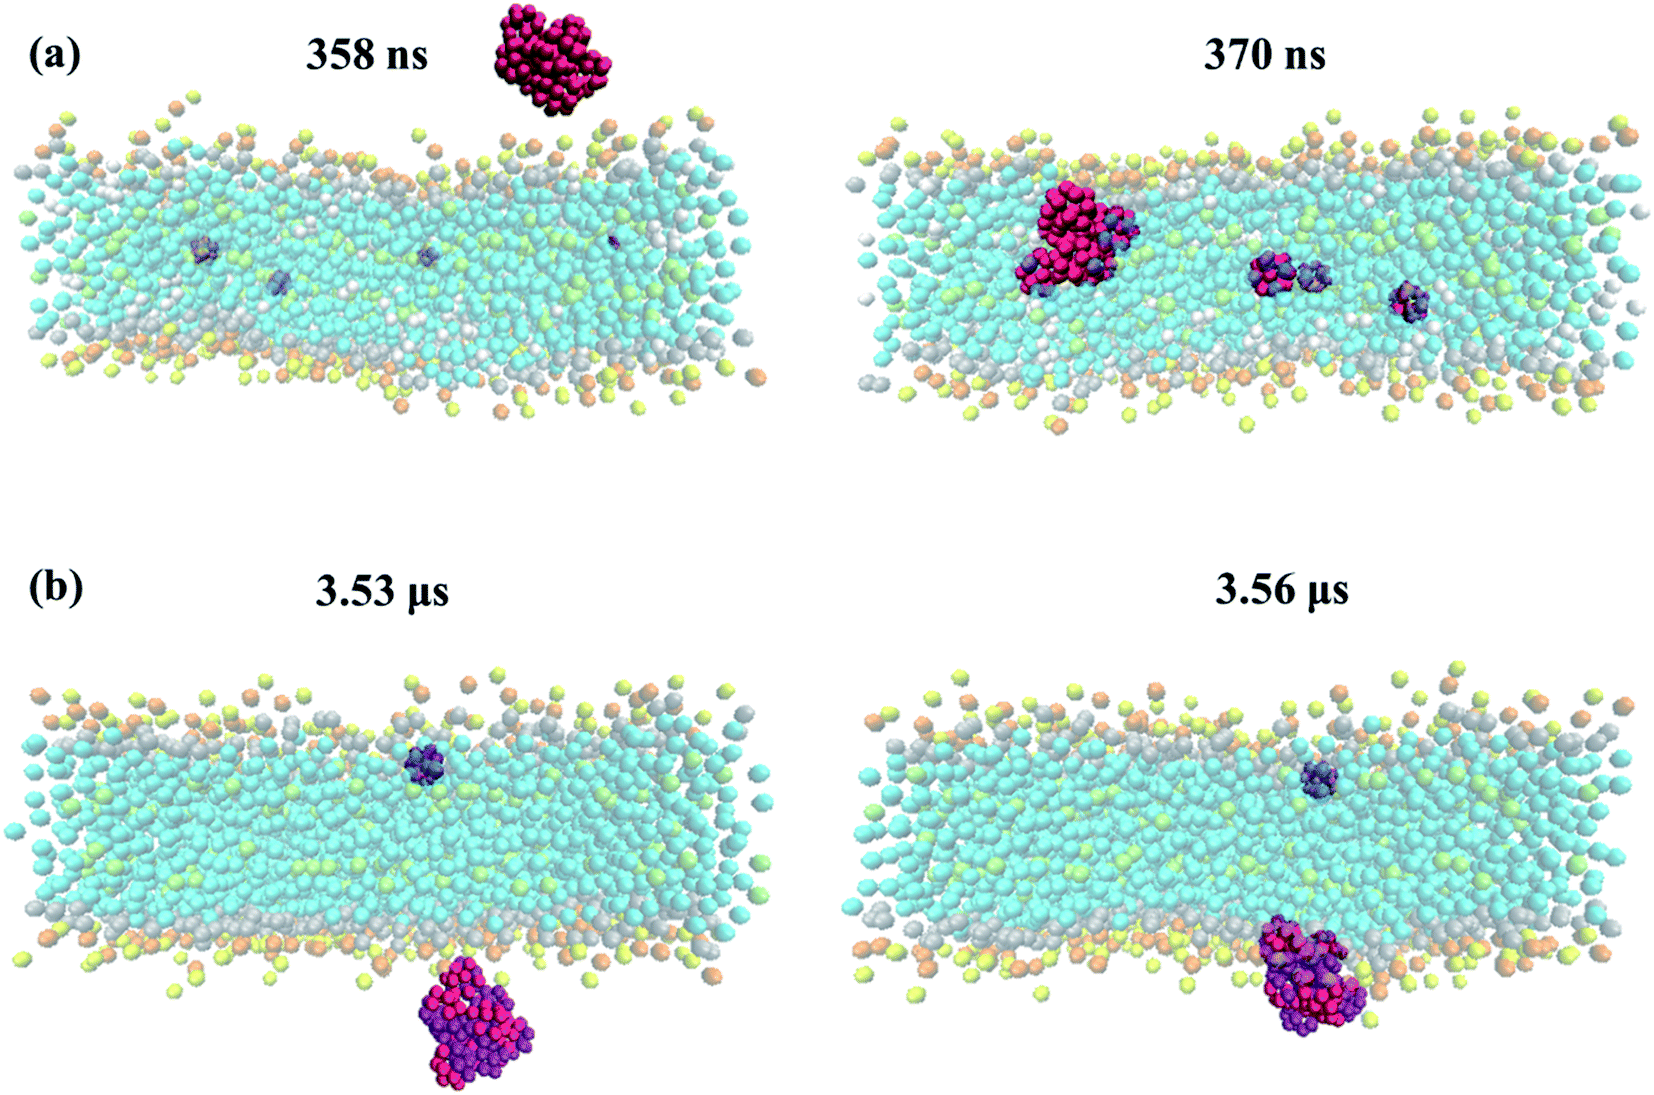 | ||
| Fig. 9 The aggregate of (a) pristine fullerene molecules interact with DOBU30 bilayer at 358 ns and 370 ns, (b) Janus fullerene molecules interact with POPC bilayer at 3.53 μs and 3.56 μs from side view. | ||
Conclusion
In the current work, the interaction of pristine and Janus fullerenes with regular DOPC, POPC, and their different peroxidized analogs DOBU and POBU were examined through coarse-grained MARTINI simulations. The penetration of pristine fullerenes in monomeric or oligomeric forms occurred easily at nano time scale. After penetration inside the bilayers, the fullerene clusters disintegrated. The residence time in the aqueous phase increased with increasing polarity of the NP (in the case of Janus NPs) since interactions with water molecules increased. The translocation behavior of fullerenes was found to be directed to the hydrophobic region of the bilayer for pristine NPs and towards the head groups for Janus NPs. In DOPC bilayer, pristine fullerenes located near glycerol groups while they prefer to be around the center of the membrane in oxidized forms of DOPC. At low peroxidation of POPC (30%), pristine fullerenes mimicked the translocation behavior in regular POPC by traversing the linker groups and at high peroxidation (70%), they reside in the membrane center as in fully oxidized POPC bilayers. These two characteristics of pristine fullerenes were attributed to the difference in lipid saturation levels of DOPC and POPC. Regardless of peroxidation, the polar hemisphere in Janus NPs was observed facing water molecules while the hydrophobic hemisphere interacting with the membrane head groups. At different fullerene to lipid ratio (1/512 and 10/512), the radial distributions of pristine fullerenes with respect to the membranes were observed to be similar and near randomly distributed while Janus fullerenes were prone to aggregation at high concentration. On the other hand, we did not encounter an adverse effect on the structural properties of the membranes (e.g. pore formation, membrane damage) at the concentration levels tested. In summary, we did not detect physical membrane disruption or rupture during any of the model simulations and lipid peroxidation is not addressed as the toxic response of fullerenes in terms of membrane damage. For drug delivery platforms, we claim that pristine fullerenes have significant potential to be used as drug carrier agents, and lipid saturation level and the degree of membrane peroxidation, as well as fullerene concentration, are of great importance in safe and controlled drug delivery systems. We also believe that our conclusions can shed light on the development and analysis of more complex systems and our membrane models can create a basis for future studies on the ROS-induced BBB impairment.Conflicts of interest
The authors declare no competing financial interest.Acknowledgements
Computations were performed at TUBITAK ULAKBIM, High Performance and Grid Computing Center (TRUBA resources).References
- H. W. Kroto, A. W. Allaf and S. P. Balm, Chem. Rev., 1991, 91, 1213–1235 CrossRef CAS.
- S. Collavini and J. L. Delgado, Sustainable Energy Fuels, 2018, 2, 2480–2493 RSC.
- J. Zhang, M. Terrones, C. R. Park, R. Mukherjee, M. Monthioux, N. Koratkar, Y. S. Kim, R. Hurt, E. Frackowiak, T. Enoki, Y. Chen, Y. Chen and A. Bianco, Carbon, 2016, 98, 708–732 CrossRef CAS.
- D. Gust, T. A. Moore and A. L. Moore, Acc. Chem. Res., 2001, 34, 40–48 CrossRef CAS.
- N. Panwar, A. M. Soehartono, K. K. Chan, S. Zeng, G. Xu, J. Qu, P. Coquet, K. T. Yong and X. Chen, Chem. Rev., 2019, 119, 9559–9656 CrossRef CAS.
- N. Gharbi, M. Pressac, M. Hadchouel, H. Szwarc, S. R. Wilson and F. Moussa, Nano Lett., 2005, 5, 2578–2585 CrossRef CAS.
- Y. S. Youn, D. S. Kwag and E. S. Lee, J. Pharm. Invest., 2017, 47, 1–10 CrossRef CAS.
- N. Shinohara, Environmental Impact of Fullerenes, 2012 Search PubMed.
- Y. Lahir, Clin. Immunol., Endocr. Metab. Drugs, 2017, 4(1), 47–58 CAS.
- R. G. Alargova, S. Deguchi and K. Tsujii, J. Am. Chem. Soc., 2001, 123, 10460–10467 CrossRef CAS.
- J. D. Fortner, D. Y. Lyon, C. M. Sayes, A. M. Boyd, J. C. Falkner, E. M. Hotze, L. B. Alemany, Y. J. Tao, W. Guo, K. D. Ausman, V. L. Colvin and J. B. Hughes, Environ. Sci. Technol., 2005, 39, 4307–4316 CrossRef CAS.
- D. Y. Lyon, L. K. Adams, J. C. Falkner and P. J. J. Alvarez, Environ. Sci. Technol., 2006, 40, 4360–4366 CrossRef CAS.
- A. Dellinger, Z. Zhou, J. Connor, A. Madhankumar, S. Pamujula, C. M. Sayes and C. L. Kepley, Nanomedicine, 2013, 8, 1191–1208 CrossRef CAS.
- Z. P. Xu, Q. H. Zeng, G. Q. Lu and A. B. Yu, Chem. Eng. Sci., 2006, 61, 1027–1040 CrossRef CAS.
- R. Bakry, R. M. Vallant, M. Najam-ul-Haq, M. Rainer, Z. Szabo, C. W. Huck and G. K. Bonn, Int. J. Nanomed., 2007, 2, 639–649 CAS.
- S. Goodarzi, T. Da Ros, J. Conde, F. Sefat and M. Mozafari, Mater. Today, 2017, 20, 460–480 CrossRef CAS.
- A. Chaurasia, N. G. Sahoo, J. T. McLeskey and X. Hu, J. Spectrosc., 2015, 2015, 578160 Search PubMed.
- F. Y. Hsieh, A. V. Zhilenkov, I. I. Voronov, E. A. Khakina, D. V. Mischenko, P. A. Troshin and S. H. Hsu, ACS Appl. Mater. Interfaces, 2017, 9, 11482–11492 CrossRef CAS.
- Â. B. Kraemer, G. M. Parfitt, D. da S. Acosta, G. E. Bruch, M. F. Cordeiro, L. F. Marins, J. Ventura-Lima, J. M. Monserrat and D. M. Barros, Toxicol. Appl. Pharmacol., 2018, 338, 197–203 CrossRef.
- A. M. Enciu, M. Gherghiceanu and B. O. Popescu, Oxid. Med. Cell. Longevity, 2013, 2013, 297512 Search PubMed.
- N. Q. Thai, P. E. Theodorakis and M. S. Li, J. Chem. Inf. Model., 2020, 60, 3057–3067 CrossRef CAS.
- V. H. Man, M. S. Li, P. Derreumaux, J. Wang, T. T. Nguyen, S. Nangia and P. H. Nguyen, J. Chem. Phys., 2020, 153, 045104 CrossRef CAS.
- C. M. Sayes, J. D. Fortner, W. Guo, D. Lyon, A. M. Boyd, K. D. Ausman, Y. J. Tao, B. Sitharaman, L. J. Wilson, J. B. Hughes, J. L. West and V. L. Colvin, Nano Lett., 2004, 4, 1881–1887 CrossRef CAS.
- A. Trpkovic, B. Todorovic-Markovic and V. Trajkovic, Arch. Toxicol., 2012, 86, 1809–1827 CrossRef CAS.
- J. P. Kamat, T. P. A. Devasagayam, K. I. Priyadarsini and H. Mohan, Toxicology, 2000, 155, 55–61 CrossRef CAS.
- E. Oberdörster, Environ. Health Perspect., 2004, 112, 1058–1062 CrossRef.
- C. M. Sayes, A. M. Gobin, K. D. Ausman, J. Mendez, J. L. West and V. L. Colvin, Biomaterials, 2005, 26, 7587–7595 CrossRef CAS.
- H. J. Johnston, G. R. Hutchison, F. M. Christensen, K. Aschberger and V. Stone, Toxicol. Sci., 2009, 114, 162–182 CrossRef.
- I. C. Wang, L. A. Tai, D. D. Lee, P. P. Kanakamma, C. K. F. Shen, T. Y. Luh, C. H. Cheng and K. C. Hwang, J. Med. Chem., 1999, 42, 4614–4620 CrossRef CAS.
- J. Zupanc, D. Drobne, B. Drasler, J. Valant, A. Iglic, V. Kralj-Iglic, D. Makovec, M. Rappolt, B. Sartori and K. Kogej, Carbon, 2012, 50, 1170–1178 CrossRef CAS.
- S. J. Marrink, A. H. De Vries and A. E. Mark, J. Phys. Chem. B, 2004, 108, 750–760 CrossRef CAS.
- S. J. Marrink, H. J. Risselada, S. Yefimov, D. P. Tieleman and A. H. De Vries, J. Phys. Chem. B, 2007, 111, 7812–7824 CrossRef CAS.
- R. Qiao, A. P. Roberts, A. S. Mount, S. J. Klaine and P. C. Ke, Nano Lett., 2007, 7, 614–619 CrossRef CAS.
- N. Choudhury, J. Chem. Phys., 2006, 125, 034502 CrossRef.
- W. Li, H. Davande, D. Bedrov and G. D. Smith, J. Phys. Chem. B, 2007, 111, 4067–4072 CrossRef.
- J. Sastre, I. Mannelli and R. Reigada, Biochim. Biophys. Acta, Gen. Subj., 2017, 1861, 2872–2882 CrossRef CAS.
- J. Wong-Ekkabut, S. Baoukina, W. Triampo, I. M. Tang, D. P. Tieleman and L. Monticelli, Nat. Nanotechnol., 2008, 3, 363–368 CrossRef CAS.
- L.-q. Xie, Y.-z. Liu, Z.-h. Xi, H.-y. Li, S.-d. Liang and K.-l. Zhu, Mol. Simul., 2017, 43, 1532–1538 CrossRef CAS.
- P. Nalakarn, P. Boonnoy, N. Nisoh, M. Karttunen and J. Wong-Ekkabut, Sci. Rep., 2019, 9, 1–11 CrossRef CAS.
- H. J. C. Berendsen, D. van der Spoel and R. van Drunen, Comput. Phys. Commun., 1995, 91, 43–56 CrossRef CAS.
- T. A. Wassenaar, H. I. Ingólfsson, R. A. Böckmann, D. P. Tieleman and S. J. Marrink, J. Chem. Theory Comput., 2015, 11, 2144–2155 CrossRef CAS.
- Y. Guo, V. A. Baulin and F. Thalmann, Soft Matter, 2015, 12, 263–271 RSC.
- L. Monticelli, J. Chem. Theory Comput., 2012, 8, 1370–1378 CrossRef CAS.
- A. Sridhar, B. Srikanth, A. Kumar and A. K. Dasmahapatra, J. Chem. Phys., 2015, 143, 024907 CrossRef.
- H. J. C. Berendsen, J. P. M. Postma, W. F. Van Gunsteren, A. Dinola and J. R. Haak, J. Chem. Phys., 1984, 81, 3684–3690 CrossRef CAS.
- G. Bussi, D. Donadio and M. Parrinello, J. Chem. Phys., 2007, 126, 014101 CrossRef.
- M. Parrinello and A. Rahman, J. Appl. Phys., 1981, 52, 7182–7190 CrossRef CAS.
- D. H. De Jong, S. Baoukina, H. I. Ingólfsson and S. J. Marrink, Comput. Phys. Commun., 2016, 199, 1–7 CrossRef CAS.
- D. Van Der Spoel and P. J. Van Maaren, J. Chem. Theory Comput., 2006, 2, 1–11 CrossRef CAS.
- I. G. Tironi, R. Sperb, P. E. Smith and W. F. Van Gunsteren, J. Chem. Phys., 1995, 102, 5451–5459 CrossRef CAS.
- W. Humphrey, A. Dalke and K. Schulten, J. Mol. Graphics, 1996, 14, 33–38 CrossRef CAS.
- N. Ileri Ercan, J. Chem. Inf. Model., 2019, 59, 4413–4426 CrossRef CAS.
- G. M. Torrie and J. P. Valleau, J. Comput. Phys., 1977, 23, 187 CrossRef.
- S. Kumar, J. M. Rosenberg, D. Bouzida, R. H. Swendsen and P. A. Kollman, J. Comput. Chem., 1992, 13, 1011–1021 CrossRef CAS.
- J. S. Hub, B. L. De Groot and D. Van Der Spoel, J. Chem. Theory Comput., 2010, 6, 3713–3720 CrossRef CAS.
- N. Kučerka, J. F. Nagle, J. N. Sachs, S. E. Feller, J. Pencer, A. Jackson and J. Katsaras, Biophys. J., 2008, 95, 2356–2367 CrossRef.
- J. Pan, S. Tristram-Nagle, N. Kučerka and J. F. Nagle, Biophys. J., 2008, 94, 117–124 CrossRef CAS.
- S. Tristram-Nagle, H. I. Petrache and J. F. Nagle, Biophys. J., 1998, 75, 917–925 CrossRef CAS.
- N. Kučerka, S. Tristram-Nagle and J. F. Nagle, J. Membr. Biol., 2006, 208, 193–202 CrossRef.
- N. Kučerka, M. P. Nieh and J. Katsaras, Biochim. Biophys. Acta, Biomembr., 2011, 1808, 2761–2771 CrossRef.
- G. Shahane, W. Ding, M. Palaiokostas and M. Orsi, J. Mol. Model., 2019, 25, 1–13 CrossRef.
- K. Pluhackova, S. A. Kirsch, J. Han, L. Sun, Z. Jiang, T. Unruh and R. A. Böckmann, J. Phys. Chem. B, 2016, 120, 3888–3903 CrossRef CAS.
- J. B. Klauda, R. M. Venable, J. A. Freites, J. W. O'Connor, D. J. Tobias, C. Mondragon-Ramirez, I. Vorobyov, A. D. MacKerell and R. W. Pastor, J. Phys. Chem. B, 2010, 114, 7830–7843 CrossRef CAS.
- G. Weber, T. Charitat, M. S. Baptista, A. F. Uchoa, C. Pavani, H. C. Junqueira, Y. Guo, V. A. Baulin, R. Itri, C. M. Marques and A. P. Schroder, Soft Matter, 2014, 10, 4241–4247 RSC.
- A. Filippov, G. Orädd and G. Lindblom, Langmuir, 2003, 19, 6397–6400 CrossRef CAS.
- N. Nisoh, V. Jarerattanachat, M. Karttunen and J. Wong-ekkabut, Biochim. Biophys. Acta, Biomembr., 2020, 1862, 183328 CrossRef CAS.
- R. S. G. D’Rozario, C. L. Wee, E. Jayne Wallace and M. S. P. Sansom, Nanotechnology, 2009, 20, 115102 CrossRef.
- J. Ding, E. Ma, M. Asta and R. O. Ritchie, Sci. Rep., 2015, 5, 1–25 Search PubMed.
Footnote |
| † Electronic supplementary information (ESI) available. See DOI: 10.1039/d1ra00272d |
| This journal is © The Royal Society of Chemistry 2021 |