 Open Access Article
Are bacteria claustrophobic? The problem of micrometric spatial confinement for the culturing of micro-organisms†
Céline Molinaro*a,
Violette Da Cunhab,
Aurore Gorlas b,
François Iva,
Laurent Gallais
 a,
Ryan Catchpoleb,
Patrick Forterreb and
Guillaume Baffou
 *a
*a
aInstitut Fresnel, CNRS, Aix Marseille University, Centrale Marseille, Marseille, France. E-mail: celine.molinaro@fresnel.fr; guillaume.baffou@fresnel.fr
bUniversité Paris-Saclay, CEA, CNRS, Institute for Integrative Biology of the Cell (I2BC), 91198, Gif-sur-Yvette, France
First published on 30th March 2021
Abstract
Culturing cells confined in microscale geometries has been reported in many studies this last decade, in particular following the development of microfluidic-based applications and lab-on-a-chip devices. Such studies usually examine growth of Escherichia coli. In this article, we show that E. coli may be a poor model and that spatial confinement can severely prevent the growth of many micro-organisms. By studying different bacteria and confinement geometries, we determine that the growth inhibition observed for some bacteria results from fast dioxygen depletion, inherent to spatial confinement, and not to any depletion of nutriments. This article unravels the physical origin of confinement problems in cell culture, highlighting the importance of oxygen depletion, and paves the way for the effective culturing of bacteria in confined geometries by demonstrating enhanced cell growth in confined geometries in the proximity of air bubbles.
Introduction
The efficiency of cell culturing in vitro not only depends on the selection of a proper culture medium and its chemical properties, but also depends upon physical parameters, such as temperature, surface composition (coating, electrical charge, …), and pressure. All these parameters have been widely investigated, well understood and generally well controlled experimentally. However, a physical parameter that has been less well-considered is spatial confinement. For some experimental methodologies, living cells need to be spatially confined over micrometre scales, such as sandwiched between two coverslips, passing through constrictions, or incorporated within a microfluidic channel.1,2 Microfluidic devices in particular have been increasingly used this past decade to study micro-organisms and address several biological questions, from the growth and motility of bacteria, to chemotaxis, and cellular interactions.3,4 Additionally, microfluidics have enabled the observation of biofilm formation,5 conjugation between strains,6 and new insights into bacteria-mediated cancer therapies.7 A valuable feature of microfluidic devices is the possibility to create local chemical gradients, facilitating studies of bacterial chemotaxis.8 Furthermore, spatial constrictions like micropores can enable the selective passage of bacteria, or the observation of their behaviour within a maze.9,10 Very thin, elongated constrictions can also be used to spatially organize bacteria over the field of view of a microscope and achieve easy statistical characterization of a large number of cells.11It is notable that most of these studies utilizing spatial confinements were carried out with Escherichia coli bacteria as a model species, which is indeed recognized as suited for culture in confined geometries. For instance, the growth rate of E. coli was shown to be equivalent in micron-sized channels and in suspension,12 with a no-growth threshold around 0.5 μm.13 Männik et al.14 compared the growth and motility of E. coli (Gram-negative) and Bacillus subtilis (Gram-positive) in microfabricated channels, showing that E. coli can grow in narrower channels than B. subtilis thanks to its thin Gram-negative cell wall. Only a handful of other prokaryotic species have been investigated in similar confinements. For instance, Halobacterium salinarum, an archaeon, can grow in 1.3 μm high and 10 μm long cavities, albeit with a generation time three times longer than in suspension.15 We speculate that the predominance of E. coli-based literature involving microfluidic channels may come from the inability of many micro-organisms to grow in reduced spaces, though this is not stated in the literature.
In this article, we evidence the inability of different bacteria to grow in confined geometries and unravel the origin of this growth inhibition. We show that Escherichia coli and Lactobacillus reuteri can easily divide in confined geometries (<20 μm), while Thermus thermophilus and Geobacillus stearothermophilus are unable to grow below a spatial confinement of around 300 μm. The results indicate that this claustrophobic behaviour results from depletion of dioxygen in small volumes, not from nutriment deficiencies, as confinement only affected the growth of aerobic bacteria. This hypothesis is further supported by the ability of the aerobic bacteria to grow in confined geometries, provided an air bubble is present nearby. A last section provides numerical simulations confirming the strong reduction of bacterial growth and oxygen depletion with the geometry used in this study.
Results and discussion
During microscopic culturing experiments, we noted a striking inhibition of growth of several bacterial species when deposited between glass coverslips, typically separated by <100 μm. To demonstrate the issue and uncover its causal origin, we conducted experiments on 4 species of bacteria (listed in Table 1) in 3 geometries. These bacteria were selected for their short generation time (<45 min) and for their oxygen requirement. The 3 types of geometries correspond to the three following sections.| Bacterial species | Metabolic description | Generation time | Gram stain |
|---|---|---|---|
| Escherichia coli | Facultative anaerobe | 15–20 min | Gram-negative |
| Lactobacillus reuteri | Facultative anaerobe | ∼45 min | Gram-positive |
| Thermus thermophilus | Strictly aerobe | 20 min | Gram-negative |
| Geobacillus stearothermophilus | Strictly aerobe | 25 min | Gram-positive |
Growing bacteria in <20 μm thin layer
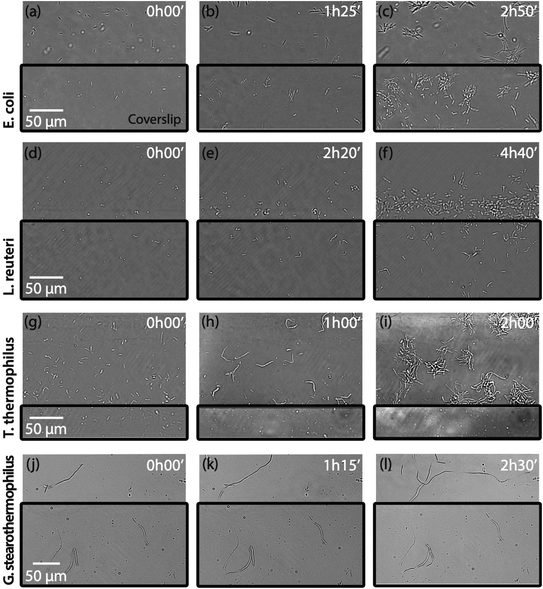
We first demonstrate the ability/inability of bacteria to grow in confined geometries. Bacterial species depicted in Table 1 were cultured separately, sandwiched between two coverslips, in a 20 μm thick liquid medium. The top coverslip was cut to be smaller than the bottom one, so that only part of each culture was covered. As such, some bacteria of a given culture were spatially confined, while others were not. Videos were acquired over several hours at the edge of the coverslip, to capture both confined and unconfined bacteria within a single field of view of the microscope (Fig. 1).Under these conditions, E. coli grew normally both under the coverslip and in open space with a similar generation time (see Movie Ecoli.mov in ESI,† from which images in Fig. 1a–c have been extracted). This result is consistent with the many effective studies reported on E. coli bacteria in confined geometries11–13 (as discussed in above). We reproduced the same experiments with L. reuteri (Fig. 1d and f), which also displayed growth both under the coverslip or in open space with a similar generation time (see Movie LactobacillusR.mov in ESI†). In contrast, results obtained with the aerobic bacteria G. stearothermophilus (Fig. 1g and i) revealed a completely different behaviour (see Movie GeobacillusS.mov in ESI†). Substantial growth was observed on the open side, with complete growth inhibition in the 20 μm thick medium layer. Furthermore, spatially confined G. stearothermophilus adopt a spherical geometry reminiscent of sporulation. T. thermophilus, another strictly aerobe, exhibited the same behaviour: the total inability to grow in confined geometry (Fig. 1j and l). T. thermophilus grows as long filaments observable in the uncovered portion of the cultured slides (Fig. 1k and l). In contrast, similar filamentous cells do not develop when covered (see the associated Movie Thermus-T.mov in ESI†).
Claustrophobic behaviour as a function of the media layer thickness
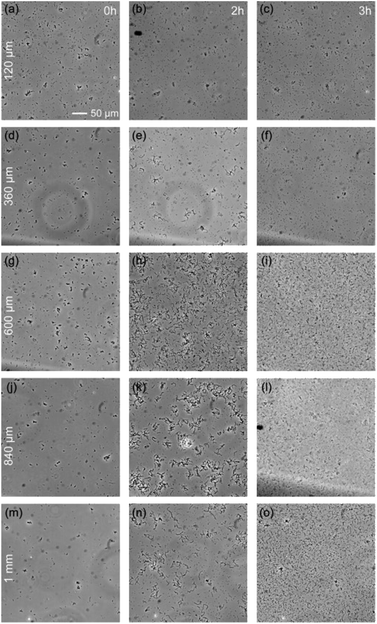
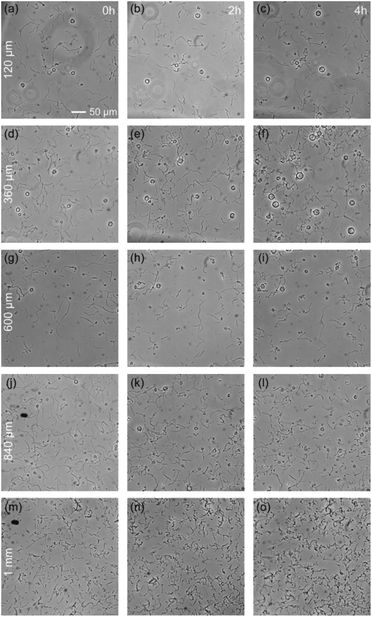
The previous section demonstrates the inability of some bacteria species, G. stearothermophilus and T. thermophilus, to grow in a 20 μm thick medium, while they can grow in open medium. The natural question is to determine the maximum degree of spatial confinement to which this problem persists. For the two species of bacteria that suffer when confined, G. stearothermophilus and T. thermophilus, samples were prepared with liquid thicknesses of 120 μm, 360 μm, 600 μm, 840 μm and 1 mm (by stacking 120 μm spacers, see Methods section). Each sample contained the initial same amount of bacteria (equal optical density (OD) and solution volume).The results obtained with G. stearothermophilus are displayed in Fig. 2. Similar to that observed above (Fig. 1h and i), a sporulation-like phenotype was observed after 2 h of incubation at 120 μm and 360 μm liquid thickness. Sporulation typically indicates unfavourable growth conditions, suggesting spatial confinement is poorly tolerated by this species. In contrast, above 360 μm effective growth was observed at both 2 h and 3 h. A similar behaviour was observed for T. thermophilus, that is no growth below 360 μm of medium thickness, and effective growth at 360 μm and above (Fig. 3). T. thermophilus bacteria required more time to demonstrate effective growth, around 4 h of incubation. In both cases, thicker liquid medium facilitated faster growth of bacterial cells.
Growth close to air bubbles despite of confinement
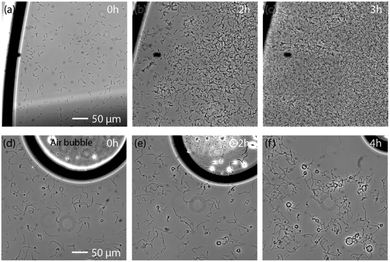
We demonstrated above that only the two facultative anaerobes we studied could blossom in confined environments. These results suggest growth inhibition may be caused by a lack of dioxygen in confined environments. Beyond oxygen depletion, other explanations of the growth inhibition in confined geometries could have been a rapid depletion of a nutriment present in the medium due to consumption by the cells, an accumulation of inhibitory waste compounds, or a depletion of nutriments due to electrostatic affinity with the naturally negatively charged glass surface. However, none of these mechanisms would be consistent with an active growth close to air bubbles. Gas bubbles can only affect the nearby gas content of the liquid. The hypothesis of oxygen depletion was confirmed here by the observation that effective growth of G. stearothermophilus and T. thermophilus was possible in the presence of nearby trapped air bubbles, despite confinement in 120 μm thick culture medium (Fig. 4a and f). By underfilling the sample well, an air/medium interface can be trapped within the coverslip-confined region and observed within the microscope field. The presence of this interface allowed growth of G. stearothermophilus in the vicinity, and even several 100 μm away. Despite the 120 μm thick culture medium, this growth was even faster than the growth observed in the 1 mm confinement tests (Fig. 4a and c vs. Fig. 2m and 2o). Additionally, the sporulation-like phenotype was absent close to the air layer (Fig. 4b vs. Fig. 1i).Similar behaviour was observed with T. thermophilus in a 120 μm thick culture medium, this time illustrated with a trapped air bubble (Fig. 4d–f). Here again, effective bacterial growth is observed in the proximity of the air bubble. Additionally, over the course of 4 h, the bubble reduced in size, consistent with oxygen consumption by the bacteria. For both experiments, images were recorded from the same sample but away from the air layer or bubble. No growth was observed for both types of bacteria anywhere else in the sample (Fig. S2 and S3†).
Air layers or bubbles behave as constant, long sources of dioxygen, allowing continued diffusion from the gas to the liquid. Gas content is the only medium property expected to vary at the vicinity of an air interface, which confirms the hypothesis of dioxygen depletion, and/or carbon dioxide increase, as the origin of the deleterious effect and apparent claustrophobic behaviour of aerobic bacteria: bacteria are actually suffocating in confined geometries.
Estimation of oxygen consumption in confined geometries
As a further support of the suffocation mechanism, we determine here the time needed for the bacteria to consume the dioxygen contained in the confined volume in which they are living.We first consider the case of a spatial confinement in a SecureSeal spacer (h = 120 μm in thickness, and S = π4.52 mm2 in area), for which the oxygen consumption can be simply estimated without numerical simulations. To the best of our knowledge, no measurement of dioxygen consumption of G. stearothermophilus or T. thermophilus have been reported in the literature. Typical values of dioxygen molecule consumption rate per bacteria Q0 found in the literature for other bacteria,16,17 including E. coli, lie in the range of Q0 = 3 × 10⁻¹⁹ to 3 × 10⁻¹⁸ mol per second per cell, representing a consumption of 2 × 10⁵ to 2 × 10⁶ molecules per second per cell. In the experiment reported above, for the case of a 120 μm spacer, we used V = 7 μL of bacterial suspension, with an OD of 0.08 corresponding to nb = 2 × 10⁸ cell per mL, leading to a cell areal density of σb = nbh = 2.4 × 10¹⁰ cell per m2 on the bottom coverslip. In 7 μL of water at 25 °C, with ρO2 = 8.28 mg L−1 of dissolved dioxygen, there is n0 = 1.8 × 10⁻⁹ moles of O2. All the dissolved dioxygen is to be consumed over a time scale τ = ρO2h/Q0MO2σb, where MO2 is the molar mass of O2. Giving the typical range of O2 consumption rate Q0 given above, it yields a time scale τ ranging from 6 minutes to 1 hour. This range means that after a few minutes or tens of minutes, the oxygen content of the sample should be significantly reduced, hampering the proper development of strictly aerobic bacteria. This estimation is consistent with the experiments we conducted.
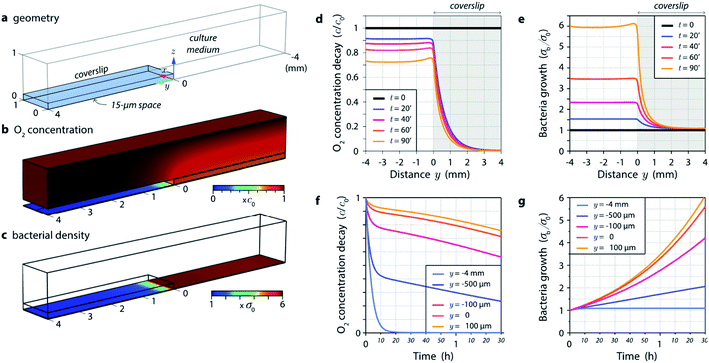
Then, we address the more complex case of a bacteria culture partly covered by a coverslip (Fig. 1). We conducted numerical simulations using Comsol Multiphysics to model the whole 3-dimensional (3D) problem (the Comsol file is provided in ESI†). Fig. 5 provides an overview of the results. The system is composed of a coverslip creating a 15 μm thick medium layer on half of a 2-dimensional culture of bacteria (Fig. 5a). A 1 mm thick liquid medium is covering the whole system. The simulations involve variations of the O2 concentration in 3D, and variations of the bacteria population as a function of their dioxygen consumption over time (the list of the different parameters and details on the theory can be found in the Methods and Materials section). The Comsol program provided in ESI† can be used to further vary all the parameters.
Fig. 5b gives an overview of the 3D distribution of O2 concentration in the system after 1 h 30 min of incubation. A substantial dioxygen depletion is observed below the coverslip. Note that the system is invariant along the x axis. The linear spatial profile of O2 concentration on the bottom of the chamber is plotted in Fig. 5d, at different times. After only 20 min a substantial depletion of oxygen is observed below the coverslip (blue curve in Fig. 5d). Fig. 5c represents the bacterial density on the bottom of the chamber after 1 h 30 min of incubation. While bacteria have been actively growing in the open medium, their development is seriously hampered under the coverslip. The linear profile of the normalized bacterial density σb/σ0 in Fig. 5e plots the evolution of the linear profile over time, and evidences almost no bacterial growth after a few 100 s of μm from the border of the coverslip, under the coverslip. The evolution over time of O2 concentration and bacterial density are represented in Fig. 5f and g, at different positions along the y axis. A substantial decay of oxygen concentration is rapidly observed below the coverslip. All these results are consistent with our experimental observations, although what we actually measured is a bit worth in term of bacterial growth below the coverslip. This may be due to the fact that the bacteria exhibit a latency phase, where they consume oxygen without growing. Also, we hypothesize in our model (see theory in Methods and Materials section) that the bacterial growth is proportional to the oxygen concentration. A more reasonable assumption would be that below a certain oxygen concentration, growth is inhibited. This would yield a further reduction of the bacterial growth.
Water in equilibrium with the atmosphere contains around 105 dioxygen molecules per μm3 (c0). This number seems unrealistically large, but an aerobic bacterium is consuming around 1 million dioxygen molecules per second (Q0). Bacteria are thus very effective oxygen consumers, despite their small size. In the meantime, oxygen diffuses extremely slowly in water (DO2 around 0.001 mm2 s−1), which explains why spatial restriction hampering efficient oxygen diffusion could seriously affect this extreme need of oxygen consumption.
Conclusions
We demonstrate that spatial confinement below a few hundred micrometres prevents the growth of aerobic bacteria. By measuring the growth of 4 bacterial species (two facultative anaerobes and two strictly aerobes) under such conditions, we demonstrate that this phenomenon is unique to the strictly aerobic species. We hypothesized that this growth inhibition was due to fast oxygen consumption and depletion. In support of this hypothesis, we show that growth of aerobic cells can be restored in the vicinity of trapped air bubbles, even under confinement conditions. Not only do these results provide evidence toward the origin of the problematic growth we observed (oxygen depletion), it also provides a convenient approach to enable aerobic bacteria culture under confined geometries, such as microfluidic devices. We recognize that the origin of the claustrophobic behaviour may not be evident. In particular, a possible explanation could have been rapid depletion of a nutriment present in the medium due to consumption by the cells, or accumulation of inhibitory waste compounds. Additionally, this effect could be synergistic with rapid hypoxia resulting in accumulation of by-products from anaerobic metabolism, or depletion of nutriments preferred in hypoxic conditions. Also, if some nutriments had electrostatic affinity with the naturally negatively charged glass surface, it could lead to an effective removal of these compounds from the culture medium bulk, or even pH modification. This mechanism would be favoured by the presence of the two glass coverslips and the sandwich geometry, characterized by a very high glass-surface/medium-volume ratio, which does not occur with a single coverslip. The results presented in this study challenge any such variations of the chemical nature of the culture medium as a possible explanation of the problem. A lack of dioxygen was evidenced as the sole origin of the problem. Bacteria are actually suffocating in confined geometries.Methods and materials
Bacteria growth conditions
Escherichia coli (HST08 – Stellar) were grown at 37 °C, 200 rpm in LB media (LB broth 1231 – Conda). Lactobacillus reuteri (DSM 20016) were grown at 35°, 200 rpm in MRS culture media (MMRS broth 69966 Sigma-Aldrich and tween 80 P8074 Sigma-Aldrich). Thermus thermophilus (CIP 110185T, type strain HB8) were grown at 70 °C, 200 rpm in LB media. Geobacillus stearothermophilus were grown at 60 °C, 200 rpm in LB media. For each experiment, cultures were grown overnight. The optical density (OD) was then measured with a spectrophotometer (Ultrospec 10 – Biochrom) and adjusted to the required OD (600 nm).20 μm confinement experiments
A VAHEAT heating stage (Interherence) with their PDMS (polydimethylsiloxane) reservoirs was used to set the temperature of the culture (Fig S1†). Observations were performed with a 40× air-objective (Olympus). To avoid excess convection and heat shock, heating was performed gradually (∼0.05°C s−1). Experiments were conducted at least in triplicate for each bacterial strain. In each experiment, 0.2 μL of bacterial suspension (OD 0.3) was dropped in the VAHeat reservoir and immediately covered by a small 150 μm thick coverslip with a triangular shape. This top coverslip was fabricated by a glass laser cutting technique. The laser processing system is based on a commercial femtosecond-diode-pumped ytterbium amplified laser source (S-Pulse HP, Amplitude Systemes) operating at 1030 nm (FWHM 5 nm) with a spatially Gaussian beam profile. The source is coupled in a dual-axis scanning galvanometric system (GVS012/M, Thorlabs) with metallic mirrors and a 100 mm focal length f-theta lens (FTH100-1064, Thorlabs). The 150 μm thickness coverslips were processed with the following parameters: beam diameter 60 μm, repetition rate 1 kHz, 0.5 mJ energy per pulse, 10 μm steps.Varying thicknesses experiments
To create cavities of various thicknesses, we used spacers, 1 mm thick (Press-to-seal Silicone Isolator, P24744, Invitrogen) and 120 μm thick (SecureSeal Imaging spacer, GBL654008, Sigma-Aldrich). The 120 μm spacers have been stacked to gradually vary the thickness from 120 μm to 840 μm. The same volume (7 μL – OD 0.08) of bacterial suspension was deposited in each seal. Each well was then completely filled with the appropriate culture media, and hermetically sealed with a glass coverslip. After a sedimentation time (from 1 h 30 min to 20 h depending on the strain and on the well thickness), the samples were incubated at the appropriate growth temperature without shaking. Images of the sample were taken just before incubation (0 h) and then every hour with a CMOS camera (DCC1545M-GL – Thorlabs) plugged to an inverted phase-contrast microscope (Eclipse TS2 – Nikon, 10× objective). A mark was placed on each sample to observe the same area throughout the experiment. Only Geobacillus stearothermophilus and Thermus thermophilus were studied this way.Bubble experiments
The growth of bacteria was monitored in the vicinity of air in order to validate the hypothesis of claustrophobia due to weak dioxygen renewal. 120 μm thick spacer were stuck on cleaned glass cover slides. 5 μL of bacterial suspension (OD 0.08) was deposited in each seal. Then, the 120 μm thick spacer was enclosed with a glass coverslip. The seals were not complete, with a thin layer of air between the spacer and the suspension. Air bubbles trapped randomly inside the suspension droplet were observed (Fig. 4). After waiting 1 h 30 min for sedimentation, samples were incubated at 60 °C for Geobacillus stearothermophilus and 70 °C for Thermus thermophilus. Images of the sample were taken just before incubation (0 h) and then every hour with a CMOS camera plugged to an inverted phase-contrast microscope. Experiments were performed at least in triplicates.Comsol simulations
Here are the parameters used in the simulations:| Parameters | Value | Unit | Definition |
|---|---|---|---|
| H | 1 | mm | Height of the chamber |
| W | 1 | mm | Width of the chamber |
| L | 4 | mm | Length of the chamber |
| h | 15 | μm | Height of the confinement |
| e | 150 | μm | Thickness of the coverslip |
| Q0 | 106 | s−1 | Bacterial O2 consumption |
| c0 | 1.5 × 10²³ | m−3 | Initial O2 concentration |
| σ0 | 1010 | m−2 | Initial bacterial density |
| DO2 | 2 × 10⁻⁹ | m2 s−1 | Dioxygen diffusivity |
| τ | 30 | min | Bacterial generation time |
The model used in the Comsol simulations involved the diffusion law in 3 dimensions for the oxygen concentration c:
| DO2∇2c = ∂tc. |
A boundary condition has to be applied to this differential equation, on the bottom of the chamber, where the bacteria are deposited, as a negative source term removing oxygen from the medium:
The other boundary condition of the problem is the setting of c = c0 on the top of the chamber.
Finally, the model also involves a differential equation regulating the areal bacterial density σb on the bottom of the chamber:
This equation assumes that the growth rate of bacteria is proportional to the oxygen concentration, as a means to hamper bacteria growth where oxygen is depleted. In the Comsol model, this areal density was replaced with a volumetric density nb = σb/h in the confined space, in order to have a full 3D model.
Conflicts of interest
There are no conflicts to declare.Acknowledgements
This project has received funding from the European Research Council (ERC) under the European Union's Horizon 2020 Research and Innovation Programme (grant agreement no. 772725, project HiPhore).Notes and references
- F. Wu and C. Dekker, Chem. Soc. Rev., 2016, 45, 268–280 RSC.
- W. Zhou, J. Le, Y. Chen, Y. Cai, Z. Hong and Y. Chai, TrAC, Trends Anal. Chem., 2019, 112, 175–195 CrossRef CAS.
- F. J. H. Hol and C. Dekker, Science, 2014, 346, 1251821 CrossRef PubMed.
- S. Kou, D. Cheng, F. Sun and I.-M. Hsing, Lab Chip, 2016, 16, 432–446 RSC.
- X.-Y. Zhang, K. Sun, A. Abulimiti, P.-P. Xu and Z.-Y. Li, Micromachines, 2019, 10, 606 CrossRef PubMed.
- A. Burmeister, F. Hilgers, A. Langner, C. Westerwalbesloh, Y. Kerkhoff, N. Tenhaef, T. Drepper, D. Kohlheyer, E. von Lieres, S. Noack and A. Grünberger, Lab Chip, 2018, 19, 98–110 RSC.
- J. Song, Y. Zhang, C. Zhang, X. Du, Z. Guo, Y. Kuang, Y. Wang, P. Wu, K. Zou, L. Zou, J. Lv and Q. Wang, Sci. Rep., 2018, 8, 6394 CrossRef PubMed.
- M. M. Salek, F. Carrara, V. Fernandez, J. S. Guasto and R. Stocker, Nat. Commun., 2019, 10, 1877 CrossRef PubMed.
- N. Tandogan, P. N. Abadian, S. Epstein, Y. Aoi and E. D. Goluch, PLoS One, 2014, 9, e101429 CrossRef PubMed.
- L. Tweedy, P. A. Thomason, P. I. Paschke, K. Martin, L. M. Machesky, M. Zagnoni and R. H. Insall, Science, 2020, 369, 6507 CrossRef PubMed.
- P. Wang, L. Robert, J. Pelletier, W. L. Dang, F. Taddei, A. Wright and S. Jun, Curr. Biol., 2010, 20, 1099 CrossRef CAS PubMed.
- D. Yang, A. D. Jennings, E. Borrego, S. T. Retterer and J. Männik, Front. Microbiol., 2018, 9, 871 CrossRef PubMed.
- F. Si, B. Li, W. Margolin and S. X. Sun, Sci. Rep., 2015, 5, 11367 CrossRef PubMed.
- J. Männik, R. Driessen, P. Galajda, J. E. Keymer and C. Dekker, Proc. Natl. Acad. Sci. U. S. A., 2009, 106, 14861–14866 CrossRef PubMed.
- Y.-J. Eun, P.-Y. Ho, M. Kim, S. LaRussa, L. Robert, L. D. Renner, A. Schmid, E. Garner and A. Amir, Nat. Microbiol., 2018, 3, 148–154 CrossRef CAS PubMed.
- J.-J. Bourgois, F. E. Sluse, F. Baguet and J. Mallefet, J. Bioenerg. Biomembr., 2001, 33, 353–363 CrossRef CAS PubMed.
- T. E. Riedel, W. M. Berelson, K. H. Nealson and S. E. Finkel, Appl. Environ. Microbiol., 2013, 79, 4921–4931 CrossRef CAS PubMed.
Footnote |
| † Electronic supplementary information (ESI) available. See DOI: 10.1039/d1ra00184a |
| This journal is © The Royal Society of Chemistry 2021 |

