 Open Access Article
CO2 activation of bamboo residue after hydrothermal treatment and performance as an EDLC electrode†
Duy Anh Khuongab,
Hong Nam Nguyena and
Toshiki Tsubota *b
*b
aUniversity of Science and Technology of Hanoi, Vietnam Academy of Science and Technology, Hanoi, 18 Hoang Quoc Viet, Cau Giay, Hanoi 100000, Vietnam
bDepartment of Materials Science, Faculty of Engineering, Kyushu Institute of Technology, 1-1 Sensui-cho, Tobata-ku, Kitakyushu-shi, Fukuoka 804-8550, Japan. E-mail: tsubota@che.kyutech.ac.jp; Tel: +81-93-884-3324
First published on 4th March 2021
Abstract
CO2 activation of the solid residue of bamboo after hydrothermal treatment, which is used for the production of xylo-oligosaccharide, was investigated in detail. The reference temperature for carbonization and CO2 activation was 800 °C. The activated carbon from a solid residue was demonstrated to have a higher potential for making EDLC electrodes than bamboo activated carbon thanks to its very low ash content (almost 0) and high porosity structure with a BET surface area up to ca. 2150 m2 g−1. The electrochemical performance of ELDC electrodes prepared from solid residue-derived activated carbon in 1 M H2SO4 aqueous solution was measured and well compared with carbon from bamboo. Through investigation, it is clear that the capacitance of the electrode made from the solid residue has a better capacity than that of raw bamboo.
1 Introduction
The development of renewable energy technologies is crucial to mitigate the environmental impacts caused by fossil fuels and in particular greenhouse gas emissions. In recent years, new generations of energy storage and conversion devices such as supercapacitors, that is, electrical double-layer capacitors (EDLCs) are preferred used due to their high specific power density, long cycle life, and good reversibility.1 To produce the EDLCs, activated carbon is widely applied to enhance the performance of the electrode. The global rising rate of activated carbon consumption was reported at 8.1% in 2018 and this amount is forecasted to go up in the coming years.2 To meet the increasing demand for activated carbon, many methods are applied on the industrial scale, in which the chemical and physical activations are the most common ones. However, physical activation is more favored due to its simplicity and no-cost for the elimination process of the chemical substances in the carbon material.It is known that CO2 activation is one of the physical activation methods. The mechanism of physical activation is similar to the gasification process, which involves the carbonization of raw material, followed by the activation of the resulting char with the presence of activating agents such as air, carbon dioxide, steam, or a mixture of these gases.3,4 By eliminating and condensing a certain amount of internal carbon mass, the product can obtain a highly porous structure. Originally produced from coal, activated carbon derived from biomass is attracting more and more developers thanks to its availability worldwide. Moreover, biomass was proved to be a promising precursor for supercapacitor electrode application in previous studies thanks to the large pore size structure and high adsorption capacity after physical activation. For instance, the dominant microporous structure of activated carbon from hybrid willow prepared by carb is demonstrated to be potential for supercapacitor electrode productions.5 Besides, the activated carbon derived from barley straw could also achieve a high surface area and porosity which are close to that of commercial activated carbon.2 Similarly, bamboo is a prospective candidate for producing the high-efficient carbonaceous material.
Currently, in Japan, the area of bamboo forests is unstoppably expanding due to the annual reducing consumption, making it a serious problem to deal with. The total bamboo consumption of Japan in 2013 was recorded as one-seventh of that in 1975.6 Thus, using bamboo as a biomass material is becoming an emphasized topic in recent years. In literature, many methods were applied to make use of bamboo as the raw material of activated carbon by both physical and chemical activations. The different textural properties and nanopore structure of activated carbons derived from tabah bamboo by H3PO4 activation and hypoxic activation were investigated.7,8 The bamboo-cellulose fiber was used as a precursor for EDLC electrodes and achieved a high performance comparable to that of the commercial ones.6 Nevertheless, because the cost of collecting bamboo is much higher than the value of the products produced from this biomass, the usage of bamboo is difficult in Japan. In this context, the use of bamboo needs to be carefully calculated based on a harmonious combination of economic, social, and environmental benefits. Hence, the cascade treatment of bamboo to obtain simultaneously different products provides an effective solution.4 A previous study showed an approach to the radical utilization of bamboo by using a cascade treatment method (hydrothermal treatment and KOH chemical activation), the high-value products as the xylo-oligosaccharide and the high-performance EDLC electrode from the bamboo residue were synthesized.9 Existing studies suggest that the cascade treatment followed by the physical activation to maximize the benefits from this resource could be an extremely effective solution.
Thus, the purpose of this study is to provide a comprehensive understanding of the properties of the products derived from bamboo after hydrothermal treatment and physical activation, and the feasibility of the activated product for the EDLC electrode.
2 Experimental
2.1. Preparation
Fig. S1† shows the implementation steps performed in this research. The bamboo feedstock of this study was Moso bamboo (Phyllostachys edulis), which is thriving and spreading on most of all Japan. Before starting the experiments, the bamboo powder was sieved with <100 mesh type to ensure the homogeneity of the samples. The sieved powder (5 g) was then mixed carefully with distilled water (45 g) in a Teflon container, which is an inner part of the stainless container for hydrothermal treatment (HU-100, Sanai science Co, Ltd). After being encased inside the autoclave, the sample was put in the heating box (Natural Convection Oven, DOV-300) which was already heated at 200 °C for 2 hours 30 minutes. The shaking action of the container for 1 minute was carried out every 30 minutes during the heating time to obtain a homogenous heat transfer on the sample. After the heating, the container was taken out from the heating box and immediately put in the water pool for cooling down. Until the sample reached the ambient temperature, it was filtrated to separate the solid residue from the solution.Following the above hydrothermal treatment process, the procedures of carbonization and activation were conducted in the system as in Fig. S2.† At first, approximately 2 g of sample (bamboo or solid residue) were put on a quartz boat, which was then set in the middle of the tubular furnace reactor to ensure the most accurate reaction temperature. Secondly, the precursor material was carbonized in an inert atmosphere (0.5 NL min−1 N2) at a controlled temperature (750–800–850–900 °C). Finally, to activate the remained biochar after pyrolysis, N2 flow was switched to CO2 flow (0.5 L min−1). During both processes, the reaction gas N2 or CO2 went across the line, flow meter, and quartz tube while exhaust gases at the gas outlet were the synthetic gas, the humidity, and tar mist. The gas trapper plays a role in ensuring the atmosphere does not affect the reaction in the furnace. All the activated samples were labeled based on material type, temperature, and activation time.
To manufacture a good-performance electrode from activated carbon, a mixture of polyvinylidene difluoride (PVDF) and acetylene black, or polyethylene terephthalate (PTFE) and carbon black (CB) was utilized.5,9,10 In this study, the activated products were mixed with polyethylene terephthalate (PTFE) and carbon black (CB) at the ratio by weight of 8![[thin space (1/6-em)]](https://www.rsc.org/images/entities/char_2009.gif) :
:![[thin space (1/6-em)]](https://www.rsc.org/images/entities/char_2009.gif) 1
1![[thin space (1/6-em)]](https://www.rsc.org/images/entities/char_2009.gif) :
:![[thin space (1/6-em)]](https://www.rsc.org/images/entities/char_2009.gif) 1 (sample
1 (sample![[thin space (1/6-em)]](https://www.rsc.org/images/entities/char_2009.gif) :
:![[thin space (1/6-em)]](https://www.rsc.org/images/entities/char_2009.gif) PTFE
PTFE![[thin space (1/6-em)]](https://www.rsc.org/images/entities/char_2009.gif) :
:![[thin space (1/6-em)]](https://www.rsc.org/images/entities/char_2009.gif) CB). The PTFE acts as a binder while the CB acts as a conductive enhancement agent for the carbon electrode. Therefore, the mixture was rolled, made into 2 thin sheets: 20 mm × 8 mm for the measurement sample and 6 mm × 8 mm for counter electrode (approximately 0.3 mm thickness), and dry for 24 h at 200 °C before being used for the electrochemical performance tests. The collecting electrode, the counter electrode, and reference electrode were a Pt plate with 20 mm × 8 mm sheet sample, a Pt plate with 6 mm × 8 mm sheet sample, and an Ag/AgCl electrode, respectively. The preparation of a small sheet sample into the counter electrode is to avoid the too large surface area deviation between electrodes. The 1 M H2SO4 solution as an electrolyte was bubbled with N2 gas for 20 minutes. All three electrodes were soaked in an H2SO4 solution for 12 days to ensure that the electrolyte fully penetrates the sample.
CB). The PTFE acts as a binder while the CB acts as a conductive enhancement agent for the carbon electrode. Therefore, the mixture was rolled, made into 2 thin sheets: 20 mm × 8 mm for the measurement sample and 6 mm × 8 mm for counter electrode (approximately 0.3 mm thickness), and dry for 24 h at 200 °C before being used for the electrochemical performance tests. The collecting electrode, the counter electrode, and reference electrode were a Pt plate with 20 mm × 8 mm sheet sample, a Pt plate with 6 mm × 8 mm sheet sample, and an Ag/AgCl electrode, respectively. The preparation of a small sheet sample into the counter electrode is to avoid the too large surface area deviation between electrodes. The 1 M H2SO4 solution as an electrolyte was bubbled with N2 gas for 20 minutes. All three electrodes were soaked in an H2SO4 solution for 12 days to ensure that the electrolyte fully penetrates the sample.
2.2. Analysis methods
To better understand the differential reactions between bamboo and solid residue during pyrolysis, the thermogravimetry process, which determines the material weight concerning a combination of temperature and time,13 was carried out in an inert atmosphere, from room temperature to 1000 °C by TG-DTA (TG8120, Rigaku Corporation).
where I is the constant discharging current, m is the mass of the dry sheet sample in the electrode, Q is the amount of charge moving through the electrolyte ΔV(Q) refers to the change of the voltage, Δt is the sampling step.
Cyclic voltammetry (CV) measurements were also performed in the voltage range from −0.2 to 0.7 V vs. Ag/AgCl at the scan rate range from 1 mV s−1 to 100 mV s−1. The capacitance value was estimated by using the following equation:
Electrochemical impedance spectroscopy (EIS) tests were carried out at the frequency from 500 kHz to 10 mHz to define the resistances of the electrodes.
3 Results and discussion
3.1. Ingredients characterization of the water solution and thermal behavior of the bamboo and solid residue
Before investigating the compounds in the solution after hydrothermal treatment, pH and sugar content were checked for the water solution. The pH value of the solution was 3.68, and the value of the sugar content was 2.8 °Bx. The mechanism of the hydrolysis reaction in bamboo was the generation of organic acid and the saccharides, which is the main component of the sugar. Fig. S3† shows the yields of the identified saccharides in the water solution. The xylo-oligosaccharide, which contain xylose (C5H10O5), xylobiose (C10H18O9), and xylotriose (C15H26O13), was the main compounds along with some auxiliary components as arabinose (C5H10O5) and glucose (C6H12O6). These bioactive compounds are known for their abilities to stimulate the selective growth and activity of benefic bacteria in the human colon,14 which demonstrates the capability of the water solution to produce high-value food for health. Due to the strong reactivity of the hydrolysis reaction of xylan in bamboo for 2.5 hours with the shaking action, the amount of xylo-oligosaccharide was not inferior to the previous study.15The yield of the residue was 69.05%, smaller than ∼2% compared to the previous study.9 The amount of lignin, hemicellulose, and α cellulose extracted from the bamboo and solid residue are described in Fig. S4.† The generation of saccharides in the water solution significantly affected the content of the solid residue derived from bamboo. Hemicellulose decreased drastically because of the saccharide compound dissolving into the hot compressed water. Meanwhile, a small amount of lignin and cellulose were also lost due to the impact of hydrothermal treatment and extraction by acid sulfuric and sodium hydroxide solutions. One of the most striking successful results of the hydrolysis process was the ash elimination from the bamboo sample. The amount of ash in the residue was only 0.04% compared to 1.8% in the bamboo. The constituents of the ash are usually inorganic compounds such as silica, which have large electrical resistivities and small specific surface area. Thus, the existence of ash is unsuitable for the EDLC electrode. This significantly low ash content is an encouraging condition for the solid residue to be an amazing precursor for the industrial EDLC electrode.
The thermal behavior of the bamboo sample and solid residue under an inert N2 atmosphere is expressed through the TG and DTG analysis in Fig. S5.† According to the curves, three sub-processes occurred during the pyrolysis from ambient temperature to 1000 °C: dehydration, devolatilization, and char formation. The first degradation region from room temperature to approximately 125 °C represents the moisture removal, which accounted for approximately 5.8% weight of bamboo and 3.8% wt of residue. The second stage of the degradation region, which is the main part delineating the pyrolysis characteristics of the sample, took place from 200 °C to 450 °C. During this stage, the decomposition of hemicellulose, cellulose, and lignin occurred in increasing order of temperature.16 The hemicellulose and light volatiles broke down below 350 °C, while cellulose and lignin decayed in the temperature range from 250 °C to 450 °C. The overlapping endothermic peak in the case of bamboo was found at 325 °C with the maximum loss rate ∼11% °C−1. The DTG curve revealed that the hydrothermal treatment considerably influenced the thermal behavior of the raw material. The product after the hydrolysis had an overlapping peak at 363 °C and a maximum weight loss rate of 15% °C−1. This remarkable change was due to the removal of cellulose from the bamboo by hot compressed water, resulting in a noticeable modification of the organic compounds in the solid residue. It can also be seen that the devolatilization in the solid residue is more accelerated than in bamboo. The third region, the char formation stage, started at a temperature higher than 450 °C. In this stage, the higher position of the TG curve illustrated that the amount of char formed after bamboo pyrolysis was clearly higher.
3.2. Characterization in term of CO2 activation
The CO2 activation after the carbonization for 1 h with N2 flowing was performed at the same temperature as the carbonization. The CO2 activation time dependences of the yield are shown in Fig. 1(a). The yields linearly decreased with the increasing CO2 activation time, that is, the reaction can be expressed as the zero (0) order. The conversion from the carbonized sample to gaseous species during CO2 activation was estimated as shown in Fig. 1(b). The apparent kinetics was evaluated from the data of Fig. 2(b) as the 0 order reaction. The obtained equations are summarized in Table 1.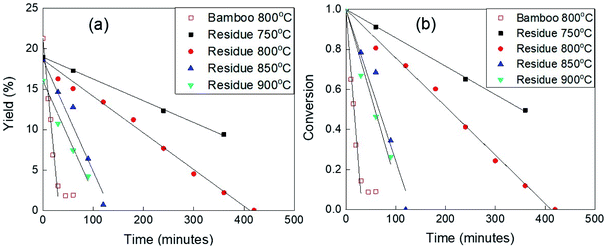 | ||
| Fig. 1 The apparent kinetics of bamboo and residue during the CO2 activation at different temperatures (a) according to the yield; (b) according to the conversion. | ||
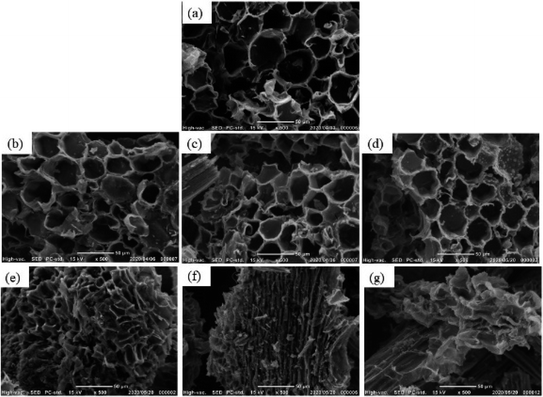 | ||
| Fig. 2 SEM images of the solid residue samples after CO2 activation process (a) 0 h; (b) 1 h; (c) 2 h; (d) 3 h; (e) 4 h; (f) 5 h; (g) 6 h. | ||
| Samples | Equations |
|---|---|
| a y: degree of conversion, x: reaction rate (min−1). | |
| Bamboo 800 °C | y = −0.0306x + 1 |
| Residue 750 °C | y = −0.0014x + 1 |
| Residue 800 °C | y = −0.0024x + 1 |
| Residue 850 °C | y = −0.0076x + 1 |
| Residue 900 °C | y = −0.0086x + 1 |
The slopes in Fig. 1(a) and (b) indicate the moderate conversion rate. The strong deviation from the straight line for bamboo in Fig. 1(a), points out that the sample completely turned into ash at that time. With the CO2 activation performed at 800 °C, the conversion line of bamboo had a steep slope and the time for bamboo transformed into ash was more than 30 minutes. Meanwhile, in the case of solid residue activated at 800 °C, the slope was relatively gentle and no deviation from the straight line was noticed, which means the percentage of ash was very small. It is known that ash plays a role as the catalyst to speed up the reaction during activation. The reported results have also shown that the ash of bamboo is a catalyst contained SiO2, Fe2O3, CaO, which helps to enhance the tar reduction, increase the synthesis gas yield and improve the efficiency of the biomass gasification.17–19 Therefore, the reason for this extreme difference in conversion rate could be the percentage of inorganic compounds that acted as the raw material of ash.
Based on the reaction rate constants calculated from the slope in Fig. 1(b) and summarized in Table 1, the Arrhenius plot derived for the data of solid residue is shown in Fig. S6.† During the heating treatment with CO2 flowing, the following reaction, which is the Boudoard reaction,20 can be presumed as one of the dominant chemical reactions.
It is said that CO2 activation was more progressive at 850 °C. Moreover, the relationship between the experimental plots in Fig. S6† was not the straight line along with the huge gap between the data for 800 °C and 850 °C, which indicated that the chemical reactions that occurred at more than 850 °C were different from those at less than 850 °C. Those differences could be the reason for the large enhancement of the reactivity from 800 °C to 850 °C.
3.3. Morphologies of the bamboo and residue activated carbons
The SEM images of the samples prepared from solid residue at 800 °C are shown in Fig. 2. It should be noticed from the SEM image of the sample without activation (0 h) that the hydrothermal treatment did not influence the microstructure. This porous structure remained after 3 hours of CO2 activation. However, the microstructures of the samples activated more than 4 h were gradually deformed. The morphology of quasi-circular or quasi-pentagonal pore in the sample derived from solid residue activated for 4 h transformed into a long narrow, distorted, or uncertain form. The hollow porous surface structure almost completely collapsed at more than 5 hours. It indicated that the reactions of the carbonized sample derived from solid residue in CO2 flow progressed slowly. The reason for the slow reaction rate of the solid residue in a CO2 atmosphere can be explained by the lower amount of ash, which acts as the catalyst for gasification. The low reaction rate and a long time of activation allowed the heat and reactive gas concentration to transfer homogenously throughout the carbonized sample. It is supposed to develop the porous structure of the sample derived from solid residue in the micro-scale, which is a plus point for the residue comparing to bamboo.
3.4. Raman spectra of the bamboo and residue activated carbons
Fig. S9† shows the Raman spectra of the bamboo and residue chars to investigate deeper in the effect of the temperature and conversion times on the structure of char. The band around 1600 cm−1 is called the G band, ascribed to graphite structure, which contains the stretching carbon atoms pair of sp2 domains in aromatic rings and conjugated chains. Besides, the peak band at ca. 1350 cm−1 is assigned to the structural disorder, the defect in the pristine graphite structure.22 Hence, the peak intensity ratio ID/IG (the peak intensity of the D band/the peak intensity of the G band) was used to identify the types of configuration in the samples. Based on the ratio greater than 1, all the residue char constituted from the amorphous carbon structure. However, the relatively similar shape of Raman spectra and nearly equal ID/IG ratio in Table 2 pointed out that the CO2 activation and carbonization temperature had an inconsiderable influence on the graphitization degree of the structures of bamboo and residue chars. The same trend has also been explored in the research about bamboo-fibers activated with sodium hydroxide (NaOH).6 Another noteworthy point is the 2D band in the region from 2400 to 3250 cm−1, which represented a low intense bump in the figures. The broadening mechanism of the 2D band is dependent on the number of layers and stacking order of the graphitic carbon.23 In other words, the higher the defect concentration, the more hexagonal graphene networks are disorganized, which causes a lower amount of multilayers and the dissipation of the 2D band. According to Fig. S9(a–c),† the bamboo and residue samples had the 2D band nearly the same. This suggested that the layers and graphitic structures of char have not been influenced by the activation time or reaction temperature, and the multilayer structures in the chars remained during activation. Therefore, the Raman spectra could only explain the type of carbon configuration without indicating how the microstructure of the chars changed during the activation at different temperatures.| Samples | ID/IG |
|---|---|
| Bamboo 800 °C carbonization | 1.02 |
| Bamboo 800 °C 10′ activation | 1.03 |
| Bamboo 800 °C 15′ activation | 1.03 |
| Bamboo 800 °C 20′ activation | 1.03 |
| Bamboo 800 °C 30′ activation | 1.02 |
| Residue 800 °C carbonization | 1.00 |
| Residue 800 °C h activation | 1.02 |
| Residue 800 °C 2 h activation | 1.01 |
| Residue 800 °C 3 h activation | 1.00 |
| Residue 800 °C 4 h activation | 1.01 |
| Residue 800 °C 5 h activation | 1.03 |
| Residue 800 °C 6 h activation | 1.00 |
| Residue 750 °C carbonization | 1.00 |
| Residue 850 °C carbonization | 1.01 |
| Residue 900 °C carbonization | 1.01 |
3.5. Nitrogen adsorption isotherms of the bamboo and residue activated carbons
3.5.2.1 The dependence on the activation time. The nitrogen adsorption/desorption isotherms and micropore distributions of different residue chars activated under CO2 atmosphere at 800 °C are shown in Fig. 4. According to Fig. 4(a), all the isotherms also exhibited a type I isotherm in the IUPAC classification. For the carbonized residue char (non-activated char), the N2 adsorption volume was nearly the same as that of carbonized bamboo char. From 0 to 3 hours of activation, the adsorption amount increased steadily every 1 hour. However, this amount of char activated for 4 hours was displayed a sudden increment by the high upward isotherm. This phenomenon means that the distortion of the surface morphology as mentioned in the previous part fostered the appearance of the micropores in the char. After the distortion, the collapse of the structure led to the destruction of the micropore, which was manifested by the decrease in the amount of adsorbed gas in 5 hours and 6 hours – activated samples. Nevertheless, the degree of destruction was not as much as in the bamboo case, while the yield was relatively low. Fig. 4(b) shows again the limitation of the growth of micropore distribution was 4 hours of activation.
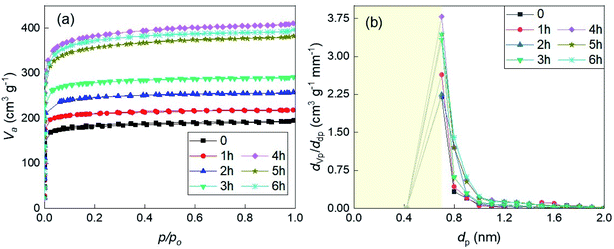 | ||
| Fig. 4 (a) The nitrogen (N2) adsorption and desorption isotherms; (b) the micropore distributions defined by MP method of the samples derived from solid residue produced at 800 °C. | ||
3.5.2.2 The dependence on temperature. Fig. 5 shows the BET specific area according to the yield of the samples derived from the solid residue, which was calculated from the results of N2 adsorption isotherm at the relative pressure smaller than 0.1 (based on ISO9277). With the increasing activation temperature and activation time, the microporous structure of the activated carbon derived from solid residue developed in different ways. For the carbonized samples, the temperature has already had a remarkable influence on the micropore structure, which is illustrated by the increasing value of specific surface area from 633 to 1003 m2 g−1 in the temperature range from 750 °C to 900 °C. The BET surface area of the samples enhanced drastically to a limited value close to 1500 m2 g−1 after 4 hours or 1.5 hours of activation at 800 °C or 850 °C, respectively. Meanwhile, at 750 °C, the value of the BET specific area of the sample reached only 1009 m2 g−1 after 6 hours of activation, which is evidence for the inefficient activation temperature. The highest BET specific area value – 2132 m2 g−1 obtained from the solid residue prepared at 900 °C after 1.5 hours of activation. Another notable point is that even though produced at the same yield (4%), the activated carbon product at 900 °C achieved a higher surface area than at 800 °C, according to the Fig. S2.† These results suggest that the microporous structure of the solid residue char is strongly influenced by CO2 activation condition – time and temperature. Conclusively, 900 °C seems to be the relevant temperature to stimulate the growth of microstructures in the solid residue, however, not suitable for producing the activated carbon due to the difficult control and very rapid decrease in the product yield. Based on the BET specific area data, the activated carbon derived from the solid residue, which has a relatively high value of adsorption capacity, can be used as the candidate for the EDLC electrode.
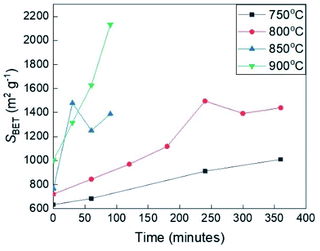 | ||
| Fig. 5 The BET specific area of the activated samples derived from the solid residue at different temperatures according to the conversion time. | ||
Before EDLC performance measurements, the densities of electrodes were examined by the formula.26
| d = (Vp + 1/dm)−1 |
![[thin space (1/6-em)]](https://www.rsc.org/images/entities/char_2009.gif) 115, Wako Pure Chemical Industries, Ltd).
115, Wako Pure Chemical Industries, Ltd).
3.6. Electrochemical performance of the EDLC electrodes made from activated carbons
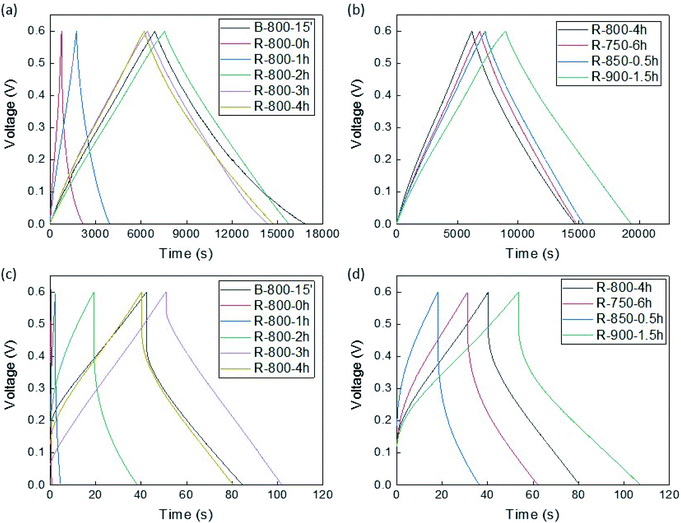
As mentioned, to evaluate the electrical performance of the EDLC electrodes, the charge/discharge measurements were performed. Nonetheless, because of the low yields, only a part of samples that were deemed to have potential such as those with the highest BET surface area for each different temperature was included in this kind of measurement. Besides, some residue samples that were carbonized or activated for 1, 2, 3 hours at 800 °C were also examined to expose the effect of the CO2 activation process on the performance of the activated carbon.The results of cyclic voltammetry (CV) measurements are shown in Fig. 6 and S11.† The cyclic voltammograms of all samples, except the carbonized residue and 1 hour activated residue, witnessed a rectangular and reversible shape at a scan rate of 1 mV s−1. It indicated the general electrochemical properties of carbon material, in which the capacitance was mostly synthesized from the electric double layer. The carbonized and 1 hour activated residue samples did not achieve a good electrochemical performance due to their low porosity structures. The small humps in all the graphs mean the appearance of the slight redox reaction in the voltage range of 0 to 0.5 V versus standard potential Ag/AgCl. To access the charge storage mechanism of the EDLC electrodes, the b value was calculated from the power-law which shows the relationship between response current (i) and the voltage scan rate (v):
| i = avb |
 | ||
| Fig. 6 The CV curves measured at 1 mV s−1 of the samples (a) produced at 800 °C; (b) at different temperatures. | ||
The results of the electrochemical impedance spectroscopy (EIS) are shown in Fig. S14 and S15.† In the low-frequency region, the slope of the straight lines represents the Warburg resistance. It indicated that the shorter the slope section, the smaller diffusional resistance,10 which decreased with activation time and increment of temperature. In the high-frequency region, the double-semicircle diameter can correspond to the internal resistance and charge transfer resistance inside the electrodes. In more detail, the double-semicircle could resemble the equivalent circuit and Nyquist plot of the Lithium-ion battery circuit, which has a relatively similar EIS pattern as in this study. The electric circuit of the common EDLC electrode contains only bulk resistance (Rb), charge-transfer resistance (Rct), double-layer capacitance (CPEelectrode), and Warburg impedance (WWarburg) as in a Randles cell model (diffusion control). Meanwhile, the EDLC samples in this research might accommodate additionally the parallel elements as resistance (RSEI) and capacitance (CPESEI) of the interfacial layer, which cause the partly small circle at the high-frequency region of EIS plots.30 Generally, the EIS plots demonstrated that the EDLC electrodes made from activated samples obtained similarly low value equivalent serial resistance (∼1.5 ohm).
Fig. 7 shows the charge–discharge graphs of the samples measured at 10 mA g−1 and 1000 mA g−1. All the plots at the low current rate (10 mA g−1) exhibited a nearly symmetric triangular shape, representing the reversibility and ideal behaviour of a capacitor. It can be seen that the shape and position of charge/discharge graphs of residue samples activated for more than 2 hours and activated bamboo at 800 °C were almost similar at this low scan rate. However, at the high current density (1000 mA g−1), the feature of charge/discharge graphs changed significantly, which was confirmed by the IR drops and the shape differences in the plots. The IR drops gradually smaller in increasing order of activation time until 3 hours. One of the reasons for this phenomenon could be the increment of electrical conductivity due to the small change of the amorphous structure of the samples during CO2 activation. It could correspond to the complex pore channel structures of electrodes from activated carbons, which caused incomplete ion diffusion at a higher rate of the current.10
The charging and discharging capacitances measured from the measurement data are shown in Fig. 8 and S16.† As shown in this figure, for the samples activated at 800 °C, the electrode made from 3 hours-activated solid residue exhibited the best performance based on the lowest slope degree of capacitance line during both charge and discharge process, as well as large discharge capacity at the high current density. Meanwhile, the samples activated at 750 and 850 °C exhibited inferior capacitance during the discharge process at the current density of more than 50 mA g−1. The maximum charge and discharge capacity in this study was approximately 160 F g−1 at 10 mA g−1, as recorded from the solid residue activated sample at 900 °C. These capacitances from charge/discharge plots were in accordance with CV results. Based on the capacitance values, the energy density (E) and power density (P) of the electrode samples were calculated according to the two equations, E = CV2/2 and P = E/Δt, where C is specific capacitance, V is operating window voltage, Δt is the discharge time.26 The results of energy and power calculations at the scan rate of 1000 mA g−1 and 10 mA g−1 are shown in Table S3.† As expected, the highest energy density (7.8 W h g−1) at 10 mA g−1 was gained from the solid residue activated for 1.5 hours at 900 °C. The reason for the great performance of the sample produced at 900 °C could be the enlargement of the porous structure, as mentioned in the previous section. On the other hand, the top of power density was recorded as 250.3 W kg−1 at the current density of 10 mA g−1 by the solid residue sample activated for 3 hours at 800 °C.
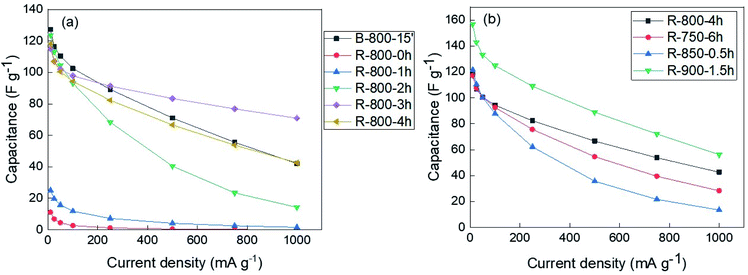 | ||
| Fig. 8 The capacitance values calculated from discharge process of (a) the samples produced at 800 °C; (b) the solid residues activated at different temperatures. | ||
The two-electrodes measurement was also performed and well-compared with a three-electrodes system with the residue sample produced at 800 °C after 3 hours of activation. The areal capacitance, areal energy density, and areal power density are shown in Table S3.† At the same condition of current density, the three-electrode system was more efficient in terms of capacitance and energy, but not by power as the two-electrodes one. Theoretically, the capacitance value of the three-electrodes cell is four times that of the two-electrodes cell. The possible reason for the relatively larger capacitance of the two-electrode cell is a closer distance between the electrodes (sample and counter, or sample and sample) in a cell.
To investigate the stability of the electrodes, the solid residue sample activated for 3 hours at 900 °C were tested at a constant current density of 500 mA g−1 over 10![[thin space (1/6-em)]](https://www.rsc.org/images/entities/char_2009.gif) 000 cycles. Fig. S17† presents the capacitance percentage profile of this measurement. From the first to 2000th cycle, the capacitance increased to the maximum value (100%) due to the time interval for the immersing process of the electrolyte in the electrode. After 2000 cycles, the capacitance rate of the samples slightly changed, however, only fluctuated around 100%. The discharge curves of the electrode sample are shown in Fig. S17(b).† The discharge behavior indicated the shape as the capacitance of electric double layer, that is, almost straight line even if the number of the cycles is 9000th.
000 cycles. Fig. S17† presents the capacitance percentage profile of this measurement. From the first to 2000th cycle, the capacitance increased to the maximum value (100%) due to the time interval for the immersing process of the electrolyte in the electrode. After 2000 cycles, the capacitance rate of the samples slightly changed, however, only fluctuated around 100%. The discharge curves of the electrode sample are shown in Fig. S17(b).† The discharge behavior indicated the shape as the capacitance of electric double layer, that is, almost straight line even if the number of the cycles is 9000th.
From the results, it demonstrated that the CO2 activation of bamboo and its solid residue after hydrothermal treatment successfully stimulated the growth of porous structure, leading to the enhanced electrochemical performance of electrodes made from activated carbons. In terms of producing activated carbon, this study showed that the capacity of the products obtained from the physical activation was as good as it is from chemical activation.9 Besides, the performance of the EDLC electrode from activated solid residue was better than the product from bamboo, which is proof of the high potential of physical activation in the cascading use. The results of the previous study suggested that the performance of an EDLC electrode derived from the solid residue in this research could be significantly improved by the optimization of the carbonization and activation processes, following the concept in Fig. S1.†
4 Conclusions
An approach for the effective economic application of bamboo has been successful in this study. By using the cascade treatment, the high-values product as xylo-oligosaccharide and the EDLC electrode were synthesized. The xylo-oligosaccharide from the treatment of bamboo with hot compressed water was produced with a suitable amount of xylobiose and xylotriose to be applied in the specified food health use. Furthermore, the hydrothermal treatment of bamboo left the solid residue, which contained very low ash content, only 0.04%. The activated carbon prepared from solid residue by CO2 activation has the dominant microporous structure with a high BET specific surface, up to nearly 2150 m2 g−1. With these advantages, the EDLC electrode made from solid residue-derived carbon material achieved better electrochemical performance than those from bamboo as a precursor. The electrode made from solid residue carbon possessed a density close to that from commercial activated carbon. By using the solid residue activated for 1.5 hours at 900 °C, the specific capacitance and energy density of the obtained electrode could reach 160 F g−1 and 7.8 W h g−1. Besides, the electrode made from the solid residue has been partly shown to have a good stability with the virtually constant capacitance after 10![[thin space (1/6-em)]](https://www.rsc.org/images/entities/char_2009.gif) 000 cycles. The higher performance can be attained from the solid residue by optimizing carbonization and activation processes.
000 cycles. The higher performance can be attained from the solid residue by optimizing carbonization and activation processes.
Author contributions
D. A. Khuong performed the measurements, processed the experimental data, performed the analysis (data curation, formal analysis), drafted the manuscript and designed the figures (original draft). T. Tsubota was involved in planning and supervised the work (resources and supervision). T. Tsubota and H. N. Nguyen aided in validated the results and worked on the manuscript (validation and visualization). All authors discussed the results and commented on the manuscript (review and editing).Conflicts of interest
To the best of our knowledge, the named authors have no conflict of interest, financial or otherwise.References
- I. I. G. Inal and Z. Aktas, Appl. Surf. Sci., 2020, 514, 145895 CrossRef.
- J. Pallarés, A. González-Cencerrado and I. Arauzo, Biomass Bioenergy, 2018, 115, 64–73 CrossRef.
- V. Benedetti, F. Patuzzi and M. Baratieri, Energy Procedia, 2017, 105, 712–717 CrossRef CAS.
- J. Xu, L. Dai, Y. Gui, L. Yuan, J. Ma and C. Zhang, Ind. Crops Prod., 2020, 149, 112364 CrossRef CAS.
- C. Jiang, G. A. Yakaboylu, T. Yumak, J. W. Zondlo, E. M. Sabolsky and J. Wang, Renewable Energy, 2020, 55, 38–52 CrossRef.
- M. Fujishige, I. Yoshida, Y. Toya, Y. Banda, K.-i. Oshida, Y.-s. Tanaka, P. Dulyaseree, W. Wongwiriyapan and K. Takeuchi, J. Environ. Chem. Eng., 2017, 5, 1801–1808 CrossRef CAS.
- D. N. K. P. Negara, T. G. T. Nindhia, I. W. Surata, F. Hidajat and M. Sucipta, Surf. Interfaces, 2019, 16, 22–28 CrossRef CAS.
- D. N. K. P. Negara, T. G. T. Nindhia, I. W. Surata, F. Hidajat and M. Sucipta, Mater. Today: Proc., 2020, 22, 148–155 CAS.
- T. Tsubota, K. Ishimoto, S. Kumagai, S. Kamimura and T. Ohno, J. Porous Mater., 2018, 25, 1541–1549 CrossRef CAS.
- Z. Hu, X. Li, Z. Tu, Y. Wang, O. D. Dacres, Y. Sun, M. Sun and H. Yao, Fuel Process. Technol., 2020, 205, 106430 CrossRef CAS.
- D. J. Horst, J. J. Ramírez Behainne, P. P. de Andrade Júnior and J. L. Kovaleski, Energy Sustainable Dev., 2014, 23, 78–84 CrossRef CAS.
- C.-W. Park, S.-Y. Han, S.-K. Choi and S.-H. Lee, BioResources, 2017, 12, 6298–6308 CAS.
- O. Das, N. K. Kim, M. S. Hedenqvist and D. Bhattacharyya, in Durability and Life Prediction in Biocomposites, Fibre-Reinforced Composites and Hybrid Composites, ed. M. Jawaid, M. Thariq and N. Saba, Woodhead Publishing, Cambridge, 1st edn, 2019, ch. 15, pp. 335–365 Search PubMed.
- F. J. Contesini, E. A. de Lima, F. Mandelli, G. P. Borin, R. F. Alves and C. R. F. Terrasan, in Encyclopedia of Food Chemistry, ed. L. Melton, F. Shahidi and P. Varelis, Academic Press, Oxford, 1st edn, 2019, pp. 30–34 Search PubMed.
- D. González, V. Santos and J. C. Parajó, Chem. Eng. J., 2011, 167, 278–287 CrossRef.
- A. Kanca, Fuel, 2020, 263, 116517 CrossRef CAS.
- A. Herman, Y. Suzana, M. Shahbaz and D. Patrick, Procedia Eng., 2016, 148, 432–436 CrossRef CAS.
- A. Purbasari, T. Samadhi and Y. Bindar, Int. J. Renewable Energy Dev., 2016, 5, 95–100 CrossRef CAS.
- S. Soleimanzadeh, C. Weiss, K. Torres Cancel and E. Giannini, Thirteenth International Conference on Recent Advances in Concrete Technology and Sustainability Issues, Ottawa, Jul, 2015 Search PubMed.
- P. Basu, in Biomass Gasification, Pyrolysis and Torrefaction, ed. P. Basu, Academic Press, Cambridge, 3rd edn, 2018, ch. 7, pp. 211–262 Search PubMed.
- S. F. Hamad, N. Stehling, C. Holland, J. P. Foreman and C. Rodenburg, Procedia Eng., 2017, 200, 295–302 CrossRef.
- A. Lazzarini, P. Andrea, P. Riccardo, A. Giovanni, R. Svemir, L. Carlo and G. Elena, Phys. Procedia, 2016, 85, 20–26 CrossRef CAS.
- A. Kaniyoor and S. Ramaprabhu, AIP Adv., 2012, 2, 032183 CrossRef.
- F. Rouquerol, J. Rouquerol and K. Sing, in Adsorption by Powders and Porous Solids, ed. F. Rouquerol, J. Rouquerol and K. Sing, Academic Press, London, 1999, 1st edn, ch. 8, pp. 219–236 Search PubMed.
- S. J. Gregg, K. S. W. Sing and H. W. Salzberg, J. Electrochem. Soc., 1967, 114, 279C CrossRef.
- S. Saha, M. Jana, P. Samanta, N. C. Murmu and T. Kuila, Ind. Eng. Chem. Res., 2016, 55, 11074–11084 CrossRef CAS.
- S. Saha, M. Jana, P. Samanta, N. C. Murmu, N. H. Kim, T. Kuila and J. H. Lee, Mater. Chem. Phys., 2017, 190, 153–165 CrossRef CAS.
- S. Saha, M. Jana, P. Samanta, N. C. Murmu, A. Banerjee, R. S. Ganesh, H. Inokawa and T. Kuila, Chem. Eng. J., 2018, 339, 334–345 CrossRef CAS.
- T. S. Mathis, N. Kurra, X. Wang, D. Pinto, P. Simon and Y. Gogotsi, Adv. Energy Mater., 2019, 9, 1902007 CrossRef CAS.
- W. Choi, H.-C. Shin, J. M. Kim, J.-Y. Choi and W.-S. Yoon, J. Electrochem. Sci. Technol., 2020, 11, 1–13 CrossRef CAS.
Footnote |
| † Electronic supplementary information (ESI) available. See DOI: 10.1039/d1ra00124h |
| This journal is © The Royal Society of Chemistry 2021 |


