 Open Access Article
Non-equilibrium thermal annealing of a polymer blend in bilayer settings for complex micro/nano-patterning†
Ankur Pandeya,
Kaniska Murmua and
Partho Sarathi Gooh Pattader *ab
*ab
aDepartment of Chemical Engineering, Indian Institute of Technology, Guwahati, 781039 India. E-mail: psgp@iitg.ac.in
bCenter for Nanotechnology, Indian Institute of Technology, Guwahati, 781039 India
First published on 10th March 2021
Abstract
Micro phase separation in a thin film of a polymer blend leads to interesting patterns on different substrates. A plethora of studies in this field discussed the effect of the surface energy of the underlying tethered polymer brush or substrate on the final morphology of the polymer blend. The conventional process toward the final morphology is rather slow. Here, aiming fast lithography, we induce the kinetically driven morphological evolution by rapid thermal annealing (RTA) of the polymer blend of polystyrene (PS) and polymethylmethacrylate (PMMA) in bilayer settings at a very high temperature. The underlying film consists of untethered constituent homopolymers or their blend or random-co-polymer (RCP). Apart from the phase inversion of the blend on the PS homopolymer, a rich morphology of the blend on the RCP underlayer is uncovered with systematic investigation of the film using sequential washing with selective solvents. The dissolution characteristics and the thermal stability of the constituent polymers corroborated the observation. Based on the understanding of the morphological evolution, fabrication of a complex shaped micro/nano-pattern with multiple length scales is demonstrated using this blend/RCP system. This study shows a novel methodology for easy fabrication of hierarchical small length scale complex structures.
1. Introduction
On-demand alteration of the surface properties of a given surface using small scale structured polymeric domains finds a broad spectrum of interdisciplinary applications such as fabrications of robust membrane materials,1–5 highly ordered magnetic bit pattern media,6,7 bio-inspired superhydrophobic and self-cleaning surfaces,8–13 anti-reflection coatings,14,15 negative refractive index materials,16 etc. Fabrication of micro/nano scale morphology involves different techniques such as photolithography,17 e-beam lithography,18,19 reactive ion etching (RIE),20 vapor deposition methods,21 nanoimprint lithography (NIL),22–24 micro-contact printing (μCP),25–28 elastic contact lithography (ECL),29 electric field induced pattern generation,30–35,68 thermal or solvent vapour assisted dewetting of polymer films,36–39,69 phase separation mediated pattern generation,40–42 etc.Self-assembly in polymer blends and in block copolymer thin films has gained attention in the last few decades due to its scientific and technological importance in fabrication of micro-nano structures. The blend polymer solution contains two or more dissimilar polymers in the form of a physical homogeneous mixture in a common solvent. In random copolymers (RCP), two or more dissimilar polymer blocks of random chain lengths are chemically bonded to each other. Owing to the differences in their chemical and physical properties, the respective polymers of the blend or blocks of RCP have a tendency to segregate into micro/nano phases.
The phase separation of polymer blend is dictated by the thermodynamics of the blend system. Tuning the temperature, pressure or compositions, the system can be forced to move from single phase to metastable or to the two phase spinodal regime. Metastable regime involves slow nucleation followed by growth of phase-separated domains. However, in spinodal decomposition, phase separation starts with instantaneous density fluctuations of segments that progressively increases in amplitude and wavelengths in later stage resulting in coarser phase separated domains.43
In this respect, the phase separation in micro domains is somewhat restricted in case of RCP compared to the blend due to the presence of covalent bonds between two dissimilar polymer blocks in RCP. Nevertheless, rich morphology, such as stratified layer, horizontal or vertical cylinders, gyroid41 etc. can be obtained using blend and block co-polymers depending on their mole fraction, solvent/temperature used for annealing44,45 etc. The phase separation of a polymer blend or RCP within a thin film over a substrate is a complex process and is influenced by various parameters such as solubility, Flory–Huggins parameter, molecular weights, mobility, evaporation of solvent which is associated with viscosity and concentration of the components, thickness of the film40 etc. Formation of nanoscale structures using blend polymers are thus challenging as well as provides controlling handle to tune the morphology. One can obtain diverse morphology by varying the volume fraction as well as the substrate characteristics.46
The polymer–polymer phase separation in a thin film is quite different from a bulk phase separation and strongly affected by the thickness of film. As the film thickness reduces, the characteristic length scale of spinodal decomposition decreases and at film thickness less than ∼200 nm the film dewets with spinodal length scale.47 The final morphology obtained is far from thermodynamic equilibrium and often governed by the kinetics of the process. Demixing of a spin-cast polymer blend can be attributed to different substrate preferences of the component polymers and the different solubility of them in a common solvent.48,49 Mansky et al. showed that the PS wets over a grafted PS-r-PMMA brush, if the fraction of the styrene is more than ∼0.7 in the tethered brush.50 The interfacial energy difference, Δγ = γPS–brush − γPMMA–brush ≈ 0 when the fraction of Styrene in the tethered brush is ∼0.6 that renders the surface neutral to both PS and PMMA. Here, γPS–brush (γPMMA–brush) represent the interfacial energy between PS (PMMA) and the grafted PS-r-PMMA brush.
In the view of the above discussion, here in this article, we have investigated the morphological evolution of PS/PMMA blend on an untethered labile polymer (PS, PMMA, PS/PMMA blend and PS-r-PMMA copolymer) layer of different thickness. To achieve the fast patterning of polymer in contrast to the conventional thermal dewetting, the non-equilibrium kinetics of morphological evolution is probed for a relatively short duration (∼12–15 min) to attain a high temperature of ∼300 °C called rapid thermal annealing (RTA). The article is organized as follows: after the experimental procedure described in the next section, Results and discussion section begins with few characterizations of the process parameters which are crucial to validate the results. Then the morphological evolutions of as cast and annealed polymer blend over different polymer settings are discussed. Next, based on the findings, fabrication of a complex hierarchical patterns is demonstrated. Lastly, concluding remarks are offered with future direction of this study.
2 Materials and methods
2.1 Preparation of polymer solutions
A homogeneous 1% (by wt) solution of random copolymer PS-r-PMMA (Sigma Aldrich, average Mw 100![[thin space (1/6-em)]](https://www.rsc.org/images/entities/char_2009.gif) 000–150
000–150![[thin space (1/6-em)]](https://www.rsc.org/images/entities/char_2009.gif) 000, styrene 40 mol%) was prepared by dissolving the polymer in toluene. Likewise, the 1% solutions of PS (Sigma Aldrich, Mw = 192
000, styrene 40 mol%) was prepared by dissolving the polymer in toluene. Likewise, the 1% solutions of PS (Sigma Aldrich, Mw = 192![[thin space (1/6-em)]](https://www.rsc.org/images/entities/char_2009.gif) 000) and PMMA (Sigma Aldrich, Mw = 120
000) and PMMA (Sigma Aldrich, Mw = 120![[thin space (1/6-em)]](https://www.rsc.org/images/entities/char_2009.gif) 000) were prepared in toluene (Sigma Aldrich). In order to prepare a homogeneous blend of PS–PMMA, separate solutions of PS (1 wt%) and PMMA (1 wt%) in toluene were prepared and mixed thoroughly with PS
000) were prepared in toluene (Sigma Aldrich). In order to prepare a homogeneous blend of PS–PMMA, separate solutions of PS (1 wt%) and PMMA (1 wt%) in toluene were prepared and mixed thoroughly with PS![[thin space (1/6-em)]](https://www.rsc.org/images/entities/char_2009.gif) :
:![[thin space (1/6-em)]](https://www.rsc.org/images/entities/char_2009.gif) PMMA: 40
PMMA: 40![[thin space (1/6-em)]](https://www.rsc.org/images/entities/char_2009.gif) :
:![[thin space (1/6-em)]](https://www.rsc.org/images/entities/char_2009.gif) 60 volume ratio.
60 volume ratio.
2.2 Preparation of polymer thin film
A polymer solution was spin coated at 5000 rpm for 2 min over cleaned silicon wafers (N. J. International Corporation, India) of 1 cm × 1 cm dimensions. Before spin coating, the silicon wafers (〈100〉) were cleaned using Piranha solution consisting of H2SO4 and H2O2 in the volume ratio of 80![[thin space (1/6-em)]](https://www.rsc.org/images/entities/char_2009.gif) :
:![[thin space (1/6-em)]](https://www.rsc.org/images/entities/char_2009.gif) 20. The prepared films were left at room temperature for 12 h in a vacuum desiccator to get rid of the excess solvent. This will serve as the underlayer thin film. Subsequently, a second layer of polymer was spin coated over the first layer at 2500 rpm for 2 min. Table 1 shows the concentrations of polymer used to prepare the films and corresponding film thicknesses are reported.
20. The prepared films were left at room temperature for 12 h in a vacuum desiccator to get rid of the excess solvent. This will serve as the underlayer thin film. Subsequently, a second layer of polymer was spin coated over the first layer at 2500 rpm for 2 min. Table 1 shows the concentrations of polymer used to prepare the films and corresponding film thicknesses are reported.
| S. no. | Under layer | Thickness (nm) | Upper layer | Total Thickness (nm) (under layer + upper layer) |
|---|---|---|---|---|
| a Spin dewetted structures.b Overall polymer concentration that includes both PS and PMMA. | ||||
| 1 | 0.5% PS | 17.02 ± 0.28 | 1% blendb | a |
| 2 | 0.5% PMMA | 19.72 ± 0.11 | 1% blendb | 96.48 ± 0.22 |
| 3 | 0.5% blendb | 23.48 ± 0.55 | 1% blendb | 95.74 ± 0.21 |
| 4 | 0.5% RCP | 22.32 ± 0.13 | 1% blendb | 97.89 ± 0.16 |
| 5 | 1% PS | 53.6 ± 0.18 | 1% blendb | a |
| 6 | 1% PMMA | 46.87 ± 0.26 | 1% blendb | 120.16 ± 0.04 |
| 7 | 1% blendb | 52.78 ± 0.47 | 1% blendb | 120.25 ± 0.06 |
| 8 | 1% RCP | 48.82 ± 0.56 | 1% blendb | 119.53 ± 0.13 |
2.3 Rapid thermal annealing (RTA)
All the bilayer systems were thermally annealed by raising the temperature rapidly up-to 300 °C on a hot plate. When the 300 °C is attained, the system was allowed to remain at that temperature for 30 s and thereafter, cooled down by natural convection to room temperature of 23 °C.The temperature profile was monitored using an IR thermometer (Fluke 59 MAX, 650 nm laser). The complete process is shown in Fig. 1. Here one point to note that during RTA, the polymer films remain above its glass transition temperatures (∼100 °C for PS and ∼105 °C for PMMA) for about ∼12–15 min. This time frame is not sufficient to achieve the thermodynamic equilibrium state, even though the maximum temperature is much higher than the glass transition temperature of the polymer. This study is aiming given the smaller time window, how the morphological variation took place for different underlayer settings so that it can be implemented as a faster patterning tool. Moreover, there is a possibility of considerable thermal degradation if the temperature is maintained at a high temperature for a longer duration.
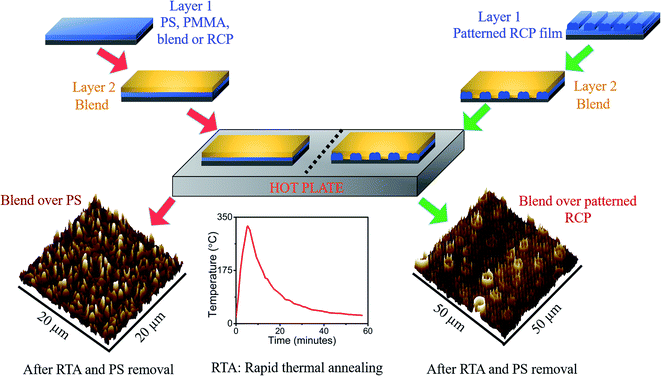 | ||
| Fig. 1 The schematic depicts the protocol adopted for the study of phase separation over different types of polymer layer. | ||
2.4 Preferential dissolution of polymer
The RTA allowed polymer chains to self-organize and PS/PMMA segregate to form micro domains. To get the insight about the self-organization mechanism after RTA, selective solvent etching of the sample was performed. In this process, the polymer thin film of PS/PMMA blend and/or RCP was immersed in a solvent that selectively removes only one of the component polymers present, keeping another polymer structures intact. Here we used acetic acid to wash away PMMA domains and cyclohexane for the removal of PS regime. The immersion was carried out in 25 mL of appropriate solvent for 5 min without any stirring or sonication. For samples with hierarchical patterns (discussed later), the immersion time was 10 min. After immersion, a slow stream of nitrogen was used to remove residual solvent from the samples. Subsequently, the samples were vacuum dried at 60 °C for 6 h.2.5 Preparation of complex multiscale structures
For the complex pattern, 1% solution of PS-r-PMMA RCP was spun coat (spin speed was maintained at 5000 rpm for 2 min) over a clean Si wafer. The film thickness of 48 nm was confirmed by ellipsometric measurement. A structured aluminium foil was peeled off from a compact disk (CD) to use it as a flexible stamp with alternate lines of grooves and crests with periodicity, width and height of about 1.6 μm, 800 nm and 120 nm respectively.51 This flexible CD foil was carefully placed on the thin RCP film prepared and sandwiched between two glass slides with the help of a pair of binder clips to induce uniform pressure. The whole set up then heated over 120 °C for 12 h to induce capillary force lithography (CFL). The film then cooled down to room temperature and the foil was removed carefully. Based on the thickness of the film and the intensity of the applied pressure different types such as inverted “ω”, “u” shaped or complete negative replica of the stamp can be achieved.52 Over this patterned RCP film, PS–PMMA blend was coated at 2500 rpm for 2 min from 1% toluene solution.2.6 Characterization
Surface morphology of the samples was analyzed using atomic force microscopy (AFM, Bruker, Innova series) using sharp-edged antimony doped silicon tips (TESPA-V2, Bruker) having a resistivity of 0.01–0.025 ohm cm, frequency 320 kHz and force constant 42 N m−1. The scan rate was maintained at 0.7–0.8 Hz in tapping mode. Raman spectroscopy was performed using Laser micro-Raman system (Horiba Scientific, LabRam HR Evolution Raman Spectrometer) using 532 nm laser beam. Thermogravimetric (TGA) analysis was performed using TG 209 F1 Libra, Netzsch, Germany, with 10 mg of sample and a heating rate of 10 °C min−1 under nitrogen gas flow (purge: 40 mL min−1, protective: 20 mL min−1) in an alumina crucible. TGA was also performed in the experimental condition, i.e. in the presence of air and similar results are obtained. The TGA in the presence of air is shown in Section S1 of the ESI.† DSC of the polymer samples was performed using DSC 3500 Sirius Netzsch, Germany. The thickness of the composite bilayer films was measured using an ellipsometer (EP3 Nanofilm, Accurion, Germany) with the Cauchy model for fitting the data.3 Results and discussions
Before going on to describe the morphological evolution of the thin film in the bilayer polymer settings and the complex patterning, it is important to discuss few parameters such as dissolution characteristics of the polymers, extent of degradation of the polymers due to RTA, etc. which is relevant to this study and will be corroborated at the appropriate places.3.1 Dissolution characteristics
Known amount of each polymer (PS, PMMA and PS-r-PMMA) was taken in specific amount of toluene and the weight of the polymer was monitored with time. Before each weight measurement, the solvent was decanted and left-over polymer was dried in a vacuum desiccator. The percentage weight loss per mL of solvent was estimated and the whole process was performed with and without stirring conditions. The dissolution characteristics (Fig. 2) reveal that within 2 min the percentage dissolution of polymer is less than 1% per mL of pure toluene even in stirring condition. This ensures that the dissolution of underlying polymer thin film during the spin coating of the second layer is almost negligible given that the polymer solution used during second spin coating is in the order of μL range, loaded with 1% polymer.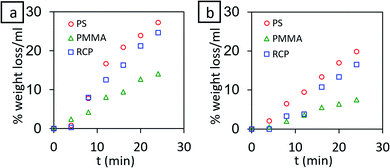 | ||
| Fig. 2 % weight loss per mL of toluene for PS, PMMA and PS-r-PMMA (RCP) (a) with stirring (b) without stirring. | ||
3.2 Chemical stability of polymers
As the fast thermal dewetting process involve very high temperature, it is essential to characterize the extent of degradation of polymer due to RTA. To achieve this, Thermogravimetric analysis (TGA) and Raman spectroscopic study were performed on the polymer sample.RCP, on the other hand, showed a single decomposition step starting from 310 °C to 410 °C. Even though RCP possesses PS and PMMA components, a single decomposition temperature of RCP is due to the strong covalent bond present between PS and PMMA domains. The TGA at experimental condition also shows that the polymers are stable till 300 °C (see Section S1 in ESI†). DSC results, shown in Fig. 3a–c, also support this observation.
3.3 Blend over PS underlayer
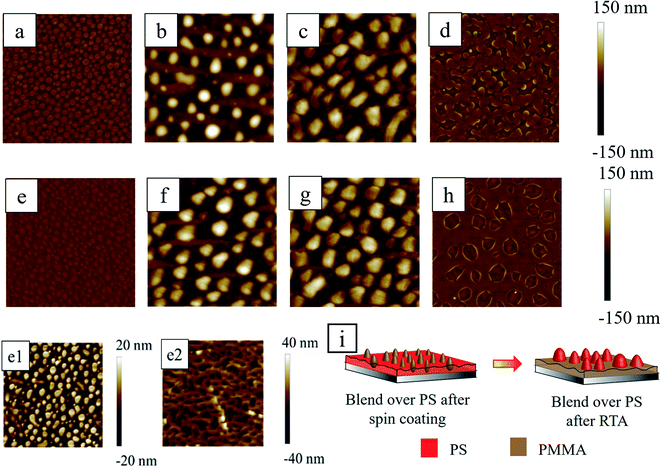
It is important to examine the morphology of the spun-cast film before thermal annealing, to check the stability of the bilayer film. The first and second rows of Fig. 5 show the topography images from AFM at the different stages (as-cast, thermally annealed, acetic acid treated and cyclohexane treated) of PS/PMMA blend over the thin (∼17 nm) and thick (∼54 nm) PS film, respectively (see Section S2 of ESI† for the AFM phase images). It should be noted that before the spin coating of the second layer, the first PS layer was left for 12 h in a vacuum desiccator to remove the solvent from the film. During spin coating of the PS/PMMA blend solution (upper layer) over the dry PS film, there is a possibility that the toluene from the spin coated polymer blend layer might diffuse through the PS underlayer and soften or dissolve the film. However, the duration of the spin was merely 2 min and within that time span, the diffusion through the underlying polymer layer to reduce the viscosity of that layer was almost negligible. To validate this fact, one experiment was performed with the striped pre-patterned underlying RCP polymer film, on top of which polymer blend solution in toluene was spin coated at identical conditions of all the other experiments. At this stage, AFM revealed the flat morphology of the top PS/PMMA blend film. Upon selective solvent etching of polymer, the underlying directional striped pattern was revealed. This implies that the second spin coating of the polymer blend did not disrupt or dissolve the underlying polymer. That being stated, it is undeniable that there must be some degree of mixing between the top and underlying layers, but that might be negligible due to a short duration of spin coating and fast evaporation of solvent from the top layer. A dissolution study in Section 3.1 revealed that the percentage loss of the polymer is ∼0.5%/mL, ∼1%/mL, and ∼0.2%/mL of toluene within 2 min in stirring conditions for PS, PMMA and RCP respectively (Fig. 2).Induced by rapid evaporation of solvent, during spin coating of the upper layer, the polymers phase separated and led to the formation of isolated PMMA islands embedded in the PS matrix. The PMMA islands were protruded out of the PS matrix with height of ∼20–25 nm (Fig. 5(e and e1)). The Hildebrand solubility parameters for PS, PMMA and toluene are δPS = 9.1 cal1/2 cm−3/2, δPMMA = 9.3 cal1/2 cm−3/2, δtol = 8.9 cal1/2 cm−3/2 respectively.59,60 The relatively close values of the Hildebrand parameters of PS and toluene suggest that PS has more tendency to be solubilized in toluene compared to PMMA. This is corroborated by the macroscopic dissolution study, discussed earlier in Section 3.1. The PMMA chains get deprived of toluene due to lesser affinity and get solidified in the form of mounds thereby forming sea-islands like morphology. This ‘PMMA mound in PS’ morphology was verified by dissolving the PMMA phase preferentially by immersing the sample in acetic acid for 5 min. The morphology of the PMMA removed sample (Fig. 5(e2)) revealed that the continuous matrix of PS comprised of holes having the depth of ∼10–20 nm, which were filled with the PMMA before washing with acetic acid.61–63
The number density, wavelength, and average diameters of the embedded mounds of PMMA were found to be around 0.725/μm2, 1.27 ± 0.27 μm and 0.85 ± 0.28 μm, respectively on the thinner PS underlayer and almost similar feature characteristics (number density (0.96/μm2), wavelength (1.31 ± 0.27 μm) and average diameters (0.61 ± 0.18 μm)) were obtained from thicker PS underlayer. PMMA in the air has marginally higher surface tension (γPMMA = 29.2 mJ m−2) compared to PS (γPS = 28.9 mJ m−2)64 which leads to the formation of small isolated mounds of PMMA on PS.
During RTA, as both the polymers were in a molten state at this high temperature of ∼300 °C, the PMMA phase preferentially wetted the underlying silicon oxide surface due to its higher affinity to PMMA compared to PS.65,66 At this stage, the inversion of the morphology took place and isolated PS mounds were formed and embedded within the PMMA matrix (Fig. 5b and f). Fig. 5c, g and d, h show the preferentially removed PMMA and PS domains from thermally annealed film (Fig. 5b and f) by washing it in acetic acid and cyclohexane respectively. These figures ascertain that indeed the morphological phase inversion took place. Similar phase inversion behavior of PS/PMMA system was reported earlier while thermally annealed at ∼156 °C for more than 85 min in contrast to present work.61 The number density, wavelength and average diameters of the morphology are summarised in Table 2. From Table 2, it is clear that after RTA, the morphological characteristics of the PS mounds although appear similar, but the underlying arrangement of PS domains within PMMA matrix is different in case of thin (Fig. 5d) and thick (Fig. 5h) PS underlayer. The area coverage by the base of the PS mound is ∼17.41% and of labyrinth like structure for sample with low PS fraction (relatively thin PS underlayer), whereas, the same for the thick PS underlayer is about 28.11% with irregular circular structure.
| Blend over 17 nm PS under layer | Blend over 53 nm PS under layer | |||
|---|---|---|---|---|
| After spin coating (PMMA mounds) | After RTA (PS mounds) | After spin coating (PMMA mounds) | After RTA (PS mounds) | |
| Number density (/μm2) | 0.725 | 0.09 | 0.96 | 0.075 |
| Wavelength (μm) | 1.27 ± 0.27 | 3.29 ± 0.67 | 1.31 ± 0.27 | 4.25 ± 0.66 |
| Average diameter (μm) | 0.85 ± 0.28 | 1.58 ± 0.49 | 0.61 ± 0.18 | 2.11 ± 0.32 |
Along with that, from Table 2 it is clear that the number density is slightly higher and the wavelength is smaller for PS domains after RTA in the case of the thin PS underlayer than its thicker analog. It is already known that the dewetting wavelength (λ) of a thin polymer film in the air is a function of its thickness h as λ ∼ h. Thus with increasing film thickness the λ increases and the number density decreases.47 We suspect that in this bilayer system, similar spinodal decomposition like phase separation took place in the case of thin and thick PS underlayer. The wavelength of spinodal decomposition thus smaller for thinner PS underlayer with smaller footprint of the PS domains.
3.4 Blend over PMMA underlayer
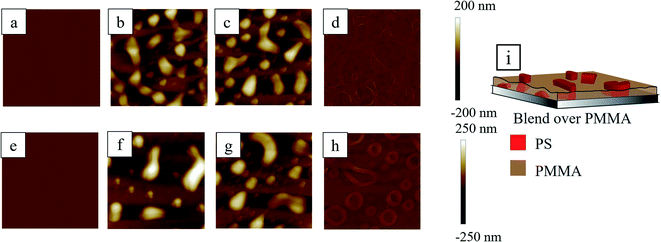
Unlike the PS underlayer, PMMA stabilized the uniform film of PS/PMMA blend, irrespective of the underlying PMMA film thickness (Fig. 6a and e) due to the marginally higher surface energy of PMMA compared to PS. The first and second rows of Fig. 6 represent the AFM topographical images of blend on thin (∼20 nm) and thick (∼47 nm) PMMA underlayer, respectively, at different stages of treatment (see Section S2 of ESI† for the AFM phase images). The uniform bilayer film upon RTA, forms interconnected PS mounds protruded out of PMMA matrix due to the higher affinity of PMMA towards the silicone oxide, PMMA remained adhered with the substrate and allowed PS to reorganize in the PMMA matrix.These interconnected PS mounds appear as small ribbon-like structures. As the overall fraction of the PMMA is lower for Fig. 6b compared to the Fig. 6f, there are larger numbers of smaller PS mounds observable in the former case. In Fig. 6f, the PS mounds are submerged under the thick PMMA layer except for the few taller structures. The submerged smaller PS structures were revealed when both the samples, with thin and thick PMMA underlayer, were washed with acetic acid (Fig. 6c and g). In the case of a thin PMMA underlayer, the smaller PS structures were visible even before washing with the acetic acid. This is evident from the characteristic length scales (average distance between two adjacent features) of the ribbon like structures, estimated from Fig. 6b and f, which are found to be 4.13 ± 1.21 μm and 6.48 ± 0.74 μm respectively. The features of the connected mounds imply that the phase separation was incomplete within this short period of RTA.
The base footprints of the PS structures were revealed when washed with cyclohexane and as expected, the percentage coverage of the footprint of PS domain was found to be higher in thin PMMA underlayer compared to the thick PMMA underlayer due to higher PS fraction in the former case (Fig. 6d and h).
3.5 Blend over blend underlayer
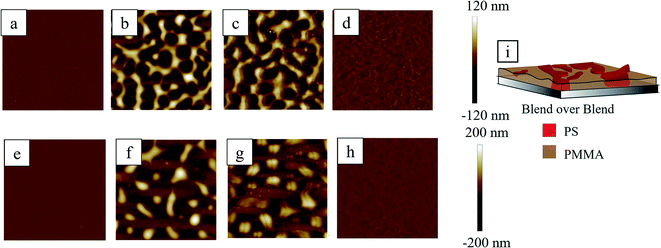
Coating of PS/PMMA blend over the thin (first row, Fig. 7) and thick (second row, Fig. 7) PS/PMMA blend underlayer found topographically uniform (Fig. 7a and e) with a slight undulation of ∼10 nm (see Section S2 of ESI† for the AFM phase images). When subjected to RTA, the prominent bicontinuous structure was observed in the case of a thin blend underlayer (Fig. 7b), whereas somewhat isolated elongated mounds (Fig. 7f) were noticed in the case of a thick blend underlayer. Washing with cyclohexane (Fig. 7d and h) revealed that the topographically protruded bicontinuous structures in Fig. 7b and isolated-elongated mounds in Fig. 7f were of PS as depicted in schematic (Fig. 7i). After removal of PMMA from the dewetted film, by washing with acetic acid, the extent of continuity of the PS structures in Fig. 7c and g were found more compared to that observed in Fig. 7b and f. This suggests that some fraction of the connected structure of PS was submerged under PMMA after RTA. PMMA has an inherent tendency to be adhered to the silicon oxide substrate compared to PS. During RTA, the phase separation of the PS and PMMA was incomplete and formed the bicontinuous phase as far as thin underlayer was concerned. On the other hand, relatively more phase separation occurred for the thicker underlayer compared to the thinner one. This implies that the apparent viscosity of the polymer blend near the substrate is much reduced in case of thicker underlayer compared to the thinner blend underlayer.673.6 Blend over RCP underlayer
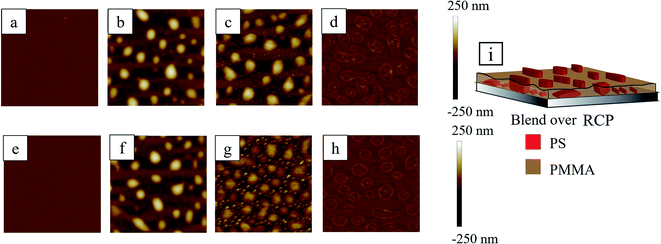
In case of PS-r-PMMA (RCP) underlayer, irrespective of the underlayer thickness, the morphology of the upper PS/PMMA blend surface after the spin coating was almost uniform but with small undulation (∼12 nm) having bicontinuous like structure (not evident from the Fig. 8a or 8c due to larger depth scale (−250 nm to 250 nm)) (see Section S2 of ESI† for the AFM phase images). This smaller length scale bicontinuous structure also contains some isolated domains of dot like structures. This suggests that the underlayer RCP self-organises with smaller length scale and that influences the upper PS/PMMA blend to phase separate with smaller length scale, i.e. the underlying bicontinuous pattern of RCP bleeds through the upper PS/PMMA blend layer.The samples when subjected to RTA, the upper blend layer phase separates and forms larger PS droplet like structures in PMMA matrix. Within the underlayer, RCP domains also self-assemble to form isolated PS dot like structures within PMMA matrix. The smaller length scale of the morphology within this underlayer is attributed to the restrictive movement of the polymers due to tethering between the PS and the PMMA blocks. The self-organization and phase separation of PS in underlayer with larger domain would cost the fission energy of the covalent bonds. This energy penalty of bond fission is huge compared to the global energy minimization of the system by the preferential wetting of silicon oxide by PMMA against PS. Thus, underlayer RCP maintained the smaller length scale and optimized reorganisation keeping the bonds among the PS blocks and the PMMA blocks intact.
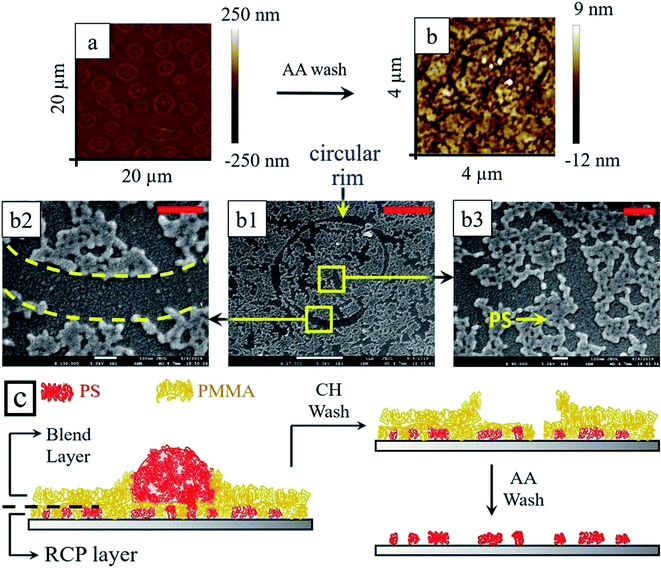
When the thermally annealed blend/RCP bilayer samples (Fig. 8b and f) were washed with selected solvent to remove particular polymer preferentially, fascinating hierarchical morphology with two different length scales was obtained. Relatively smaller length scale structures emerged from the underlying RCP layer, whereas, morphology with large length scale was dictated by the upper blend layer. Upon selective extraction of PMMA from the blend/RCP bilayer film using acetic acid, the large mound structure (from blend) as well as small tiny droplets of PS (from RCP) remained over the silicon oxide substrate (Fig. 8c and g). This itself produces two different length scales of the morphology (L1 ∼ 4 μm and L2 ∼ 780 nm) for both thin and thick underlayer. Similarly, when selective dissolution of PS was performed by immersing the bilayer sample into cyclohexane, the remnant PMMA morphology revealed a smooth surface with rim enclosed regime. The rim enclosed regime indicates the footprint of the PS droplet, which was present earlier before washing with the cyclohexane. It is also interesting to note that the enclosed rim area contains a few tiny droplets like morphology of PMMA. This intrigued us to examine this surface more closely and we hypothesized that a very thin layer of PMMA (from blend) made a protective layer upon the RCP underlayer. During this process, it might also be possible that PS from blend also remains adhered to some of the PS segments from the RCP. Large mounds of PS, (from blend only), were residing on top of the protective layer of PMMA and protruded out of the PMMA matrix. This justifies the fact that after washing the thermally annealed sample with cyclohexane, inside the rim, tiny droplet like structures were observed. These small droplet-like structures are smaller PS structures from RCP covered with the PMMA protective layer. Outside the rim, a thick PMMA layer from the blend forms the matrix. So, at this stage (Fig. 8d and h), if the sample is treated with acetic acid, to remove the protective PMMA layer, it should reveal the underlying PS morphology from the RCP. We washed the sample with acetic acid and indeed, there exists small PS domains within a closed circular trench just in the position of the PMMA rim (Fig. 9) and also outside the rim.
Based on the rich morphology obtained by the combination of the RCP and the blend of the constituent polymers, as discussed above, we opted to fabricate a complex hierarchical ordered morphology by employing a soft lithographic technique.
3.7 Complex hierarchical patterning
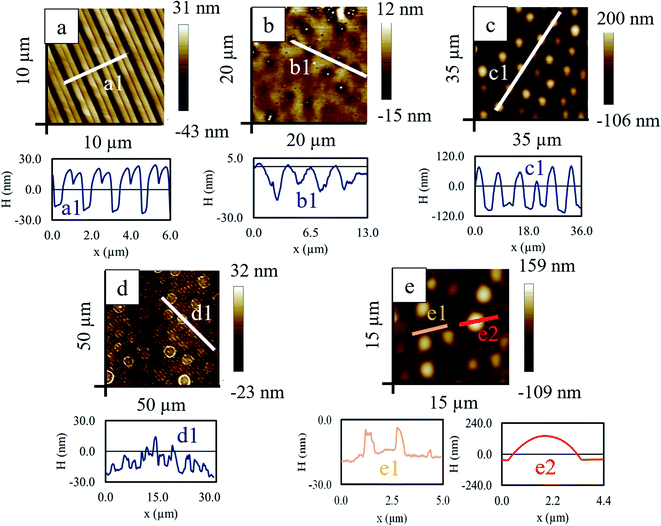
A thin RCP film of ∼49 nm was prepared from 1% (weight percentage) toluene solution on a silicon wafer and kept in a vacuum desiccator for 12 h so that the excess solvent was evaporated. A flexible aluminium stamp having alternate stripe and groove with a periodicity of ∼1.5 μm was placed over the film and sandwiched between two glass slides with a clamp and was kept inside an oven above the glass transition temperature (Tg ∼ 96 °C) for 16 h. Above Tg, due to low viscosity and increased mobility, the liquid RCP partially filled the empty space of the groove of the stamp. Depending on the pressure applied and the thickness of the parent RCP film, different patterned morphology can be obtained by this capillary force lithography (CFL) method. Upon cooling to room temperature, the imprinted pattern was solidified in the RCP layer (Fig. 10a). On this double stripe patterned RCP, 1% PS/PMMA blend solution in toluene was spun coat. Although premature, but at this stage itself, wherever the film thickness is less, few holes were formed and these holes were vaguely guided by the underlying patterned RCP layer (Fig. 10b). Next, RTA of this composite bilayer film-initiated phase separation and morphology revealed that the PS mounds protruded out of the PMMA matrix (Fig. 10c). During RTA, a few phenomena happened almost simultaneously:• First, the double humped striped structures of RCP merged and formed a single striped pattern of RCP.
• Second, a thin protecting layer of PMMA covers the patterned RCP layers but with ruptures at the protruded ridges, exposing the underlying RCP to the PS and PMMA of the blend.
• Third, on this PMMA, large dewetted PS mounds were formed, surrounded by rims of PMMA.
Washing of PS with cyclohexane leads to the formation of complex multiscale patterns – aligned elongated drop (width ∼ 700 nm) like morphology with a smaller length scale of ∼1.5 μm and ring like structure of diameter ∼3.5 μm having larger separation distance of ∼6.4 μm (Fig. 10d). Selective removal of the PMMA from the thermally annealed sample reveals PS droplet of height about 190 nm and diameter of ∼3.5 μm (Fig. 10(e2)) in the background of aligned and elongated PS droplet (originated from the underlying RCP) of smaller length scale (periodicity ∼ 1.5 μm, Fig. 10(e1)).
4 Conclusions
In this article, for the first time, we have uncovered the rich morphological evolution of PS/PMMA blend polymer on labile PS-r-PMMA upon rapid thermal annealing at high temperature. A thin protective layer of PMMA from blend wets the underlying RCP and on this thin layer, PS from blend forms dewetted mounds like structure. Apart from this important finding, the morphology of blend polymer upon spin coating and subsequent RTA was systematically discussed while underlayer is of PS or PMMA or PS/PMMA blend. It is found that while the PMMA underlayer stabilizes the PS/PMMA blend polymer, PS underlayer promotes spin dewetting of the blend layer. Upon RTA, the phase inversion took place on PS underlayer system as reported earlier by Li et al.61 In the present report, however, the annealing temperature was high (∼300 °C) enough to reduce the morphological evolution time (∼12–15 min). Here we probed the kinetically driven fast morphological evolution of the polymer thin film in bilayer settings. Finally, an easy and low-cost fabrication avenue for multi length-scale complex patterns was demonstrated exploiting the fast evolution of PS/PMMA blend over topographically patterned RCP layer while subjected to RTA. From this PS–PMMA combination, only by switching the selective solvent to etch out one polymer component, one can fabricate complementary patterns. The methodology described will be helpful for complex lithography of soft functional polymers with micro/nano scale features that appeal to many industrial and technologically challenging applications.Author contributions
PSGP and AP designed the experiment. AP and KM performed the experiments. The manuscript was written through contributions from all the authors. All authors have given their approval to the final version of the manuscript.Conflicts of interest
The authors hereby declare no conflict of interest.Acknowledgements
PSGP thanks DST SERB, Grant no. ECR/2015/000447, CRG/2019/000118 and MeitY – grant no. 5(9)/2012-NANO for financial aids. Authors also thank Mr Md. Tarik Hossain, Department of Physics, IIT Guwahati and Mr K. Dharmalingam, Department of Chemical Engineering, IIT Guwahati for assistance in Raman Spectroscopy and Thermogravimetric analysis of the samples.References
- L. Chen, W. A. Phillip, E. L. Cussler and M. A. Hillmyer, J. Am. Chem. Soc., 2007, 129, 13786–13787 CrossRef CAS PubMed.
- S. Y. Yang, I. Ryu, H. Y. Kim, J. K. Kim, S. K. Jang and T. P. Russell, Adv. Mater., 2006, 18, 709–712 CrossRef CAS.
- W. A. Phillip, J. Rzayev, M. A. Hillmyer and E. L. Cussler, J. Membr. Sci., 2006, 286, 144–152 CrossRef CAS.
- G. Liu, J. Ding, A. Guo, M. Herfort and D. Bazett-Jones, Macromolecules, 1997, 30, 1851–1853 CrossRef CAS.
- R. M. Dorin, W. A. Phillip, H. Sai, J. Werner, M. Elimelech and U. Wiesner, Polymer, 2014, 55, 347–353 CrossRef CAS.
- O. Hellwig, J. K. Bosworth, E. Dobisz, D. Kercher, T. Hauet, G. Zeltzer, J. D. Risner-Jamtgaard, D. Yaney and R. Ruiz, Appl. Phys. Lett., 2010, 96, 052511–052513 CrossRef.
- S. Xiao, X. Yang, E. W. Edwards, Y. H. La and P. F. Nealey, Nanotechnology, 2005, 16, S324–S329 CrossRef PubMed.
- M. Ma, R. M. Hill, J. L. Lowery, S. V. Fridrikh and G. C. Rutledge, Langmuir, 2005, 21, 5549–5554 CrossRef CAS PubMed.
- J. T. Han, X. Xu and K. Cho, Langmuir, 2005, 21, 6662–6665 CrossRef CAS PubMed.
- P. Pareo, G. L. De Gregorio, M. Manca, M. S. Pianesi, L. De Marco, F. Cavallaro, M. Mari, S. Pappadà, G. Ciccarella and G. Gigli, J. Colloid Interface Sci., 2011, 363, 668–675 CrossRef CAS PubMed.
- K. Liu and L. Jiang, Nano Today, 2011, 6, 155–175 CrossRef CAS.
- D. Adak, S. Ghosh, P. Chakraborty, K. M. K. Srivatsa, A. Mondal, H. Saha, R. Mukherjee and R. Bhattacharyya, Sol. Energy Mater. Sol. Cells, 2018, 188, 127–139 CrossRef CAS.
- N. A. Gengec, U. Cengiz and H. Y. Erbil, Appl. Surf. Sci., 2016, 383, 33–41 CrossRef CAS.
- S. Walheim, E. Schäffer, J. Mlynek and U. Steiner, Science, 1999, 283, 520–522 CrossRef CAS PubMed.
- W. Joo, M. S. Park and J. K. Kim, Langmuir, 2006, 22, 7960–7963 CrossRef CAS PubMed.
- K. Hur, Y. Francescato, V. Giannini, S. A. Maier, R. G. Hennig and U. Wiesner, Angew. Chem., Int. Ed., 2011, 50, 11985–11989 CrossRef CAS PubMed.
- A. del Campo and E. Arzt, Chem. Rev., 2008, 108, 911–945 CrossRef CAS PubMed.
- M. Altissimo, Biomicrofluidics, 2010, 4, 026503 CrossRef PubMed.
- A. Verma and A. Sharma, Soft Matter, 2011, 7, 11119–11124 RSC.
- A. S. Holland, P. W. Leech and G. K. Reeves, J. Mater. Sci., 2004, 39, 3505–3508 CrossRef CAS.
- A. Asatekin, M. C. Barr, S. H. Baxamusa, K. K. S. Lau, W. Tenhaeff, J. Xu and K. K. Gleason, Mater. Today, 2010, 13, 26–33 CrossRef CAS.
- A. Biswas, I. S. Bayer, A. S. Biris, T. Wang, E. Dervishi and F. Faupel, Adv. Colloid Interface Sci., 2012, 170, 2–27 CrossRef CAS PubMed.
- S. Y. Chou, P. R. Krauss and P. J. Renstrom, Appl. Phys. Lett., 1995, 67, 3114 CrossRef CAS.
- S. Y. Chou, P. R. Krauss and P. J. Renstrom, Science, 1996, 272, 85–87 CrossRef CAS.
- A. Perl, D. N. Reinhoudt and J. Huskens, Adv. Mater., 2009, 21, 2257–2268 CrossRef CAS.
- M. Wang, H. G. Braun, T. Kratzmüller and E. Meyer, Adv. Mater., 2001, 13, 1312–1317 CrossRef CAS.
- W. M. Lackowski, P. Ghosh and R. M. Crooks, J. Am. Chem. Soc., 1999, 121, 1419–1420 CrossRef CAS.
- Y. Xia and G. M. Whitesides, Annu. Rev. Mater. Sci., 1998, 28, 153–184 CrossRef CAS.
- R. Mukherjee and A. Sharma, ACS Appl. Mater. Interfaces, 2012, 4, 355–362 CrossRef CAS PubMed.
- P. S. G. Pattader, I. Banerjee, A. Sharma and D. Bandyopadhyay, Adv. Funct. Mater., 2011, 21, 324–335 CrossRef CAS.
- S. Srivastava, P. D. S. Reddy, C. Wang, D. Bandyopadhyay and A. Sharma, J. Chem. Phys., 2010, 132, 174703 CrossRef PubMed.
- P. Roy, R. Mukherjee, D. Bandyopadhyay and P. S. Gooh Pattader, Nanoscale, 2019, 11, 16523–16533 RSC.
- N. Arun, A. Sharma, P. S. G. Pattader, I. Banerjee, H. M. Dixit and K. S. Narayan, Phys. Rev. Lett., 2009, 102, 254502 CrossRef CAS PubMed.
- M. D. Morariu, N. E. Voicu, E. Schäffer, Z. Lin, T. P. Russell and U. Steiner, Nat. Mater., 2003, 2, 48–52 CrossRef CAS PubMed.
- E. Schäffer, T. Thurn-Albrecht, T. P. Russell and U. Steiner, Nature, 2000, 403, 874–877 CrossRef PubMed.
- R. Mukherjee and A. Sharma, Soft Matter, 2015, 11, 8717–8740 RSC.
- A. Sharma and G. Reiter, J. Colloid Interface Sci., 1996, 178, 383–399 CrossRef CAS.
- G. Reiter, Phys. Rev. Lett., 1992, 68, 75–80 CrossRef CAS PubMed.
- G. Reiter, Langmuir, 1993, 9, 1344–1351 CrossRef CAS.
- L. Xue, J. Zhang and Y. Han, Prog. Polym. Sci., 2012, 37, 564–594 CrossRef CAS.
- M. C. Orilall and U. Wiesner, Chem. Soc. Rev., 2011, 40, 520–535 RSC.
- F. S. Bates, Science, 1991, 251, 898–905 CrossRef CAS PubMed.
- E. Manias and L. A. Utracki, Polymer Blends Handbook, Springer, 2nd edn, 2014 Search PubMed.
- P. W. Majewski and K. G. Yager, J. Phys.: Condens. Matter, 2016, 28, 403002 CrossRef PubMed.
- C. Sinturel, M. Vayer, M. Morris and M. A. Hillmyer, Macromolecules, 2013, 46, 5399–5415 CrossRef CAS.
- D. U. Ahn, Z. Wang, I. P. Campbell, M. P. Stoykovich and Y. Ding, Polymer, 2012, 53, 4187–4194 CrossRef CAS.
- H. Ogawa, T. Kanaya, K. Nishida and G. Matsuba, Polymer, 2008, 49, 254–262 CrossRef CAS.
- S. Walheim, M. Boltau, J. Mlynek, G. Krausch and U. Steiner, Macromolecules, 1997, 30, 4995–5003 CrossRef CAS.
- D. U. Ahn, Z. Wang, I. P. Campbell, M. P. Stoykovich and Y. Ding, Polymer, 2012, 53, 4187–4194 CrossRef CAS.
- P. Mansky, Y. Liu, E. Huang, T. P. Russell and C. Hawker, Science, 1997, 275, 1458–1461 CrossRef CAS.
- R. Mukherjee, A. Sharma, M. Gonuguntla and G. K. Patil, J. Nanosci. Nanotechnol., 2008, 8, 3406–3415 CrossRef CAS.
- K. Y. Suh, Y. Kim and H. H. Lee, Adv. Mater., 2001, 13, 1386–1389 CrossRef CAS.
- L. E. Manring, Macromolecules, 1989, 22, 2673–2677 CrossRef CAS.
- T. Kashiwagi, A. Inaba, J. E. Brown, K. Hatada, T. Kitayama and E. Masuda, Macromolecules, 1986, 19, 2160–2168 CrossRef CAS.
- N. Brun, I. Youssef, M. Chevrel, D. Chapron, C. Schrauwen, S. Hoppe, P. Bourson and A. Durand, J. Raman Spectrosc., 2013, 44, 909–915 CrossRef CAS.
- A. D. Curtis, A. R. Calchera, M. C. Asplund and J. E. Patterson, Vib. Spectrosc., 2013, 68, 71–81 CrossRef CAS.
- V. K. Thakur, D. Vennerberg, S. A. Madbouly and M. R. Kessler, RSC Adv., 2014, 4, 6677–6684 RSC.
- C. De Rosa, F. Auriemma, C. Diletto, R. Di Girolamo, A. Malafronte, P. Morvillo, G. Zito, G. Rusciano, G. Pesce and A. Sasso, Phys. Chem. Chem. Phys., 2015, 17, 8061–8069 RSC.
- A. F. M. Barton, Chem. Rev., 1975, 75, 731–753 CrossRef CAS.
- H. J. Vandenburg, A. A. Clifford, K. D. Bartle, R. E. Carlson, J. Carroll and I. D. Newton, Analyst, 1999, 124, 1707–1710 RSC.
- X. Li, Y. Han and L. An, Appl. Surf. Sci., 2004, 230, 115–124 CrossRef CAS.
- S. Walheim, M. Böltau, J. Mlynek, G. Krausch and U. Steiner, Macromolecules, 1997, 30, 4995–5003 CrossRef CAS.
- S. Roy and A. Sharma, J. Colloid Interface Sci., 2015, 449, 215–225 CrossRef CAS PubMed.
- X. Liu, N. Bhandaru, M. Banik, X. Wang, A. M. Al-Enizi, A. Karim and R. Mukherjee, ACS Omega, 2018, 3, 2161–2168 CrossRef CAS PubMed.
- S. Roy and A. Sharma, J. Colloid Interface Sci., 2015, 449, 215–225 CrossRef CAS PubMed.
- L. Kailas, B. Nysten and P. Bertrand, Surf. Interface Anal., 2004, 36, 1227–1230 CrossRef CAS.
- S. Pronk, E. Lindahl and P. M. Kasson, Nat. Commun., 2014, 5, 1–7 Search PubMed.
- P. Roy and P. S. Gooh Pattader, Bull. Mater. Sci., 2020, 43, 169 CrossRef CAS.
- N. Bhandaru, P. S. Gooh Pattader, D. Faruqui, R. Mukherjee and A. Sharma, Langmuir, 2015, 31(10), 3203–3214 CrossRef CAS PubMed.
Footnote |
| † Electronic supplementary information (ESI) available. See DOI: 10.1039/d1ra00017a |
| This journal is © The Royal Society of Chemistry 2021 |


