
 Open Access Article
 This Open Access Article is licensed under a Creative Commons Attribution-Non Commercial 3.0 Unported Licence
Designing high energy density flow batteries by tuning active-material thermodynamics†
Shyam K. Pahari a,
Tugba Ceren Gokoglanb,
Benjoe Rey B. Visayasa,
Jennifer Woehla,
James A. Golena,
Rachael Howlanda,
Maricris L. Mayesa,
Ertan Agarb and
Patrick J. Cappillino*a
a,
Tugba Ceren Gokoglanb,
Benjoe Rey B. Visayasa,
Jennifer Woehla,
James A. Golena,
Rachael Howlanda,
Maricris L. Mayesa,
Ertan Agarb and
Patrick J. Cappillino*a
aDepartment of Chemistry and Biochemistry, University of Massachusetts Dartmouth, MA 02747-2300, USA. E-mail: pcappillino@umassd.edu
bDepartment of Mechanical Engineering, Energy Engineering Graduate Program, University of Massachusetts Lowell, Lowell, MA 01854, USA
First published on 29th January 2021
Abstract
The cost of electricity generated by wind and solar installations has become competitive with that generated by burning fossil fuels. While this paves the way for a carbon-neutral electrical grid, short- and long-term intermittency necessitates energy storage. Flow batteries are a promising technology to accommodate this need, with numerous advantages, including decoupled power and energy ratings, which imparts flexibility, thermal stability, and safety. Further, development of robust nonaqueous systems has the potential to greatly improve energy density, approaching that of lithium-ion batteries, while maintaining the advantages of flow systems. Herein we report a breakthrough on a bio-inspired nonaqueous redox flow battery (NRFB) electrolyte, which contains high-concentration active-material and maintains stability during deep cycling for extended time-periods. These advances are reinforced by thermodynamic considerations and computational investigations, which provide a clear path to further improvements. Electrochemical studies confirm that the active-material maintains its high stability at high concentration. This molecular scaffold clears two important hurdles in designing active-materials for nonaqueous electrolytes – low solubility and poor stability – providing an in-road to development of high-performance NRFB systems.
Introduction
Over the last decade, the cost of renewable energy has decreased markedly. Since 2010, the cost of utility-scale energy from photovoltaics has dropped more than 75% to less than $1/W and the price of wind turbines has fallen 58%.1 In many areas of the United States, the levelized cost of electricity from new wind and solar farms is now lower than that from new natural-gas-combined cycle power plants.2,3 Despite these rapid improvements in the economics of renewable energy sources, their intermittency on both short and long time-scales necessitates energy storage. This can be readily illustrated with comprehensive, current grid information made available by the Energy Reliable Council of Texas (ERCOT), which manages ∼90% of the electricity load in Texas.4 Notably, in that market, wind-capacity alone occasionally exceeds 50% of the total grid load.4 On top of this substantial wind capacity, by 2022 ERCOT projects that solar capacity will have increased seven-fold compared to 2019 (see Fig. 1a).4 As shown in Fig. 1b, however, while the availability of renewable energy is increasing, the load on the electrical grid follows a distinct daily pattern that is decoupled from that of solar and wind output. Furthermore, seasonal variability in the grid-load, as depicted in Fig. 1c, highlights the need for longer duration storage, over months or even years.2 As such, energy storage with sufficient capacity and the flexibility to level these short and long-term intermittencies is a vital component of the nascent, renewable energy portfolio.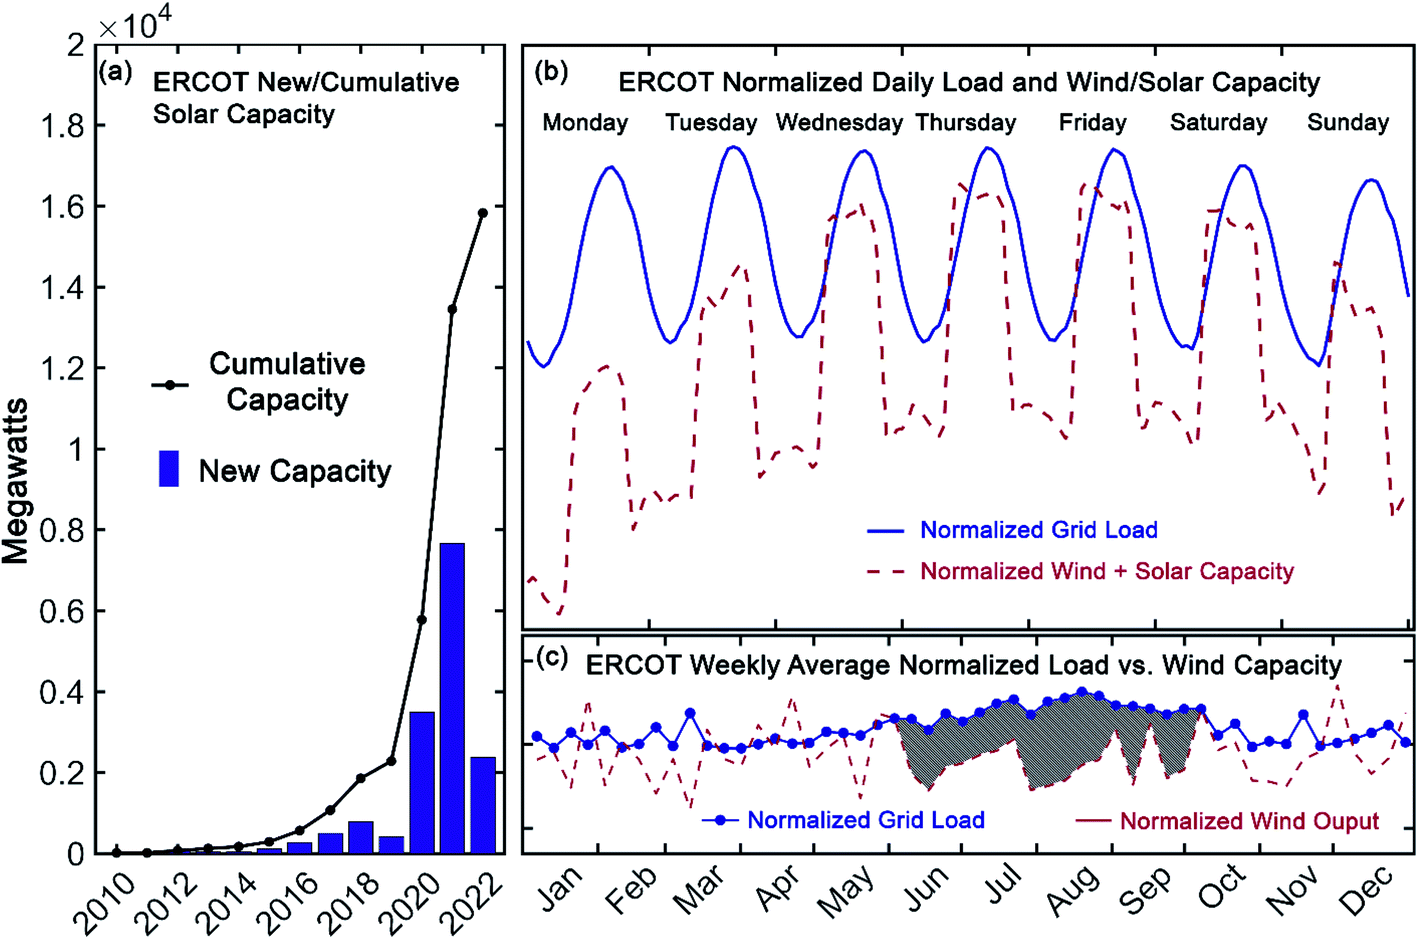 | ||
| Fig. 1 New (bar) and cumulative (line) solar capacity reported by ERCOT (a), normalized grid load and renewable capacity in Texas for July 15–21, 2019 (load and wind) and July 13–19, 2020 (solar) (b), and weekly average normalized grid load and wind output in Texas during 2019 (shaded region highlights the increased grid load during summer months) (c). Data provided by the Energy Reliability Council of Texas in ref. 4. | ||
Among several technologies under development to meet the storage needs of a modern, sustainable electrical grid, redox flow batteries (RFBs) have received considerable recent interest.5 A principal advantage of these systems is their uncoupled power and energy ratings, providing them excellent flexibility for a range of stationary storage applications.6 Seasonal load variations (such as those apparent in Fig. 1c) could be accommodated by high-capacity installations, while simultaneously mitigating short-term, relatively higher power storage requirements (such as those apparent in Fig. 1b). Development of such systems, with capacity for long-duration storage, that can also provide storage for daily cycling, has been identified as an important milestone in achieving zero-carbon electricity goals.2
While the majority of RFB systems studied thus far have been based on aqueous electrolytes,5 the modest electrochemical window in which water is thermodynamically stable to electrolysis has led researchers to explore nonaqueous electrolytes.7 By implementing aprotic solvents, nonaqueous redox flow batteries (NRFBs) expand the thermodynamic potential window at which a flow battery may operate.8 Notwithstanding kinetic stabilization of aqueous systems,9 which allow for metastable electrolytes, if an appropriate NRFB chemistry can be elucidated the energy density of flow batteries could be greatly improved. The need for robust, high energy-density active materials for NRFB electrolytes has led to investigation of an array of organic7,10–21 and metalorganic7,9,14,22–29 redox couples, as well as redox polymers.7,14,30,31 While a recent techno-economic analysis concludes that a pathway exists to cost-effective energy storage based on NRFB, thus far, poor chemical stability, leading to low cyclability and low solubility are key remaining research challenges that have prevented implementation of this technology.32
Recently, a catholyte was reported that meets the challenging chemical-stability requirements of an NRFB system by using a molecule that is produced biologically, rather than one elucidated by human-design.33 Biosynthesis of the vanadium compound known as Amavadin (see Fig. S1†) evolved naturally in mushrooms from the Amanita genus, under selection pressure for strong and specific vanadium binding, resulting in the most stable vanadium species that has been reported to date.33 The analogous, dianionic coordination compound, vanadium(4+) bis-hydroxyiminodiacetic acid ([VBH]) can be synthesized at large scale, using inexpensive reagents and exhibits high chemical stability, even under cycling at high current and to deep states-of-charge.34 This stability provides a robust system with which to explore the deep parameter space of solvents, salts and cell components that make NRFBs such an attractive frontier for energy storage research.
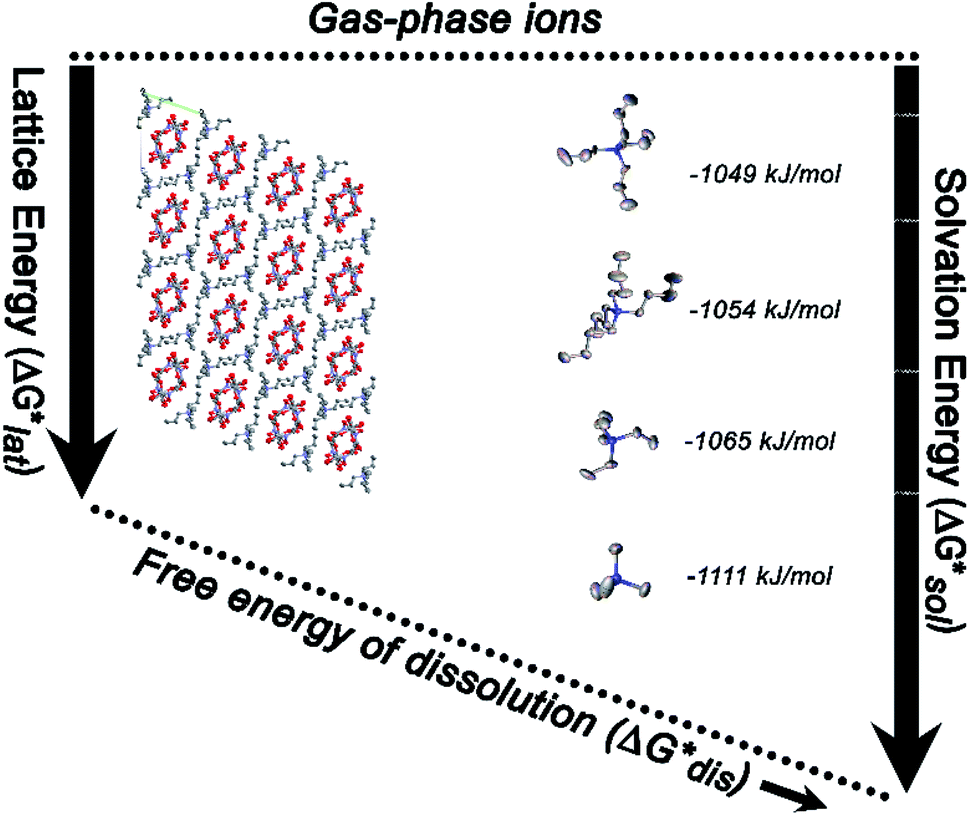
Herein we report a breakthrough in the design and synthesis of VBH-based NRFB active-materials that greatly improves on their solubility, which is recognized as a critical parameter in determining energy density,32,35 and demonstrates their potential as a scaffold for development of next-generation flow battery electrolytes. These gains are supported by electronic structure calculations and placed in a theoretical framework that considers active material solubility (SVBH), resulting from the interplay between two thermodynamic quantities: the free-energy of active-material/solvent interactions ( , Fig. 2) and free-energy of the active-material crystal lattice (
 , Fig. 2).35–37 This framework provides a design-strategy for further gains in VBH solubility and lays a blueprint for tuning VBH concentration in various electrolyte compositions. Crucially, electrochemical studies, also reported herein, demonstrate that VBH maintains high stability in concentrated electrolytes during cycling to deep state-of-charge, over an extended duration.
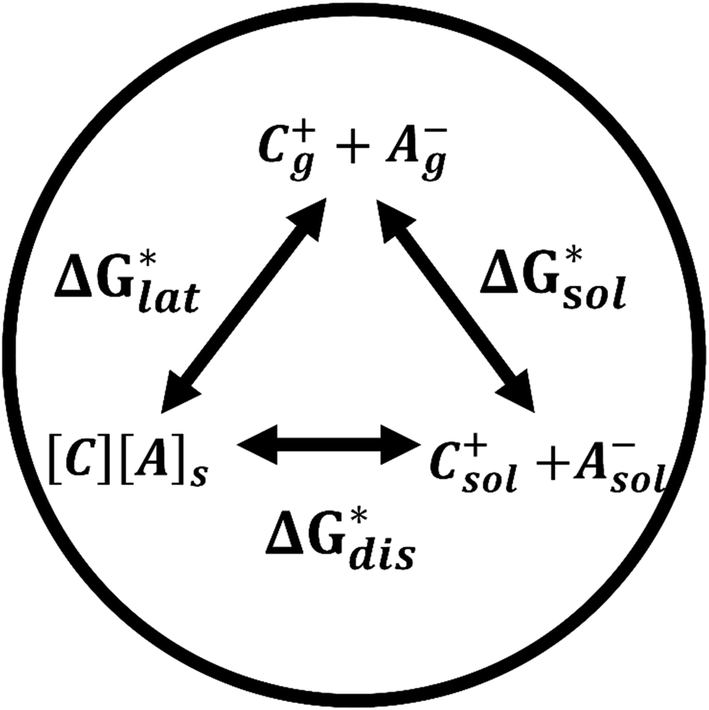 | ||
Fig. 2 Schematic representation of the thermodynamic cycle for dissolution of [cation][VBH] complexes. The free-energy of dissolution  determines the solubility of the complex and results from the interplay between the free-energy of the lattice determines the solubility of the complex and results from the interplay between the free-energy of the lattice  and that of stabilizing solute–solvent interactions in solution and that of stabilizing solute–solvent interactions in solution  . . | ||
Results and discussion
[VBH] cation metathesis
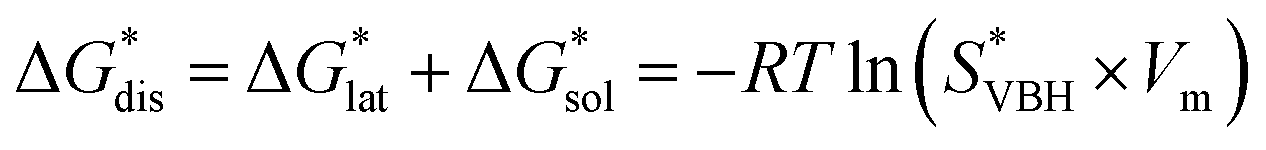
While the calcium(2+) salt of [VBH] (CaVBH) can be conveniently prepared at large scale, with high yield, this compound exhibits low solubility in all solvents investigated.33,34 We reasoned that replacing the calcium ion with alkylammonium cations would significantly alter solubility by affecting solute–solvent interactions in the electrolyte as well as anion–cation interactions in the crystalline solid. The thermodynamics of active-material dissolution are governed by the following equation:35–37
 | (1) |
In this equation,  refers to the molar solubility of a [cation][VBH] complex,
  refers to the free-energy of dissolution of the complex,
  refers to the lattice free-energy of the complex,
  refers to the free-energy of solute–solvent interaction, and Vm is the molar volume of solid [cation][VBH]. To systematically probe these quantities, a strategy to replace calcium (2+) with arbitrary cations was devised, in which CaVBH is treated with the fluoride salt of the targeted cations (see Fig. 3). After filtration to remove the insoluble fluorite salt, this solution can be used directly as a battery electrolyte or the [cation][VBH] salt can be isolated as a solid. This strategy was used to prepare a series of symmetric, bis-alkylammonium salts of [VBH], having from one to four methylene units in the alkyl groups adjacent to the central nitrogen atom (NXXXX, where X = 1–4 methylene units (see Fig. 3). Removal of solvent affords crystals of alkylammonium [VBH] compounds suitable for X-ray crystallography (see Fig. 4a, and b). Further, chemical oxidation of the vanadium(4+) species, [N3333]2[VBH] and [N4444]2[VBH], allows preparation of the oxidized, vanadium(5+) species, as characterized by X-ray crystallography (see Fig. 4c and d, respectively). Mass spectrometry indicates the presence of the parent [VBH] ion in solution as well as monocation adducts (see Fig. 4e and f).
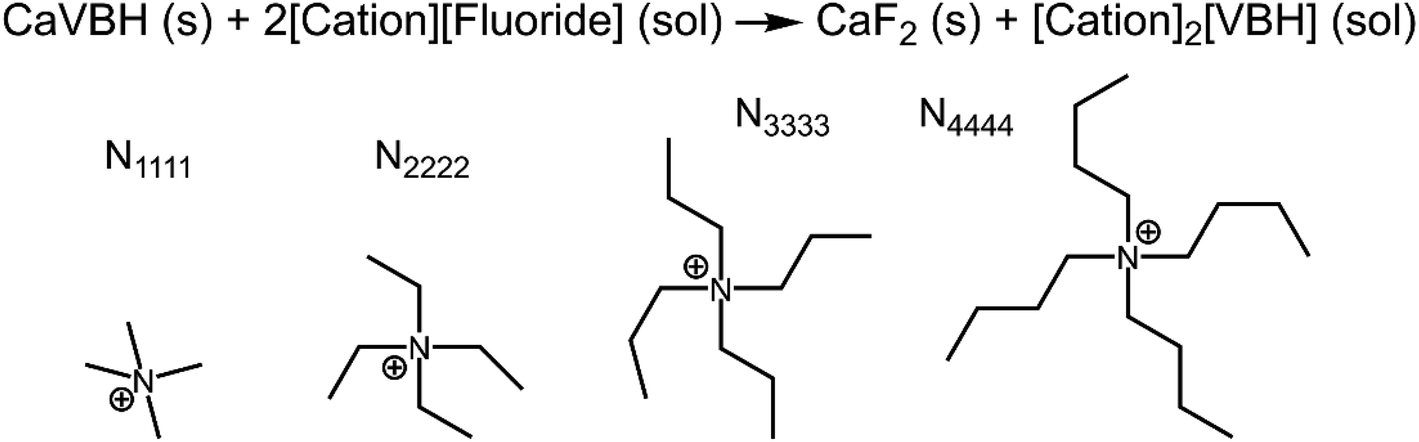 | ||
| Fig. 3 Scheme for preparation of arbitrary cations of [VBH] by metathesis of the calcium ion. NXXXX, X = 1, 2 3 and 4 correspond to the tetramethylammonium, tetraethylammonium, tetrapropylammonium, and tetrabutylammonium cations, respectively. | ||
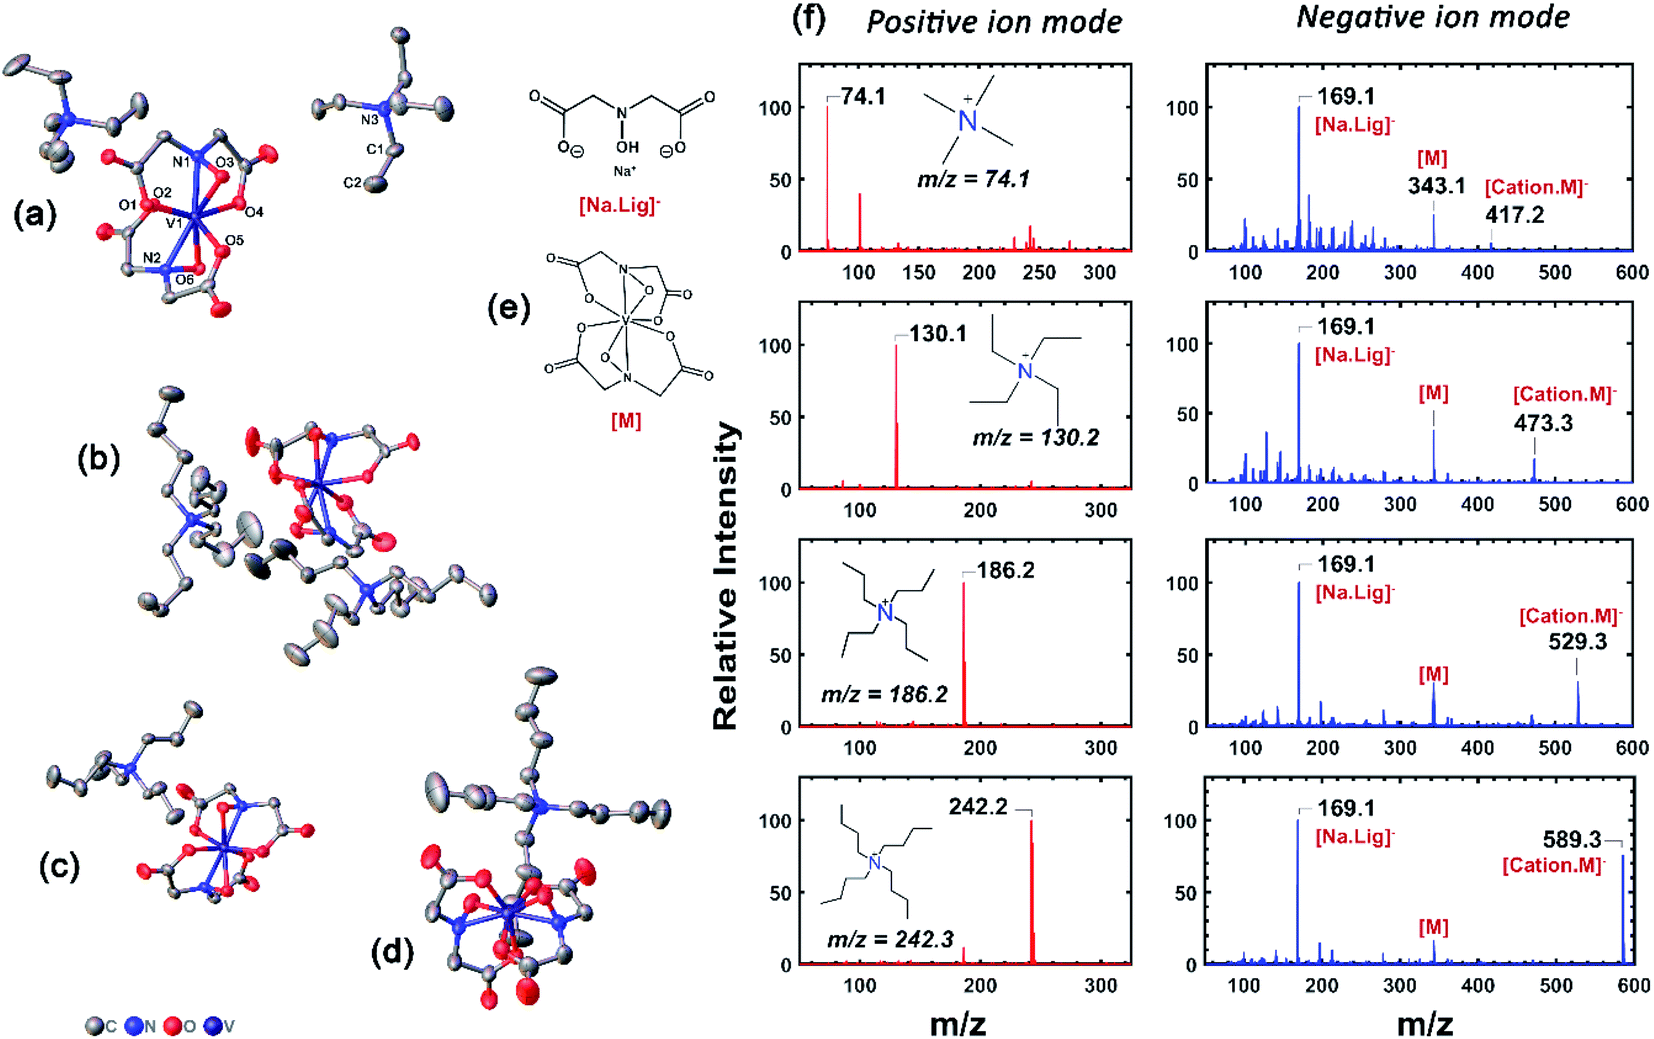 | ||
| Fig. 4 X-Ray crystallographic data, and mass spectrometric characterization of [NXXXX]1,2[VBH]. (a) and (b) correspond to thermal ellipsoid plots of N2222 and N4444, bis-alkylammonium, vanadium(4+) [VBH], respectively and (c) and (d) correspond to those of N3333 and N4444 mono-alkylammonium, vanadium(5+) [VBH], respectively. Structures of key ions present in the mass spectrometry are provided in (e) and (f) corresponds to the positive and negative mode mass spectra of [NXXXX]2[VBH], X = 1 to 4. Further details of X-ray crystallographic measurements can be found in ESI.† | ||
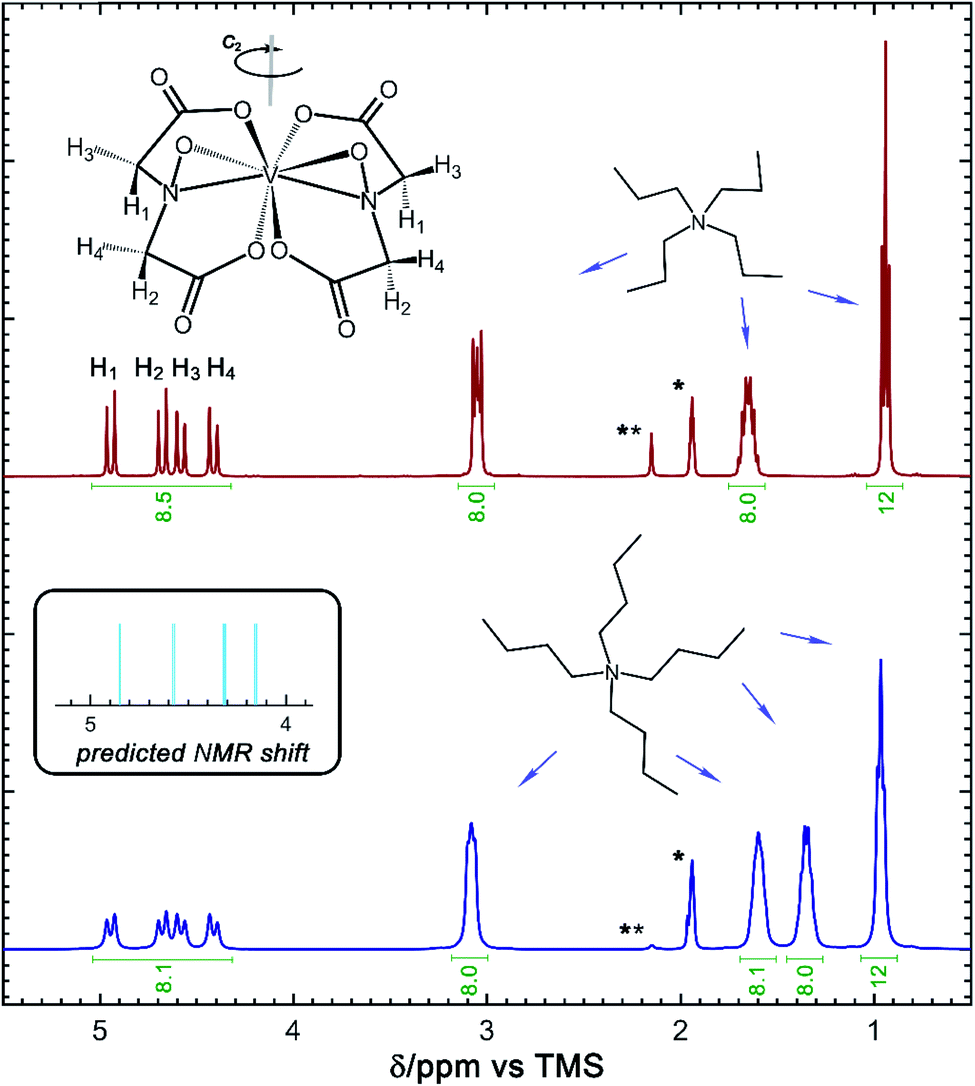 | ||
| Fig. 5 NMR spectra of the vanadium(5+) complexes of [N3333][VBH] (top, red) and [N4444][VBH] (bottom, blue). Insets show the stick diagram and predicted NMR chemical shifts of the [VBH] anion, as well as the stick diagrams of the [N3333] and [N4444] cations. | ||
In addition to the X-ray crystallography and mass spectrometry discussed above, 1H NMR spectroscopy provides insight into the structure of the [VBH] active-materials. Integration of the 1H spectra of [N3333][VBH] and [N4444][VBH] (see Fig. 5) exhibits ratios of [VBH]-methylene protons to alkylammonium–methylene and –methyl protons of ∼8![[thin space (1/6-em)]](https://www.rsc.org/images/entities/char_2009.gif) :8:8:12 and 8:8: 8:8:12, respectively, confirming the expected stoichiometries of the ions. In both compounds, the methylene region of the spectra, between ∼4.3 and 5 ppm contains eight peaks which can be assigned to four sets of equivalent protons of the [VBH] ligands, each split by a strongly coupled, geminal proton (2JHH = 16 Hz).38,39 DFT-predicted NMR shifts (see Fig. 5, inset) aid in assigning these peaks, with the two protons in the same face as the η2-NO ligand (H3 and H4, Fig. 5) up-field compared to the protons on the opposite face (H1 and H2, Fig. 5) as a result of shielding from a more electron-rich quadrant of the coordination sphere. These four ligand proton positions are related to another set by a C2 operation through the vanadium center (see Fig. 5). This description is roughly consistent with the assignment reported for the natural product Amavadin,40 which contains two chiral methine positions in each ligand, in place of the methylene positions in [VBH].
:8:8:12 and 8:8: 8:8:12, respectively, confirming the expected stoichiometries of the ions. In both compounds, the methylene region of the spectra, between ∼4.3 and 5 ppm contains eight peaks which can be assigned to four sets of equivalent protons of the [VBH] ligands, each split by a strongly coupled, geminal proton (2JHH = 16 Hz).38,39 DFT-predicted NMR shifts (see Fig. 5, inset) aid in assigning these peaks, with the two protons in the same face as the η2-NO ligand (H3 and H4, Fig. 5) up-field compared to the protons on the opposite face (H1 and H2, Fig. 5) as a result of shielding from a more electron-rich quadrant of the coordination sphere. These four ligand proton positions are related to another set by a C2 operation through the vanadium center (see Fig. 5). This description is roughly consistent with the assignment reported for the natural product Amavadin,40 which contains two chiral methine positions in each ligand, in place of the methylene positions in [VBH].
Solubility of alkylammonium [VBH] compounds
Metathesis of the calcium(2+) ion in the manner described above and depicted in Fig. 3 profoundly affects the solubility of the [cation][VBH] active-materials. As shown in Table 1, CaVBH is insoluble in all solvents tested except for water and DMSO, in which it is modestly soluble. A clear trend emerges, in which VBH exhibits increasing solubility with increasing alkyl-chain-length. It is also notable that the oxidation state of the cation plays an important role in solubility, with the reduced, dianionic species exhibiting greater solubility (vide infra). Formulation of NRFB electrolytes containing active-material and support cation with concentrations approaching one and two mol L−1, respectively, constitutes a significant milestone. Careful consideration of these solubility trends and casting them in the context of a more general theoretical framework, has the potential to lead to further improvements and provides general insight into the development of high-energy density NFRB electrolytes.| Solvent | Dielectric constant | Vanadium(4+) species | Vanadium(5+) species | |||||
|---|---|---|---|---|---|---|---|---|
| [Ca]2+ | [N1111]2+ | [N2222]2+ | [N3333]2+ | [N4444]2+ | [N3333]+ | [N4444]+ | ||
| Tetrahydrofuran | 7.5 | Insoluble | Insoluble | Insoluble | Insoluble | 0.17 | Insoluble | 0.008 |
| Acetonitrile | 37 | Insoluble | 0.004 | 0.33 | 1.09 | 0.80 | 0.12 | 0.51 |
| Dimethylsulfoxide | 47 | 0.54 | 0.11 | 0.53 | 0.83 | 0.69 | 0.62 | 0.55 |
| Propylene carbonate | 66 | Insoluble | 0.03 | 0.28 | 0.68 | 0.77 | 0.27 | 0.65 |
Thermodynamic considerations for [cation][VBH] solubility
 (see Fig. 2), or the difference between gas-phase and solvated ions, is straightforward and the values for each of the [NXXXX]y[VBH] species (y = 1 or 2 for oxidized and reduced active-material, respectively) for which solubility data has been measured is listed in Table 2. These calculations were carried out using a model known as SMD,41 in which the solvent is considered a continuous dielectric medium42 interacting with the solute electron density. This model accounts for electrostatic interactions of a polarizable continuum stabilizing the permanent charges on the cation and anions, as well as short-range dispersion interactions between the solvent and solute molecules in the first solvation shell (see Fig. 6a).41 Interestingly, the trend in
  runs counter to the experimentally observed solubility data. Electrostatic potential plots, shown in Fig. 6, prepared using natural charges output from natural bond orbital analysis,43 provide an explanation for this effect based on the distribution of positive charge on each cation. In all four cases (NXXXX, X = 1–4) the central nitrogen and carbon atoms are relatively electroneutral while the bulk of the positive charge is concentrated on the protons bonded to the carbon directly adjacent to the nitrogen atom. This effect is readily apparent in the 1H-NMR spectroscopy of the alkylammonium ions (see Fig. 5), with a large downfield shift of the methylene protons adjacent to the nitrogen atom. These electropositive protons become less solvent-accessible as the alkyl-chain lengthens, preventing stabilizing dipole interactions between the solute and the solvent continuum and resulting in a less negative
  .
.
 for reduced and oxidized [NXXXX]y[VBH] compounds in acetonitrile, X = 1 to 4, and y = 2 for reduced species and y = 1 for oxidized species
| Vanadium(4+) |
|
Vanadium(5+) |
|
|---|---|---|---|
| [N1111]2[VBH] | −1111 | [N1111][VBH] | −477 |
| [N2222]2[VBH] | −1065 | [N2222][VBH] | −454 |
| [N3333]2[VBH] | −1049 | [N3333][VBH] | −446 |
| [N4444]2[VBH] | −1054 | [N4444][VBH] | −449 |


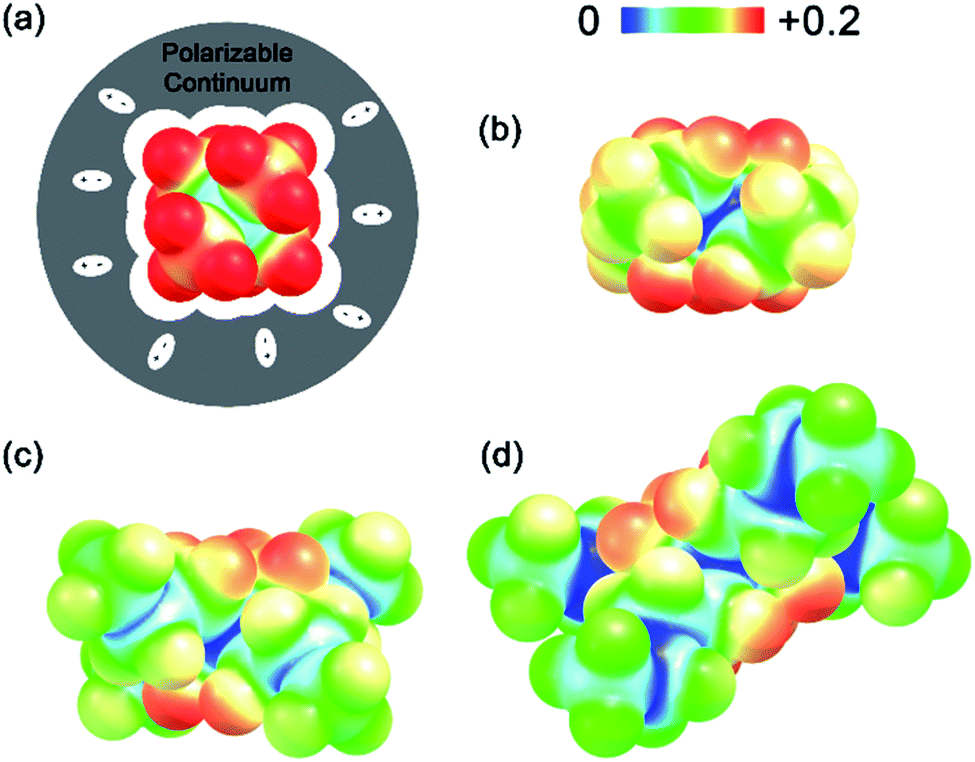 | ||
| Fig. 6 Electrostatic potential maps plotted using natural charges of N1111, N2222, N3333 and N4444 cations (a–d respectively). Gray-shaded region represents the polarizable continuum used by the SMD method. | ||
Considering the trend in solvation energies of the alkylammonium species discussed above, it is clear that any meaningful theoretical prediction of active-material solubility must account for the lattice energy of the solid, at least qualitatively. Furthermore, the experimentally observed trend of steeply increasing solubility for [NXXXX]y[VBH] with increasing alkyl-chain length must arise from destabilization of the crystal lattice. This is in accord with reported values of lattice energy for alkylammonium halides derived from thermochemical measurements, which show less negative lattice energy with longer alkyl-chain substituents.44–46 This observation also resonates with the observed high solubility of so-called noncoordinating anions, which is explained by low lattice energy inherent to bulky anions.47 Shown schematically in Fig. 7, with increasing alkyl-chain length, the effect of lattice destabilization  overcomes the destabilization of the solvated ions
  , resulting in an overall more negative
  , thus a higher solubility (
 , eqn (1)) for the bulkier cations. Notably, the solubility of CaVBH in DMSO, which is higher than that of [N1111]2[VBH] and comparable to [N2222]2[VBH], is an outlier in the trends discussed above. This may be the result of specific solute–solvent interactions not captured in the continuum model used, or atypical thermodynamic properties of its crystal lattice. While no theoretical framework could account for all possible physical properties of a real system, the high solubility of CaVBH in DMSO underscores the importance of a predictive theoretical framework, not to facilitate rational electrolyte design but also to identify potentially valuable outliers.
 | ||
| Fig. 7 Thermodynamic cycle for dissolution of VBH compounds of N1111, N2222, N3333 and N4444 cations. | ||
First, compared to reduced, [VBH]2−, one would expect oxidized, [VBH]1− would exhibit a less stable crystal lattice (i.e., less negative  ), due to the decreased overall charge of the complex.48 A destabilized lattice should have the effect of increasing solubility upon oxidation. Second, with respect to the free energy of the solvated ions
  , the loss of one cation, and the decreased charge on the anion should result in a less stable solution (less negative
  ) for the oxidized, VBH1− complex compared to the reduced, [VBH]2− species. This agrees with the DFT-calculated values of
  for the oxidized complexes (Fig. 8), which are less negative by 620–650 kJ mol−1 in the oxidized state. A destabilized solution should have the effect of decreasing solubility. Taken together with the experimentally observed solubility, (see Table 1), several conclusions can be drawn:
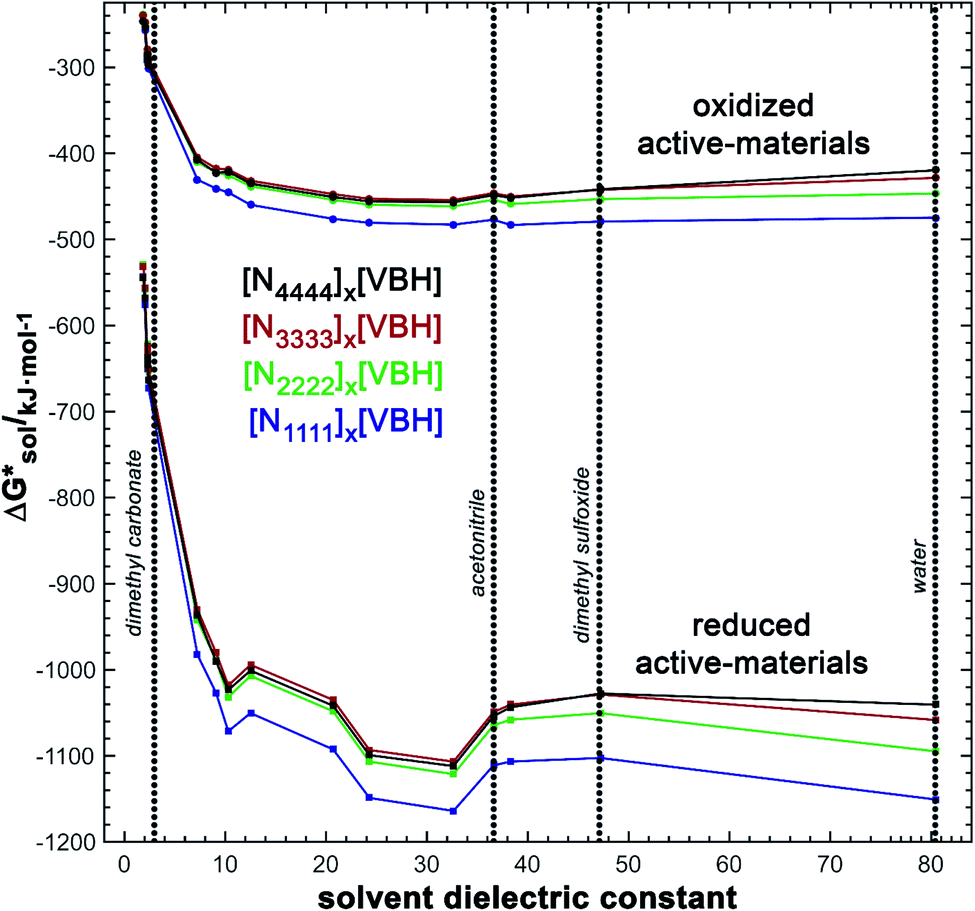 | ||
Fig. 8 DFT-calculated values of  for reduced and oxidized [NXXXX]y[VBH] compounds in various solvents with dielectric constant varying between 2 and 80 (X = 1 to 4, and Y = 2 for reduced species and Y = 1 for oxidized species). for reduced and oxidized [NXXXX]y[VBH] compounds in various solvents with dielectric constant varying between 2 and 80 (X = 1 to 4, and Y = 2 for reduced species and Y = 1 for oxidized species). | ||
•Upon oxidation of [VBH]2−, the positive change in  upon oxidation is greater than the positive change in
  , otherwise the active-material would become more soluble, not less.
•Since the change in  upon oxidation of [N3333]2[VBH] and [N4444]2[VBH] is nearly identical (∼620 kJ mol−1), and considering [N3333][VBH] is much less soluble than [N4444][VBH], the positive change in lattice energy upon oxidation must be less for [N3333]2[VBH] than for [N4444]2[VBH].
•Since the solubility of oxidized, [N4444][VBH], is similar to that of reduced, [N4444]2[VBH], the change in lattice energy similar to the change in solvation energy, on the order of 600 kJ mol−1.
In summary, the increase in solubility observed for VBH compounds with longer-chain alkylammonium cations comes as a result of lattice destabilization and despite a less favorable solvation energy. Further,  and
and  change upon oxidation, and in some cases are close in magnitude. Detailed computational investigations of the lattice enthalpy of these compounds is currently underway to identify structural aspects of the cation and VBH that may be changed to destabilize
  and increase solubility. Finally, by considering the variability of
  for oxidized and reduced VBH-complexes with various cations and in several solvents (see Fig. 8) we demonstrate that a pathway exists to optimize both thermodynamic quantities for solubility by altering cation and anion structure, as well as by altering the dielectric constant of the solvent/solvent mixture used to formulate the electrolyte.
Electrochemical characterization of high-concentration VBH electrolytes
A critical aspect of improving solubility of VBH electrolytes is maintaining high stability and cyclability by avoiding deleterious side-reactions that may become more severe at high concentrations. As shown in Fig. 9a, [N4444]2[VBH] can be cycled exhaustively at 0.24 mol L−1 to high depth-of-charge (DOC) with no chemical decomposition, as monitored by UV-Vis spectroscopy. After 16 round-trip cycles, comprising two initial and two final cycles between 90% and 10% DOC, with intervening cycles between 60% and 40% DOC, virtually no chemical decomposition of the active-material was observed. Subsequently, electrolyte solutions were remixed and cycled for an additional 6 cycles without observable decomposition. Notably, these experiments took place over the course of more than one week of constant cycling. As shown in Fig. 9b–g, the vanadium(4+) and vanadium(5+) concentrations at each electrode can be extracted by simulating the observed spectrum as a linear combination of the reference spectra (see Fig. S2†). The spectroscopic signatures of the electrolytes are identical before and after the experiment and the total VBH concentration was unchanged after 183 h of galvanostatic cycling at between 5 and 8 mA. The long duration of each cycle, due to high area-specific resistance, prevented investigation of active material-concentrations near the limit of their solubility. We expect that higher concentration studies will be more feasible at higher current density, in a flow cell architecture.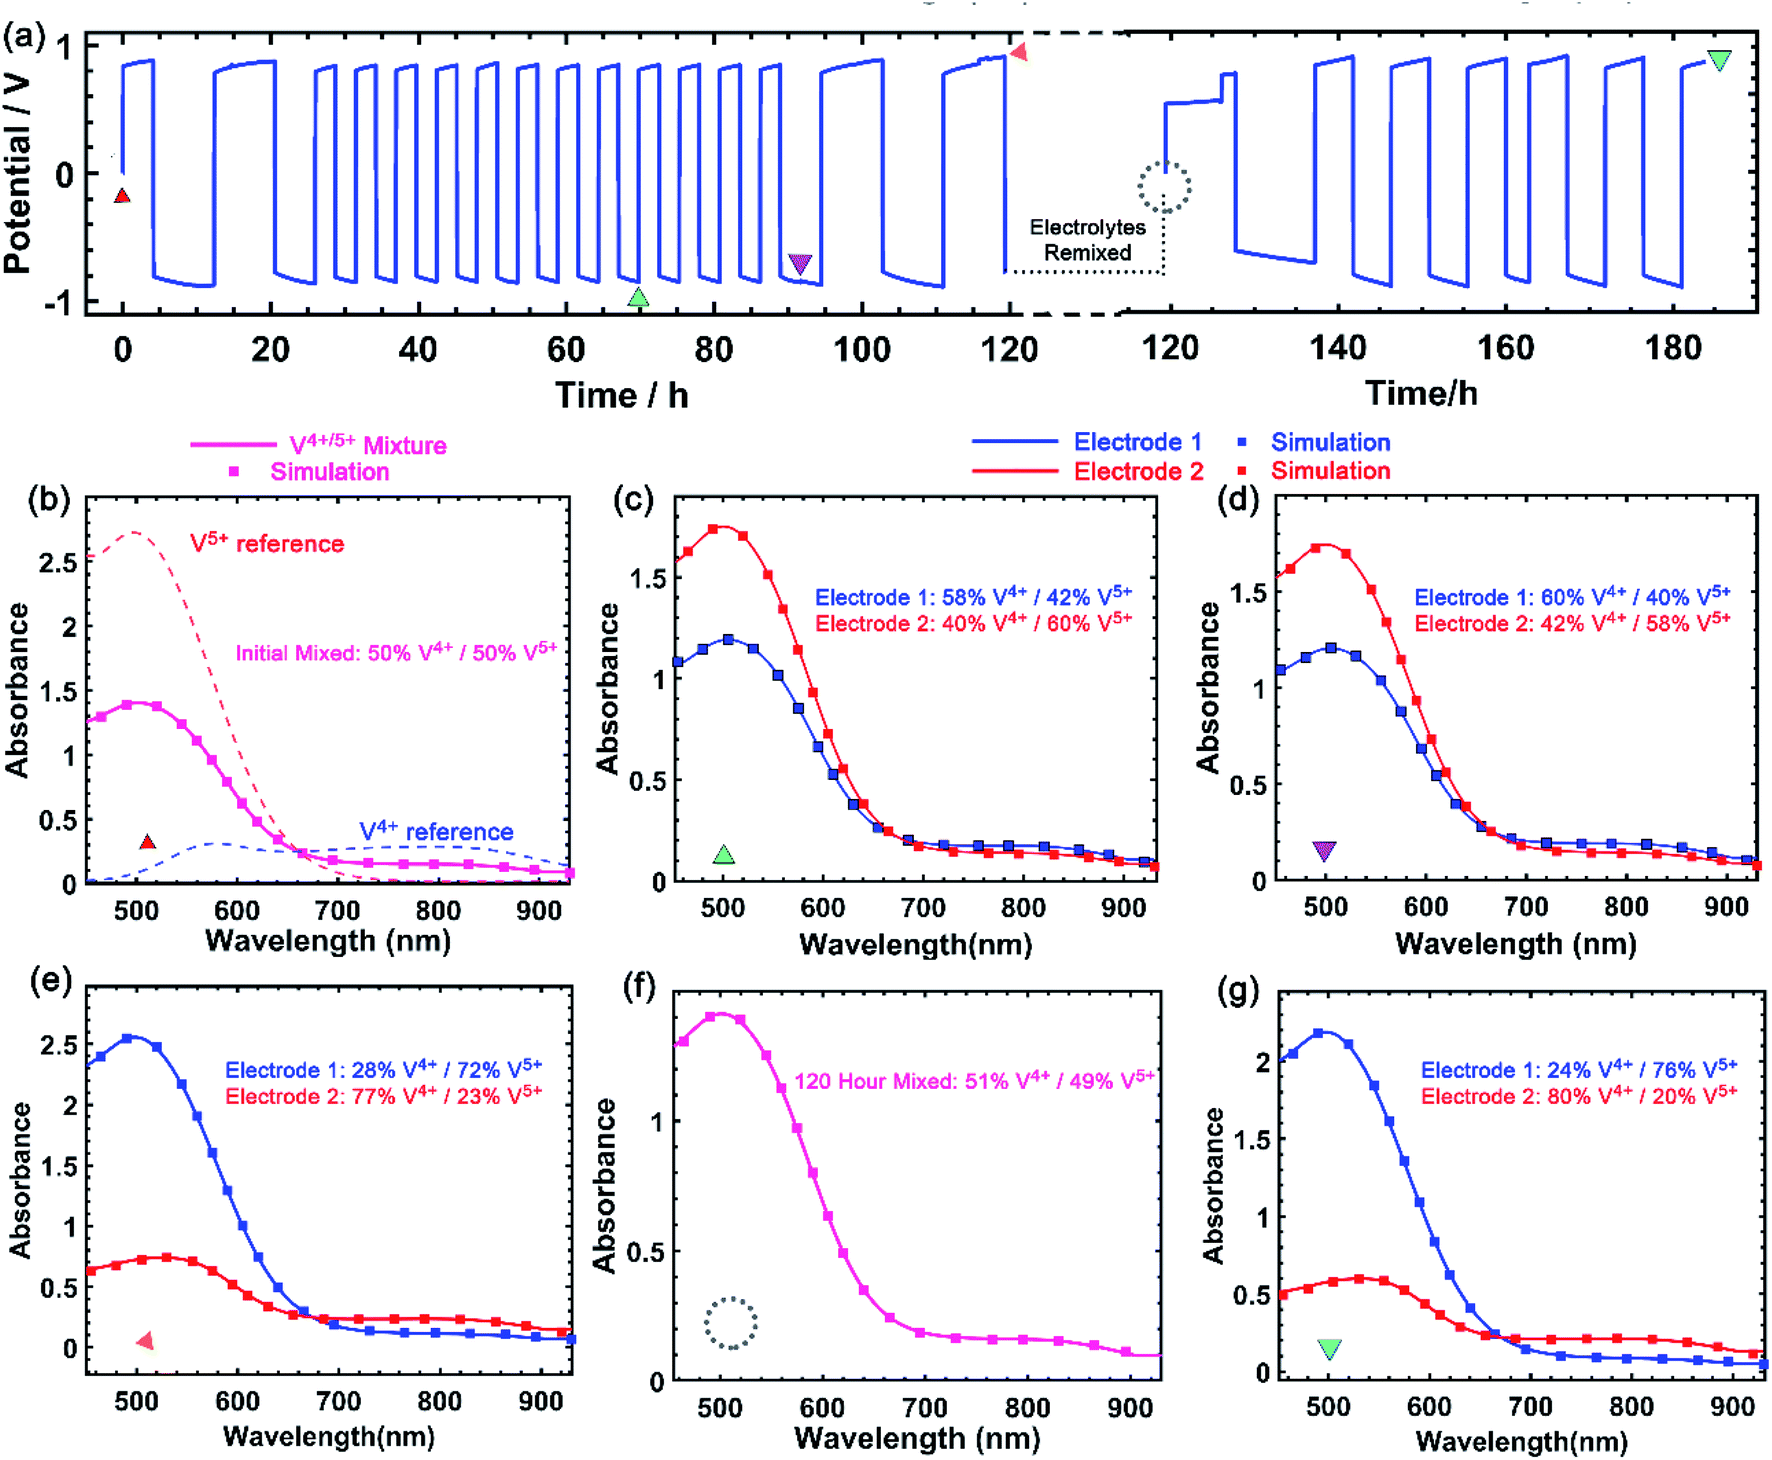 | ||
| Fig. 9 Electrochemical cycling of 0.24 mol L−1 [VBH] solution in MeCN, over the course of more than 180 hours, comprising 22 roundtrip cycles of 80% and 20% DOC (a). Panels (b)–(g) correspond to UV-Vis traces and simulated traces used to determine concentration of VBH in the reduced and oxidized states at the time point indicated by symbols in panel (a). Data were collected with a 20 mL 2-electrode cell with double-sided MPL carbon cloth (12.9 cm2) current collector, with between 5 and 9 mA of current. | ||
Kinetics of high-concentration reduced/oxidized VBH by ultramicroelectrode voltammetry
In addition to exhaustively cycling high-solubility VBH electrolytes, the kinetic behavior of these electrolytes at high concentrations was investigated. Cyclic voltammetry (CV) is a useful tool to explore the fundamental electrochemical properties of the electrolyte at low active-material concentrations using Randle–Sevcik and Butler–Volmer theoretical models. However, at higher concentrations, uncompensated resistances would result in a deviation from the linear relationship, leading to inaccurate predictions of the intrinsic electrochemical properties.49,50 To eliminate this problem, a carbon fiber ultramicroelectrode (UME) was used to probe the redox reactions at near-iR-free conditions.50 Fig. 10 shows steady-state voltammograms of both reduced and oxidized forms of [N4444]2VBH in MeCN and the corresponding kinetic parameters are summarized in Table 3. As expected, the exchange current density increases and the diffusion coefficient decreases with increasing [N4444]2VBH concentration, while the observed rate constant decreases slightly. Although the oxidized form of VBH electrolytes exhibit lower electrochemical rate constants in comparison to the reduced form due to increased viscosity (see Fig. S3.†), this UME analysis demonstrates that high-solubility VBH electrolytes exhibit fast electron transfer kinetics with rate constants in the range of 10−2–10−3 cm s−1.51,52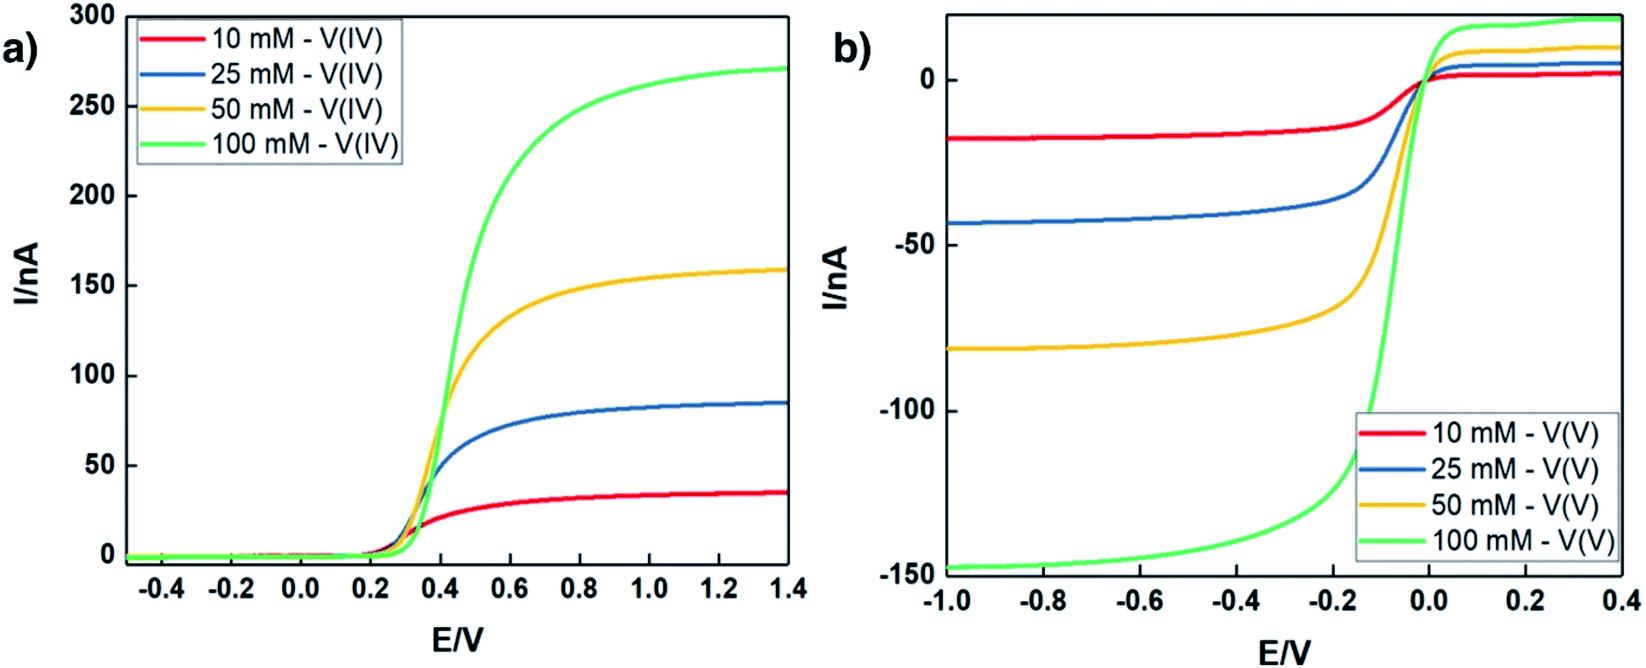 | ||
| Fig. 10 Steady state voltammograms of (a) reduced form, (b) oxidized form of [N4444]2VBH in MeCN at a scan rate of 0.05 V s−1. All experiments were performed using a carbon fiber UME at room temperature (25 °C). | ||
| Conc. [M] | Reduced form – [VBH]2− | Oxidized form – [VBH]1− | ||||
|---|---|---|---|---|---|---|
| j0 [mA cm−2] | k0 × 10−3 [cm s−1] | D0 × 10−6 [cm2 s−1] | j0 [mA cm−2] | k0 × 10−3 [cm s−1] | D0 × 10−6 [cm2 s−1] | |
| 0.010 | 10.6 | 10.9 | 15.1 | 5.01 | 5.2 | 8.29 |
| 0.025 | 27.5 | 5.69 | 7.97 | 14.3 | 2.96 | 4.04 |
| 0.050 | 46.9 | 4.86 | 7.00 | 29.6 | 3.07 | 3.78 |
| 0.100 | 108 | 5.61 | 6.08 | 48.8 | 2.53 | 3.49 |
Conclusion
The increased solubility reported herein is an inroad to overcoming a major obstacle to formulation of high energy-density NRFB electrolytes with VBH-based active-materials. These systems have the potential to address a growing need for flexible, robust grid energy storage systems. In addition, the insights developed herein provide a framework for electrolyte optimization. Future efforts will focus on tailoring electrolyte thermodynamics with combined theoretical and experimental approaches and assessing flow cell performance using electrolytes with high active-material concentrations.Experimental
General
Tetraethylammonium fluoride hydrate (TEAF, 97%), tetra-n-propylammonium chloride (TPACl, 99%), chloroacetic acid (HClOAC, 98%), vanadium(IV) oxide acetylacetonate, and anhydrous potassium fluoride (KF, 99%) were purchased from Bean Town Chemicals. Tetra-n-butylammonium fluoride hydrate (TBAF) and tetra-n-butylammonium hexafluorophosphate (TBAPF6) were purchased from Oakwood Chemicals. TBAPF6 was recrystallized from ethanol twice prior to use. Hydroxylamine hydrochloride (NH2OH·HCl, 99%) was purchased from Alfa Aesar. Zinc acetate dihydrate, 97% was purchased from Acros Organics. Tetramethylammonium fluoride tetrahydrate (TMAF, 98%) was purchased from Matrix Scientific. Calcium chloride dihydrate was purchased from VWR. Ferrocenium hexafluorophosphate, 97% was purchased from Sigma Aldrich. All chemicals were used as obtained unless mentioned otherwise. All solvents were obtained from Fisher Scientific, distilled over drying reagent and stored in a nitrogen-filled glovebox with oxygen and moisture content less than 1 ppm.Physical methods
UV-Vis spectra were collected in a Evolution 220 UV-visible Spectrophotometer (Thermo Scientific) using a quartz cuvette of 1 cm path length. Calibration curves (see Fig. S4 and S5.†) were drawn to estimate the molar absorptivity of VBH1− (reduced) and VBH2− (oxidized) at 825 nm and 485 nm respectively. The total concentration and fraction of each redox state of active material during cell cycling were estimated by simulating the observed spectra as a linear combination of reference spectra. Infrared spectra were recorded on a Thermo Scientific Nicolet iS5 equipped with iD7ATR module and a diamond crystal. 1H- and 13C-NMRs were recorded on Bruker AVANCE III HD 400 MHz High-Performance Digital NMR spectrometer operating at 400 MHz for 1H NMR, and 101 MHz for 13C NMR. Data acquisition was performed on IconNMR 5.0.3, and spectra were processed in TopSpin 3.5 and Mnova. High Resolution Mass Spectrometry (HRMS) were recorded on a Waters Xevo QTOF-I spectrometer using direct infusion-electrospray ionization technique. X-ray crystallographic experiments were performed on a Bruker D8 Venture X-instrument, using Mo Kα radiation at 200 K. Data were corrected for absorption using SADABS. The structures were solved by direct methods. All non-hydrogen atoms were refined anisotropically by full matrix least squares on F2 and all hydrogen atoms except those on water were placed in calculated positions with appropriate riding parameters. Further refinement and molecular graphics were obtained using Bruker Suite of structural programs,53 and OLEX2.54Electrochemical methods
All electrochemical experiments were carried out in N2-filled glovebox with oxygen and water content less than 1 ppm.Cyclic voltammetry was performed in a custom designed cell. Working electrode was 2 mm diameter glassy carbon electrode. Platinum wire was used as counter electrode. Nonaqueous reference electrode was fabricated by submerging a piece of silver wire in 25 mM silver nitrate solution in acetonitrile with 0.1 M TBAPF6 in a glass tube fitted with vycor frit on one end. CV and charge discharge experiments were recorded using Ametek VersaSTAT3 (Princeton Applied Research).
Ultramicroelectrode (UME) voltammetry: analysis of the redox reaction kinetics in high-concentration VBH electrolytes was performed with a UME voltammetry setup. 11 μm-diameter carbon fiber UME (BASi) was used as the working electrode. Platinum wire and silver wire were selected as counter and reference electrodes, respectively. The working electrode was prepared by rinsing the 11 μm carbon fiber with DI H2O, polishing with 0.05 μm alumina suspension, and then rinsing a second time with DI H2O. The reference electrode was calibrated against ferrocene in the respective support electrolyte. 5 mL of electrolyte were used for all UME experiments.
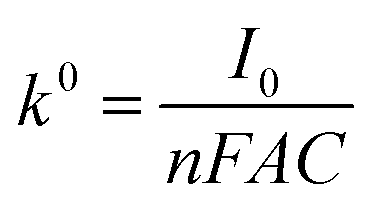
The standard rate constants (k0) were calculated according to the Butler–Volmer equation:
| iss = 4FrD0nC |
Galvanostatic charge discharge cycling was conducted with a two-electrode cell setup in a 20 mL H-cell from Adams and Chittenden Scientific. Double sided MPL carbon cloth (12.9 cm2) was used as electrode. Nafion membrane was soaked in solution of 0.5 M TBAPF6 in MeCN for 24 h prior to use.
Solubility of alkylammonium [VBH] compounds
Solubilities were experimentally measured by UV-Vis absorbance spectroscopy at room temperature, based on calibration curves (see Fig. S4 and S5.†). Saturated solutions of each of the compounds were made in the four different solvents and centrifuged. Samples were then diluted for measurement.Synthetic methods
![[double bond, length as m-dash]](https://www.rsc.org/images/entities/char_e001.gif) O).O).O), 1492w (C–N). HR-MS (ESI, positive ion mode) m/z calculated for C4H12N+ [M]+: 74.0964, found: 74.0954.O). HR-MS (ESI, positive ion mode) m/z calcd for C8H20N+ [M]+: 130.1590, found: 130.1554.O), 1488w (C–N). HR-MS (ESI, positive ion mode) m/z calcd for C12H28N+ [M]+: 186.2216, found: 186.2242.O), 1490w (C–N). HR-MS (ESI, positive ion mode) m/z calcd. for C16H36N+ [M]+: 242.2842, found: 242.2829.O), 1484w (C–N). δH (400 MHz, CD3CN) 4.94 (2H, d, J 16.1), 4.63 (4H, dd, J 38.4, 16.1), 4.41 (2H, d, J 16.1), 3.08 (8H, t, J 7.3), 1.60 (8H, t, J 7.4), 1.35 (8H, q, J 7.2), 0.96 (12H, t, J 7.3). δC (101 MHz, CD3CN) 171.00 (d, J 41.3), 65.56 (d, J 67.8), 59.40, 24.38, 20.41, 13.87.O), 1486w (C–N). δH (400 MHz, CD3CN) 4.94 (2H, d, J 16.1), 4.63 (4H, dd, J 38.2, 16.1), 4.41 (2H, d, J 16.1), 3.11–2.97 (8H, m), 1.73–1.56 (8H, m), 0.94 (12H, t, J 7.3).
O).O).O), 1492w (C–N). HR-MS (ESI, positive ion mode) m/z calculated for C4H12N+ [M]+: 74.0964, found: 74.0954.O). HR-MS (ESI, positive ion mode) m/z calcd for C8H20N+ [M]+: 130.1590, found: 130.1554.O), 1488w (C–N). HR-MS (ESI, positive ion mode) m/z calcd for C12H28N+ [M]+: 186.2216, found: 186.2242.O), 1490w (C–N). HR-MS (ESI, positive ion mode) m/z calcd. for C16H36N+ [M]+: 242.2842, found: 242.2829.O), 1484w (C–N). δH (400 MHz, CD3CN) 4.94 (2H, d, J 16.1), 4.63 (4H, dd, J 38.4, 16.1), 4.41 (2H, d, J 16.1), 3.08 (8H, t, J 7.3), 1.60 (8H, t, J 7.4), 1.35 (8H, q, J 7.2), 0.96 (12H, t, J 7.3). δC (101 MHz, CD3CN) 171.00 (d, J 41.3), 65.56 (d, J 67.8), 59.40, 24.38, 20.41, 13.87.O), 1486w (C–N). δH (400 MHz, CD3CN) 4.94 (2H, d, J 16.1), 4.63 (4H, dd, J 38.2, 16.1), 4.41 (2H, d, J 16.1), 3.11–2.97 (8H, m), 1.73–1.56 (8H, m), 0.94 (12H, t, J 7.3).Computational methods
The solvation free energies of the +4 and +5 oxidation states of the VBH anion with the corresponding Nxxxx (x = 1,2,3,4 is the number of alkyl carbon atoms) alkylammonium cations were investigated over a range of solvent systems (Table S1†).
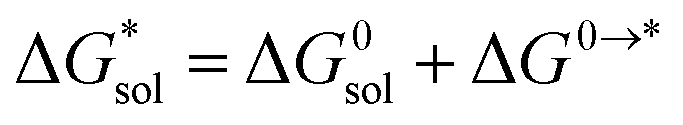
Implicit solvation was induced using the solvation model based on density (SMD) method implementation in Orca v4.2.1.57 The Perdew–Burke–Ernzerhof (PBE) generalized gradient approximation (GGA) functional and Grimme's DFT-D3 dispersion correction with Becke–Johnson damping (D3BJ) using the def2-TZVP basis set was used in the equilibrium geometry optimizations in both gaseous and solvated systems.58–62 The  for each ion was then taken as the difference between the solvated total energy (Esol) and the gaseous total energy (Evac) (eqn (2)) and corrected for the free energy change (ΔG0→* = 1.9 kcal mol−1 at 298 K) associated in converting 1 atm of gas to 1 mol L−1 solution (eqn (3)). Eqn (2) holds within the SMD method as this continuum model is parameterized with a substantial dataset of experimental free energies of solvation at room temperature.
| ΔG0sol = Esol − Evac | (2) |
 | (3) |
Electrostatic potential plots were prepare using the Multiwfn software package,63 incorporating natural charges calculated from a natural bond orbital analysis,43 and cube files were visualized using the Chemcraft software package.64
Conflicts of interest
There are no conflicts to declare.Acknowledgements
This research was supported in part by UMass Dartmouth's Marine and Undersea Technology (MUST) Research Program funded by the Office of Naval Research (ONR) under Grant No. N00014-20-1-2170. This work was also supported in part by UMass through the OTCV Technology Development Fund. P. J. C. and M. L. M. gratefully acknowledge UMass Dartmouth and the UMass Green High-Performance Computing Cluster for computing resources. This material is also based upon work supported by the U.S. Department of Energy, Office of Science, under Award Number DE-SC0020585 (Prime contractor, Triton Systems Inc). This report was prepared as an account of work sponsored by an agency of the United States Government. Neither the United States Government nor any agency thereof, nor any of their employees, makes any warranty, express or implied, or assumes any legal liability or responsibility for the accuracy, completeness, or usefulness of any information, apparatus, product, or process disclosed, or represents that its use would not infringe privately owned rights. Reference herein to any specific commercial product, process, or service by trade name, trademark, manufacturer, or otherwise does not necessarily constitute or imply its endorsement, recommendation, or favoring by the United States Government or any agency thereof. The views and opinions of authors expressed herein do not necessarily state or reflect those of the United States Government or any agency thereof. The authors also thank Louis Carreiro for his helpful insights on this work.References
- Sustainable Energy in America Factbook, https://www.bcse.org/download/, accessed April 11, 19 Search PubMed.
- P. Albertus, J. S. Manser and S. Litzelman, Joule, 2020, 4, 21–32 CrossRef CAS.
- U. S. E. I. Administration, Levelized Cost and Levelized Avoided Cost of New Generation Resources AEO20201 February 2020 Levelized Cost and Levelized Avoided Cost of New Generation Resources in the Annual Energy Outlook 2020, https://www.eia.gov/outlooks/aeo/pdf/electricity_generation.pdf, (accessed 7/16/20, 2020) Search PubMed.
- ERCOT - Grid Information - Generation, http://www.ercot.com/gridinfo/generation, (accessed 7/16/20, 2020) Search PubMed.
- M. Ulaganathan, V. Aravindan, Q. Yan, S. Madhavi, M. Skyllas-Kazacos and T. M. Lim, Adv. Mater. Interfaces, 2016, 3, 1500309 CrossRef.
- B. Dunn, H. Kamath and J.-M. Tarascon, Science, 2011, 334, 928–935 CrossRef CAS.
- C. Zhang, L. Zhang, Y. Ding, S. Peng, X. Guo, Y. Zhao, G. He and G. Yu, Energy Storage Mater., 2018, 15, 324–350 CrossRef.
- K. Gong, Q. Fang, S. Gu, S. F. Y. Li and Y. Yan, Energy Environ. Sci., 2015, 8, 3515–3530 RSC.
- R. W. Hogue and K. E. Toghill, Curr. Opin. Electrochem., 2019, 18, 37–45 CrossRef CAS.
- Y. Yan, S. G. Robinson, M. S. Sigman and M. S. Sanford, J. Am. Chem. Soc., 2019, 141, 15301–15306 CrossRef CAS.
- N. H. Attanayake, J. A. Kowalski, K. V. Greco, M. D. Casselman, J. D. Milshtein, S. J. Chapman, S. R. Parkin, F. R. Brushett and S. A. Odom, Chem. Mater., 2019, 31, 4353–4363 CrossRef CAS.
- K. H. Hendriks, S. G. Robinson, M. N. Braten, C. S. Sevov, B. A. Helms, M. S. Sigman, S. D. Minteer and M. S. Sanford, ACS Cent. Sci., 2018, 4, 189–196 CrossRef CAS.
- J. Friedl, M. A. Lebedeva, K. Porfyrakis, U. Stimming and T. W. Chamberlain, J. Am. Chem. Soc., 2018, 140, 401–405 CrossRef CAS.
- J. Winsberg, T. Hagemann, T. Janoschka, M. D. Hager and U. S. Schubert, Angew. Chem., Int. Ed., 2017, 56, 686–711 CrossRef CAS.
- P. Leung, A. A. Shah, L. Sanz, C. Flox, J. R. Morante, Q. Xu, M. R. Mohamed, C. Ponce de León and F. C. Walsh, J. Power Sources, 2017, 360, 243–283 CrossRef CAS.
- J. A. Kowalski, M. D. Casselman, A. P. Kaur, J. D. Milshtein, C. F. Elliott, S. Modekrutti, N. H. Attanayake, N. Zhang, S. R. Parkin, C. Risko, F. R. Brushett and S. A. Odom, J. Mater. Chem. A, 2017, 5, 24371–24379 RSC.
- J. D. Milshtein, J. L. Barton, R. M. Darling and F. R. Brushett, J. Power Sources, 2016, 327, 151–159 CrossRef CAS.
- T. B. Liu, X. L. Wei, Z. M. Nie, V. Sprenkle and W. Wang, Adv. Energy Mater., 2016, 6, 1501449 CrossRef.
- G.-M. Weng, B. Yang, C.-Y. Liu, G.-Y. Du, E. Y. Li and Y.-C. Lu, Energy Environ. Sci., 2019, 12, 2244–2252 RSC.
- J. D. Milshtein, A. P. Kaur, M. D. Casselman, J. A. Kowalski, S. Modekrutti, P. L. Zhang, N. Harsha Attanayake, C. F. Elliott, S. R. Parkin, C. Risko, F. R. Brushett and S. A. Odom, Energy Environ. Sci., 2016, 9, 3531–3543 RSC.
- Y. Yan, T. P. Vaid and M. S. Sanford, J. Am. Chem. Soc., 2020, 142, 17564–17571 CrossRef CAS.
- L. E. VanGelder, B. E. Petel, O. Nachtigall, G. Martinez, W. W. Brennessel and E. M. Matson, ChemSusChem, 2018, 11, 4139–4149 CrossRef CAS.
- J. M. Stauber, S. Zhang, N. Gvozdik, Y. Jiang, L. Avena, K. J. Stevenson and C. C. Cummins, J. Am. Chem. Soc., 2018, 140, 538–541 CrossRef CAS.
- J. Friedl, M. V. Holland-Cunz, F. Cording, F. L. Pfanschilling, C. Wills, W. McFarlane, B. Schricker, R. Fleck, H. Wolfschmidt and U. Stimming, Energy Environ. Sci., 2018, 11, 3010–3018 RSC.
- P. B. Tsitovich, A. M. Kosswattaarachchi, M. R. Crawley, T. Y. Tittiris, T. R. Cook and J. R. Morrow, Chemistry, 2017, 23, 15327–15331 CrossRef CAS.
- Y. Li, J. Sniekers, J. Malaquias, X. Li, S. Schaltin, L. Stappers, K. Binnemans, J. Fransaer and I. F. J. Vankelecom, Electrochim. Acta, 2017, 236, 116–121 CrossRef CAS.
- Y. Ding, Y. Zhao, Y. T. Li, J. B. Goodenough and G. H. Yu, Energy Environ. Sci., 2017, 10, 491–497 RSC.
- P. J. Cappillino, H. D. Pratt, N. S. Hudak, N. C. Tomson, T. M. Anderson and M. R. Anstey, Adv. Energy Mater., 2014, 4, 1300566 CrossRef.
- J. A. Suttil, J. F. Kucharyson, I. L. Escalante-Garcia, P. J. Cabrera, B. R. James, R. F. Savinell, M. S. Sanford and L. T. Thompson, J. Mater. Chem. A, 2015, 3, 7929–7938 RSC.
- Y. Y. Lai, X. Li and Y. Zhu, ACS Appl. Polym. Mater., 2020, 2, 113–128 CrossRef CAS.
- E. C. Montoto, G. Nagarjuna, J. S. Moore and J. Rodríguez-López, J. Electrochem. Soc., 2017, 164, A1688–A1694 CrossRef CAS.
- R. M. Darling, K. G. Gallagher, J. A. Kowalski, S. Ha and F. R. Brushett, Energy Environ. Sci., 2014, 7, 3459–3477 RSC.
- H. Huang, R. Howland, E. Agar, M. Nourani, J. A. Golen and P. J. Cappillino, J. Mater. Chem. A, 2017, 5, 11586–11591 RSC.
- T. C. Gokoglan, S. K. Pahari, A. Hamel, R. Howland, P. J. Cappillino and E. Agar, J. Electrochem. Soc., 2019, 166, A1745–A1751 CrossRef CAS.
- J. F. Kucharyson, L. Cheng, S. O. Tung, L. A. Curtiss and L. T. Thompson, J. Mater. Chem. A, 2017, 5, 13700–13709 RSC.
- L. Cheng, P. Redfern, K. C. Lau, R. S. Assary, B. Narayanan and L. A. Curtiss, J. Electrochem. Soc., 2017, 164, E3696–E3701 CrossRef CAS.
- R. E. Skyner, J. L. McDonagh, C. R. Groom, T. van Mourik and J. B. O. Mitchell, Phys. Chem. Chem. Phys., 2015, 17, 6174–6191 RSC.
- S.-J. Lu, H.-H. Yang, W.-J. Chang, H.-H. Hsueh, Y.-C. Lin, F.-C. Liu, I. J. B. Lin and G.-H. Lee, J. Organomet. Chem., 2020, 927, 121543 CrossRef CAS.
- F. E. Hahn, M. C. Jahnke and T. Pape, Organometallics, 2007, 26, 150–154 CrossRef CAS.
- E. M. Armstrong, D. Collison, N. Ertok and C. D. Garner, Talanta, 2000, 53, 75–87 CrossRef CAS.
- A. V. Marenich, C. J. Cramer and D. G. Truhlar, J. Phys. Chem. B, 2009, 113, 6378–6396 CrossRef CAS.
- J. R. Rumble, CRC Handbook of Chemistry and Physics, CRC Press, 101st edn, 2020 Search PubMed.
- E. D. Glendening, C. R. Landis and F. Weinhold, J. Comput. Chem., 2013, 34, 1429–1437 CrossRef CAS.
- J. Łubkowski and J. Błażejowski, Thermochim. Acta, 1990, 157, 259–277 CrossRef.
- P. Dokurno, J. Łubkowski and J. Bł=ejowski, Thermochim. Acta, 1990, 165, 31–48 CrossRef CAS.
- J. Błażejowski and E. Kowalewska, Thermochim. Acta, 1986, 105, 257–286 CrossRef.
- I. Krossing and I. Raabe, Angew. Chem., Int. Ed., 2004, 43, 2066–2090 CrossRef CAS.
- P. Atkins and J. De Paula, Physical Chemistry, W.H. Freeman and Company, New York, 7 edn, 2002 Search PubMed.
- J. A. Kowalski, A. M. Fenton Jr, B. J. Neyhouse and F. R. Brushett, J. Electrochem. Soc., 2020, 167, 160513 CrossRef CAS.
- L. Su, M. Ferrandon, J. A. Kowalski, J. T. Vaughey and F. R. Brushett, J. Electrochem. Soc., 2014, 161, A1905–A1914 CrossRef.
- A. M. Kosswattaarachchi, L. E. VanGelder, O. Nachtigall, J. P. Hazelnis, W. W. Brennessel, E. M. Matson and T. R. Cook, J. Electrochem. Soc., 2019, 166, A464–A472 CrossRef CAS.
- R. W. Hogue, C. G. Armstrong and K. E. Toghill, ChemSusChem, 2019, 12, 4506–4515 CrossRef CAS.
- Bruker, APEX3, SAINT, and SADABS, Bruker AXS Inc., Madison, Wisconsin, USA, 2008 Search PubMed.
- O. V. Dolomanov, L. J. Bourhis, R. J. Gildea, J. A. K. Howard and H. Puschmann, J. Appl. Crystallogr., 2009, 42, 339–341 CrossRef CAS.
- G. Anderegg, E. Koch and E. Bayer, Inorg. Chim. Acta, 1987, 127, 183–188 CrossRef CAS.
- S. Dermeik and Y. Sasson, J. Org. Chem., 1989, 54, 4827–4829 CrossRef CAS.
- F. Neese, Wiley Interdiscip. Rev.: Comput. Mol. Sci., 2012, 2, 73–78 CAS.
- A. D. Becke, J. Chem. Phys., 1993, 98, 5648–5652 CrossRef CAS.
- A. D. Becke, J. Chem. Phys., 1992, 97, 9173–9177 CrossRef CAS.
- C. Lee, W. Yang and R. G. Parr, Phys. Rev. B, 1988, 37, 785–789 CrossRef CAS.
- A. D. Becke, Phys. Rev. A, 1988, 38, 3098–3100 CrossRef CAS.
- S. H. Vosko, L. Wilk and M. Nusair, Can. J. Phys., 1980, 58, 1200–1211 CrossRef CAS.
- T. Lu and F. Chen, J. Comput. Chem., 2012, 33, 580–592 CrossRef CAS.
- G. A. Andrienko, Chemcraft - graphical software for visualization of quantum chemistry computations, https://www.chemcraftprog.com Search PubMed.
Footnote |
| † Electronic supplementary information (ESI) available. CCDC 2045253–2045256. For ESI and crystallographic data in CIF or other electronic format see DOI: 10.1039/d0ra10913d |
| This journal is © The Royal Society of Chemistry 2021 |