DOI:
10.1039/D0RA10848K
(Paper)
RSC Adv., 2021,
11, 11356-11363
Synthesis and evaluation of the oil removal potential of 3-bromo-benzimidazolone polymer grafted silica gel†
Received
26th December 2020
, Accepted 8th March 2021
First published on 17th March 2021
Abstract
This work reports the synthesis of 3-bromo-benzimidazolone using melt condensation, its polymerization and functionalization on silica which was extracted from diatomaceous earth in our previous work. The synthesized compounds were characterized using FTIR, NMR, SEM-EDS and TEM. The FTIR and NMR spectra of the synthesized benzimidazolones showed the compounds to have several functional groups: A band due to Si–O–C at 1085.41 cm−1, a broad band at 3380 cm−1 and chemical shifts: positive distortionless enhancement by polarization transfer (DEPT) 13C peaks (indicating lack of CH2 and CH3 groups), 1H NMR – 11.053 ppm (N–H), 7.086 ppm (Ar-H); 13C NMR – 155.34 ppm (C![[double bond, length as m-dash]](https://www.rsc.org/images/entities/char_e001.gif) O), 101.04 ppm (C–Br) characteristic of benzimidazolones. SEM-EDS of the functionalized silica showed a rough irregular morphology with Si and O as the major elements. Carbon was also present indicating that silica was successfully functionalized with 3-bromo-benzimidazolone and TEM showed interconnected smear-like particles arranged irregularly. The functionalized silica was then applied in the treatment of oily wastewater and factors like initial oil concentration, adsorption dosage and time were optimized using the central composite design of response surface methodology in the design expert software. The amount of oil adsorbed was obtained by quantifying the total organic carbon using TOC test kits. Results showed that the optimum conditions for oil removal were 6650 mg L−1 oil concentration, with adsorbent dosage of 0.004 g and a contact time of 16 h. Under these conditions, the percentage adsorption was 97.9% with a desirability of 0.99. The materials were therefore seen to be applicable to field wastewaters.
O), 101.04 ppm (C–Br) characteristic of benzimidazolones. SEM-EDS of the functionalized silica showed a rough irregular morphology with Si and O as the major elements. Carbon was also present indicating that silica was successfully functionalized with 3-bromo-benzimidazolone and TEM showed interconnected smear-like particles arranged irregularly. The functionalized silica was then applied in the treatment of oily wastewater and factors like initial oil concentration, adsorption dosage and time were optimized using the central composite design of response surface methodology in the design expert software. The amount of oil adsorbed was obtained by quantifying the total organic carbon using TOC test kits. Results showed that the optimum conditions for oil removal were 6650 mg L−1 oil concentration, with adsorbent dosage of 0.004 g and a contact time of 16 h. Under these conditions, the percentage adsorption was 97.9% with a desirability of 0.99. The materials were therefore seen to be applicable to field wastewaters.
Introduction
Petroleum is widely used globally, and its use is predicted to increase to about 107 million barrels daily by the year 2030. The exploration of this mineral requires a lot of water1,2 just like all fossil fuel extraction and generates wastewater very rich in oils.1
Oily wastewater is ranked high in the global environmental issues list, hence treating it is of paramount importance.3,4 Coagulation, filtration with coagulation, precipitation, ozonation, ion exchange, reverse osmosis, biological methods and advanced oxidation processes have been used to treat oily wastewater in the past, but these methods have technical and economic limitations.5–9
Adsorption is another method that has been used in the treatment of oily wastewater with advantages over other methods such as, high removal efficiency, low energy demand, less chemical investment and reusability.10 Over the years, several adsorbents like activated carbon, zeolites, coal, fly ash, clays and nanomagnetic particles have been used. Moazed et al.11 used bentonite clay to remove oil from water and reported 70% adsorption of its weight in oil. It was also reported that the bentonite clay material had an oil removal capacity of 100%, but the materials were not successful in the removal of organic particles.11 The other adsorbents listed above were found to have relatively low adsorption capacities.2,10 Fly ash was reported to have an oil removal efficiency of 70–80% and the adsorption data obtained in this study, fitted best to Freundlich isotherm indicating adsorption on a heterogenous surface.12–14 Li et al.3 used different particle sizes of three different types of coal – anthracite, lean coal and lignite to remove oil from wastewater. The results of their experiments indicated that the quantity of absorbed oil decreased with an increase in particle size. They also found anthracite to have the highest adsorption capacity (24.4 mg g−1). Since the first synthesis of porous silica gels in 1968,15 different porous gels with different modifications and pore sizes have been synthesized by modifying the reaction conditions and parameters.16 This makes the materials potentially applicable in a wide range of areas. The modifications have recently been extended to organic polymers giving the materials characteristics of both organic and inorganic moieties.12,13,17
The benzimidazole group is an integral part of many therapeutic agents with many known applications as antiviral, antihistaminic, selective nucleotide-binding oligomerization domain-containing protein 1 and angiotensin-converting-enzyme inhibitory agents.18 Benzimidazol-2-ones are an important group of benzimidazoles and have been applied as antipsychotic, antihistaminic, antihypertensive antitrichinellosis agents and antiviral agents, among others.19 This group of compounds have only been applied in a few instances in remediation of wastewater. For example, Samai et al.20 successfully applied bis-benzimidazole compounds in the sorption of dyes and its derivatives have been shown to be good adsorbents of acids.21
Given the frequency of use of petroleum products and the associated spills and the increasing scarcity of water, there is need for a reliable and efficient adsorbent to remove oil from water. This work was aimed at the synthesis of 3-bromobenzimidazolone derivatives of porous silica gels which has never been investigated before. A closely related compound, benzimidazoles, have however shown excellent sorption properties because of the numerous functional groups it presents. 3-Bromobenzimidazolone was chosen over the benzimidazoles for this work because it presents an additional functional group, the carbonyl group which is potentially useful in oil sorption. The synthesis was carried out by first synthesizing the benzimidazolone through a solvent free process followed by its copolymerization with silica. For the first time, the usability of these benzimidazolone–silica hybrids in the treatment of oily wastewater is reported. The removal of oil from water using these adsorbents were optimized using response surface methodology and the optimum conditions for oil removal were obtained using this software.
Experimental
Chemicals and reagents
Silica extracted from diatomaceous earth in our previous study was used after drying.22,23 Sodium dodecyl sulphate, 3-bromo-1,2-benzenediamine, urea and ammonium persulphate were of analytical grade and obtained from Sigma-Aldrich (St Louis, USA), NaOH and HCl was obtained from Rochelle Chemicals (Johannesburg, South Africa). Milli-Q water from Millipore S.A.S (Molsheim, France) (18.2 μs cm−1 at 25 °C) was also used in all dilutions. Tea bags were bought from Shoprite, Thohoyandou, South Africa. Vacuum pump oil was from Telstar technologies (Barcelona, Spain). Freeze dryer (Telstar Lyoquest-55, Shanghai, China) was used to freeze dry samples and spectroquant UV spectrophotometer (Merk Group, Germiston, South Africa) was used for total organic carbon measurement and Stuart reciprocating shaker (Staffordshire, UK) was used for shaking and functional group analysis was carried out using an ALPHA FT-IR spectrophotometer from Bruker Pty (Sandton, South Africa).
Synthetic oily wastewater (SOWW) was prepared by modifying the method described by Shoba et al.24 Sodium dodecyl sulphate and vacuum pump oil (90![[thin space (1/6-em)]](https://www.rsc.org/images/entities/char_2009.gif) :1 v/w) were added to a 1 L flask and the volume made up with water. The mixture was then sonicated for 5 min at an amplitude of 75% and cycle of 0.5 to make the mixture homogenous.
:1 v/w) were added to a 1 L flask and the volume made up with water. The mixture was then sonicated for 5 min at an amplitude of 75% and cycle of 0.5 to make the mixture homogenous.
Synthesis of benzimidazolone
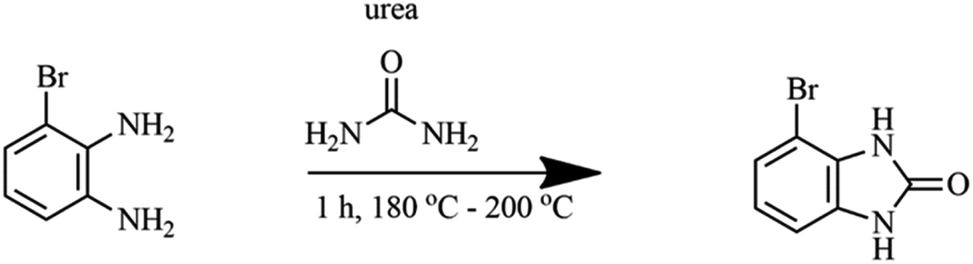
Benzimidazolone were prepared by modifying the method described by Mavrova et al.,25 Izevbekhai et al.26 and Yang et al.27 1 mole of 3-bromo-1,2-benzenediamine, was mixed thoroughly with 1 mole of urea by crushing in a mortar and heated at 190 °C for 1 h over a sand bath as shown in reaction Scheme 1. The resulting solute was allowed to cool to room temperature and dissolved in 10% NaOH, filtered and the filtrate extracted with 35% HCl, filtered, dried and then characterized using FT-IR and NMR.
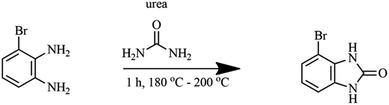 |
| | Scheme 1 Synthesis of 3-bromo-benzimidazolone. | |
Polymerization of 3-bromo benzimidazolone
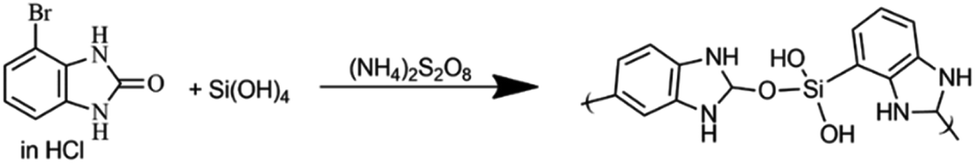
Prepared 3-bromo-benzimidazolone was polymerized by modifying the method described by Mdlalose et al.28 Silica and benzimidazolone (mole ratio 2:1) were dissolved in 50 mL, 0.1 M HCl and stirred in a beaker over ice bath for 3 h. A volume of 25 mL 0.6 M ammonium persulphate in HCl was then added dropwise into the reaction mixture and stirring was continued for 24 h (Scheme 2). The reaction was then quenched by the addition of acetone and filtered. The filtrate was evaporated to dryness at 60 °C to obtain solutes which were characterized and used in adsorption experiments.
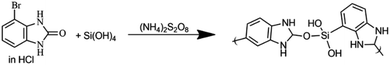 |
| | Scheme 2 Polymerization of 3-bromo benzimidazolone. | |
Response surface optimization of oil removal
The synthesized polymer was used in the optimization tests as described by Izevbekhai et al.29,30 Variable amounts of adsorbent were put in sealed tea bags and placed in a constant volume of SOWW. To test the effect of the tea bags, empty tea bags were sealed and used in similar experiments. The setup was allowed to stand for some time. After this, the solution was filtered and the TOC of the treated and untreated SOWW was measured using a spectroquant UV spectrophotometer. The percentage oil removal was calculated using eqn (1).| |
 | (1) |
where Ci and Cf are the oil concentrations (mg L−1) before and after treatment with adsorbent respectively.
Experimental design
Percentage oil removal was optimized by varying the weight of 3-bromo benzimidazolone polymer, initial oil concentration and contact time using the central composite design in the response surface methodology (RSM) software. The range of optimized parameters are listed in Table 1.
Table 1 Range of optimized parameters
| Parameter |
Low |
High |
| Oil concentration (mg L−1) |
192 |
9250 |
| Sorbent dosage (g) |
0.0011 |
0.004 |
| Contact time (h) |
16.0 |
60.5 |
Results and discussion
Functional group analysis
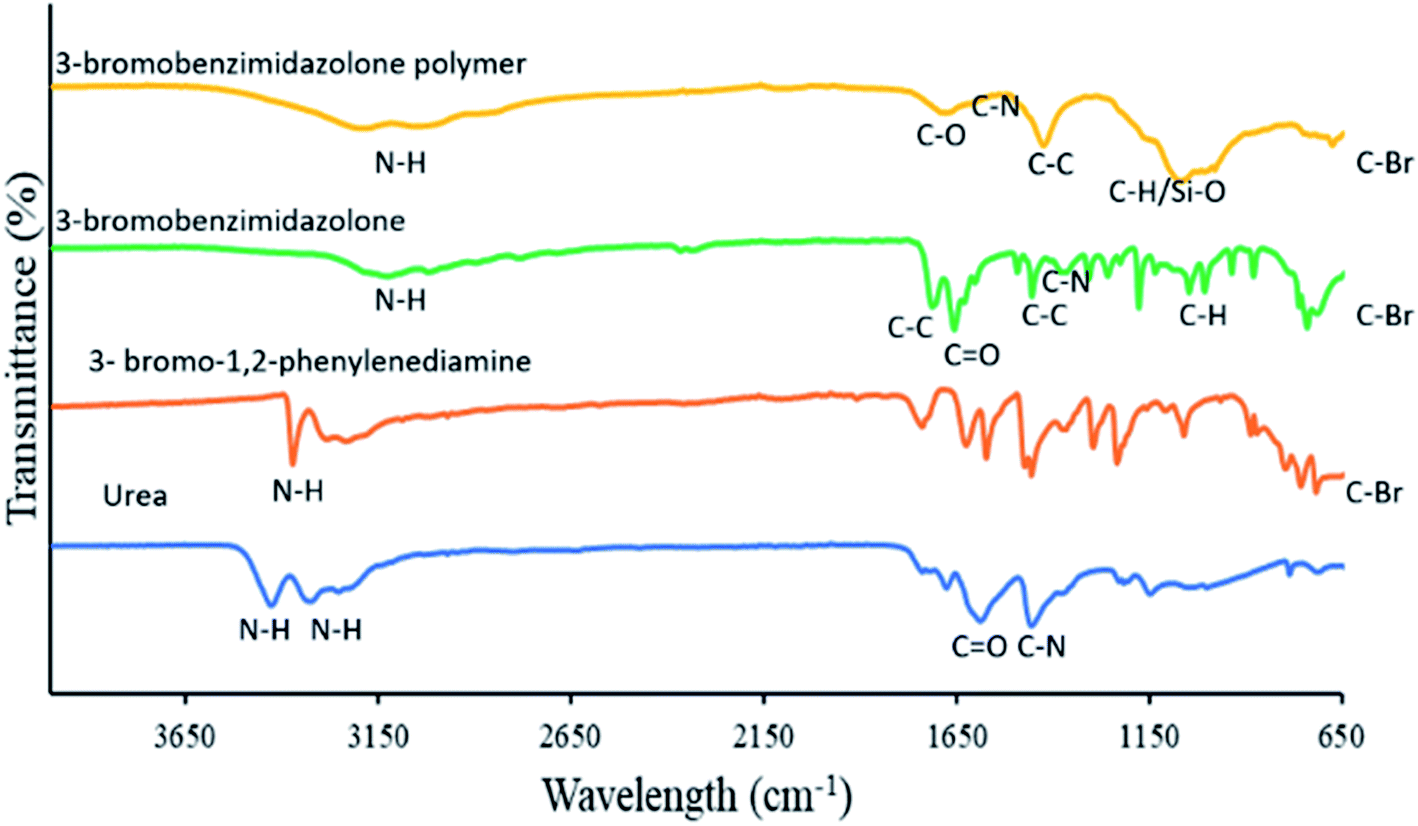
Fig. 1 shows the FT-IR spectra of 3-bromo-1,2-diaminobenzene, urea and the synthesised 3-bromo-benzimidazolone. The spectrum for 3-bromo-1,2-diaminobenzene exhibited bands at 620 cm−1 due to C–Br, 797 cm−1, 1060 cm−1 (CH out of plane), 1234 cm−1, 1295 cm−1 (CH plane), 1367 cm−1, 1625 cm−1 (C–N stretching vibration), 1456 cm−1, 1573 cm−1 and 1738 cm−1 (aromatic CC) as well as 3282 cm−1 and 3371 cm−1 due to N–H bonds. The product (3-bromo-benzimidazolone) showed distinctive bands, for example, the bands at 1458 cm−1 and 1599 cm−1 are characteristic of the CC stretching of the benzene ring,31 band at 3117 cm−1 is characteristic of N–H stretching bands of benzimidazoles.32 This band was seen to be broad probably due to OH groups formed as a result of tautomerism in the benzimidazolone ring and also as a result of intra-molecular hydrogen bonding.33 Also worthy of note was the fact that the band for asymmetric N–H stretching seen in the spectrum for 3-bromo-1,2-diaminobenzene, was absent in the 3-bromobenzimidazolone spectrum because the primary NH2 group (amine) in the former becomes a secondary NH group (amine) in the later. There was also an observed red shift in band for the CO group in urea from 1678 cm−1 to 1629 cm−1. This could have been as a result of increased electronegativity of the oxygen atom (with contributions from tautomerism) and a subsequent increase in intra-molecular hydrogen bonding leading to the observed red shift in wavelength. FT-IR analysis of the 3-bromo benzimidazolone polymer showed the presence of Si–O–C bond at about 1085.41 cm−1.34,35 The transmission band was broad with shoulders indicating that there was also contribution from C–H out of plane band. There was also a broad band of N–H bond between 3172–3380 cm−1 (ref. 32) and there was a shift and a decrease in the intensity of the carbonyl band from 1629 cm−1 to 1680 cm−1 as well as a change from CO to C–O possibly because of the formation of a bond with Si. As a result of increased conjugation, a decrease in intensity and a shift in the C–N band from 1454 cm−1 to 1499 cm−1 was also observed.36 A decrease in the intensity and number of CH out of plane bands of the benzene ring was noticed. This could be attributed to the formation of phenylene units through polycondensation.36
 |
| | Fig. 1 FTIR spectra for urea, 3-bromo-1,2-phenylenediamine, 3-bromobenzimidazolone and 3-bromobenzimidazolone polymer. | |
Structure elucidation of 3-bromo benzimidazolone polymer
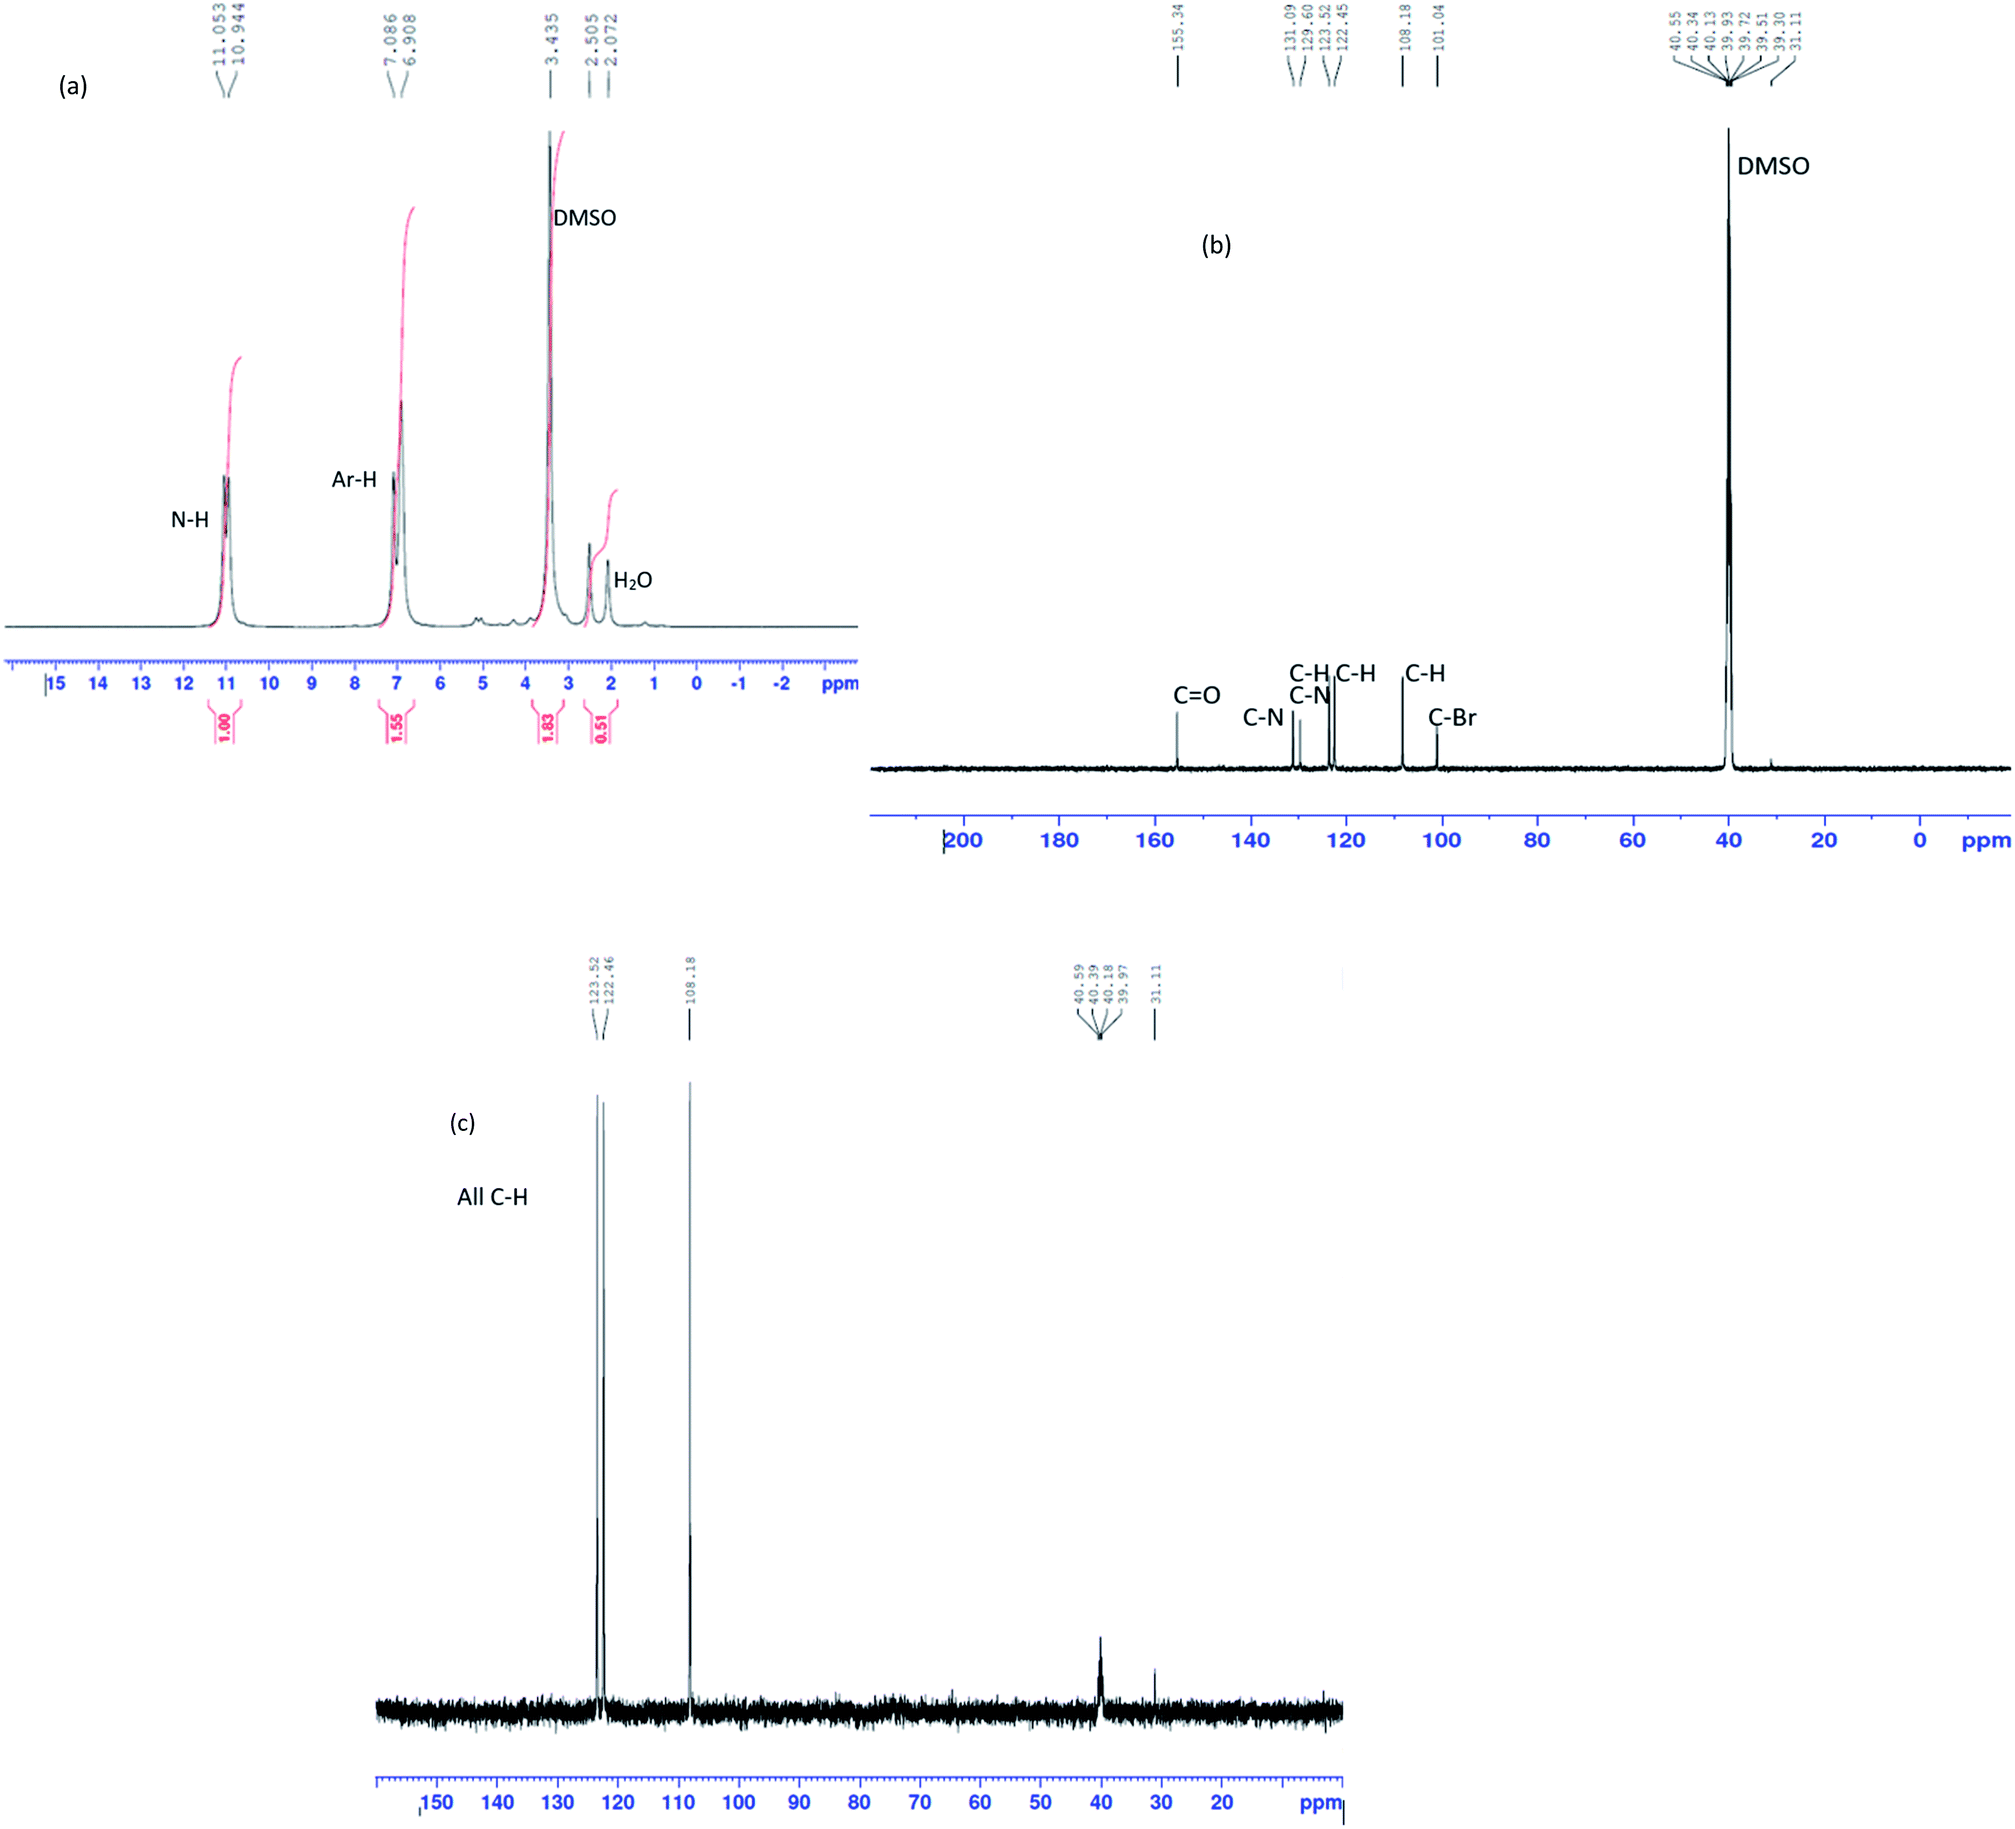
The 1H NMR peaks in Fig. 2(a) shows chemical shifts of Ar-H at 6.9 ppm and 7.0 ppm.37 Chemical shifts at this position is usually due to immobile protons.38 This therefore suggested electron redistribution in the benzimidazole ring and confirmed that tautomerism exists in the benzimidazolone ring and could have caused the broad transmission band observed on the IR spectrum for the 3-bromo benzimidazolone. It also shows chemical shifts of N–H at 11.0 and 10.9 ppm.37 The 13C NMR peaks on Fig. 2(b) indicated chemical shifts for a total of seven carbon atoms. This is in line with the chemical formula C7H5BrN2O, of 3-bromo-benzimidazolone. The chemical shifts were assigned as follows: CO at 155.3 ppm, C–N at 131.09 ppm and 129.6 ppm, Ar C–H at 123.5 ppm, 122.4 ppm and 108.1 ppm and C–Br at 101.04 ppm.39 The chemical shifts on the 13C NMR are confirmed by the DEPT (Fig. 2(c)) chemical shifts. These had all positive amplitudes which indicated that all seven carbon atoms present in the 13C NMR were CH. The absence of negative amplitudes shows the absence of CH2 peaks40 confirming that all C atoms in the bromo benzimidazolone are unsaturated.
 |
| | Fig. 2 (a) 1H, (b) 13C and (c) DEPT NMR of 3-bromo-benzimidazolone. | |
Morphological studies
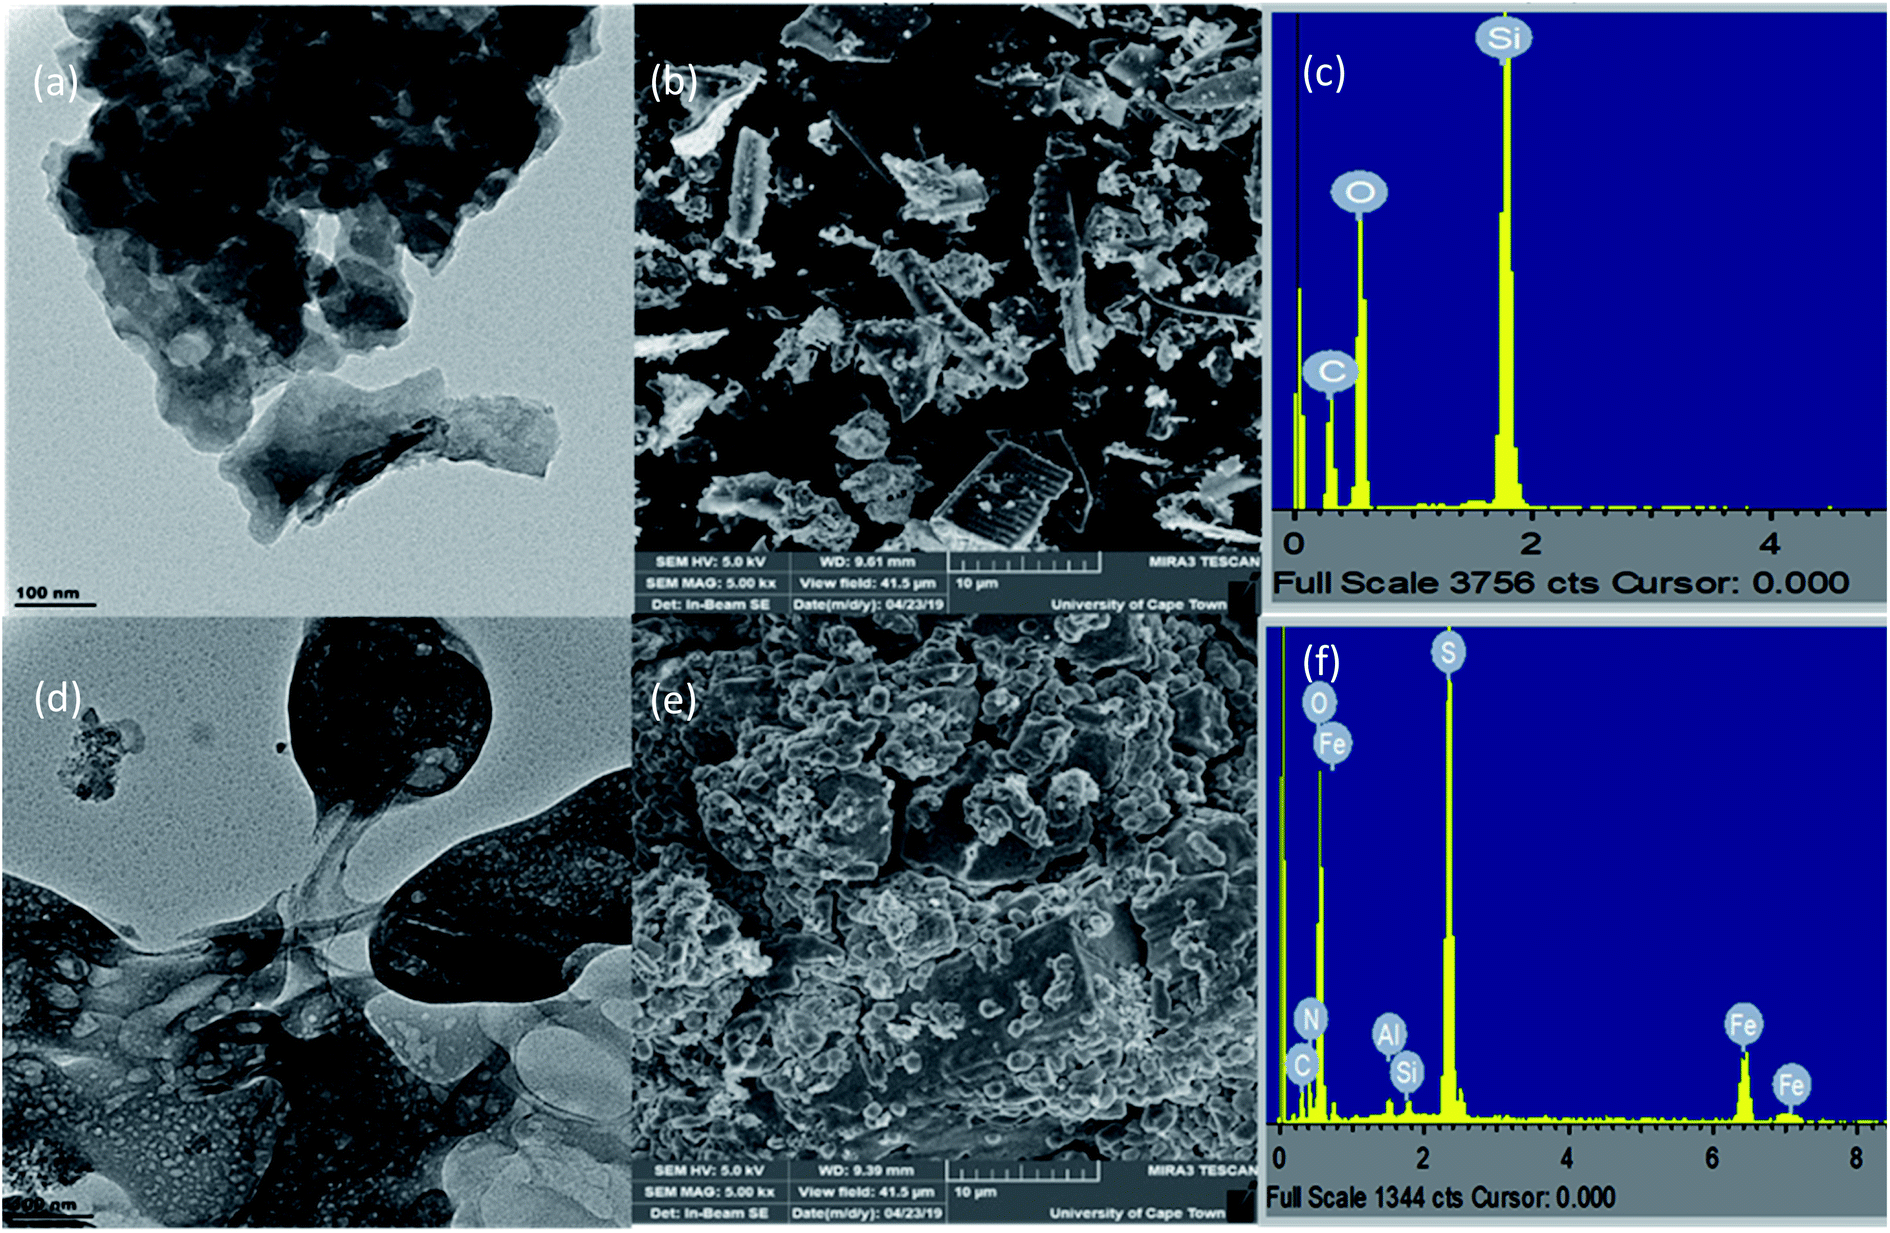
As seen in the TEM image (100 nm) of the modified silica (Fig. 3(d)) shows an oily like surface as a result of its recovery from solution. On the SEM image (magnification of 5000×) in Fig. 3(b) pores are evident on the surface of razor-like crystals of silica while the SEM image of the 3-bromo benzimidazolone modified silica (Fig. 3(e)) showed a rough surface with clearly defined pores which shows it could be a good adsorbent. The EDX of the unmodified silica (Fig. 3(c)) shows silicon and oxygen as major elements while the benzimidazolone modified silica (Fig. 3(f)) shows the presence of silicon and oxygen from silica, nitrogen from the benzimidazolone ring and other unreacted elements from the synthesis. This served as extra confirmation of the of the final product.
 |
| | Fig. 3 TEM, SEM and EDX of unmodified silica (a)–(c) and 3-bromo-benzimidazolone modified silica (d)–(f). | |
Response surface experiments and model fitting
The quadratic model of the central composite design of the response surface methodology (RSM) was used for modelling experiments altering three reaction parameters: initial oil concentration (mg L−1), adsorbent dosage (g) and contact time (h). The actual percentage removal as calculated using eqn (1) are presented in Table S1.† The colour of the adsorbent treated water had an inverse relationship with the percentage oil adsorption. The more intense the colour, the lower the percentage removal and vice versa. However, in experiments carried out with empty tea bags, the colour of the treated water remained the same. This is consistent with results reported by Izevbekhai et al.30 who studied the effect of empty tea bags on oil adsorption. The trends observed in the table are presented in the 3D surface plots.
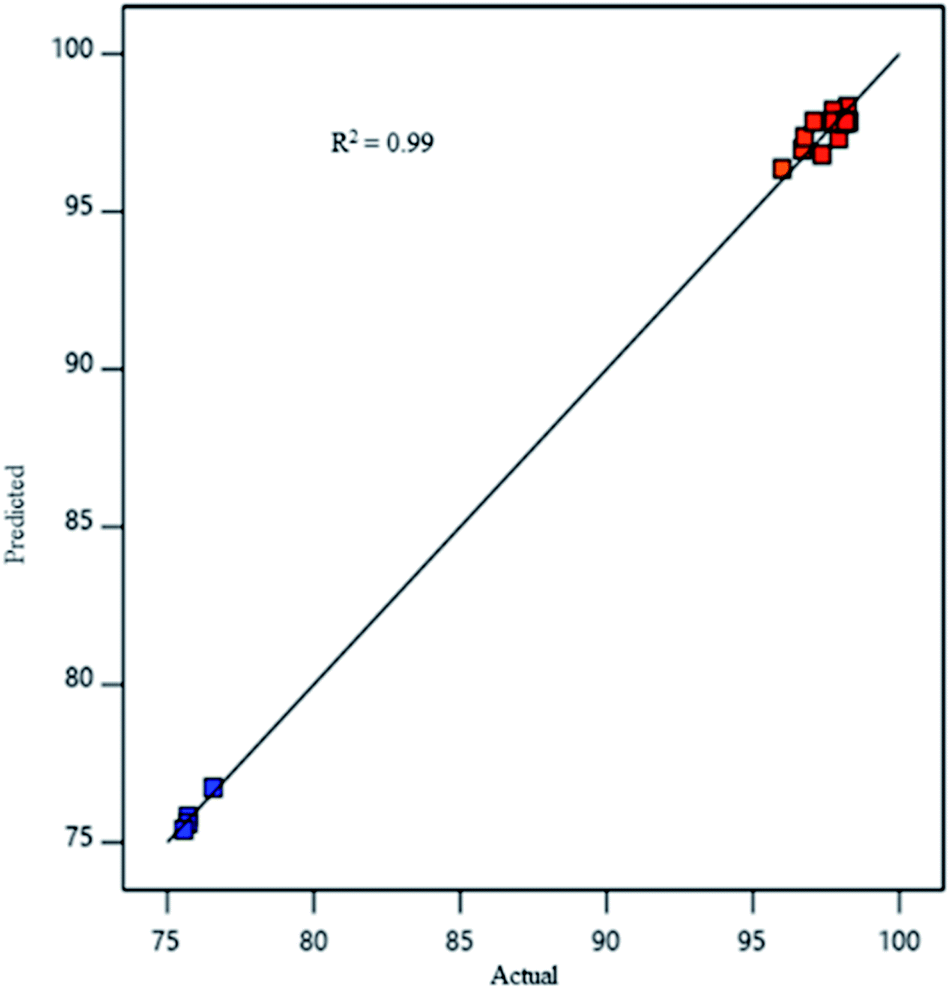
A graph of model predictions (Fig. 4) of oil removal percentage from synthetic oily wastewater was plotted against the values obtained from experiments. A straight line, with most points distributed on the line and a few very close to the line, was obtained. The coefficient of determination R2 was found to be 0.99 indicating that the predicting response of the model is good.41,42
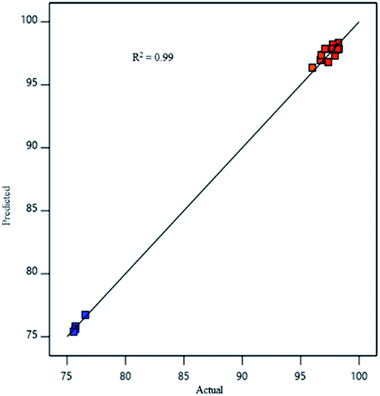 |
| | Fig. 4 Comparison between values predicted by response surface methodology (RSM) model and experimentally determined values. | |
Regression model and analysis of variance (ANOVA)
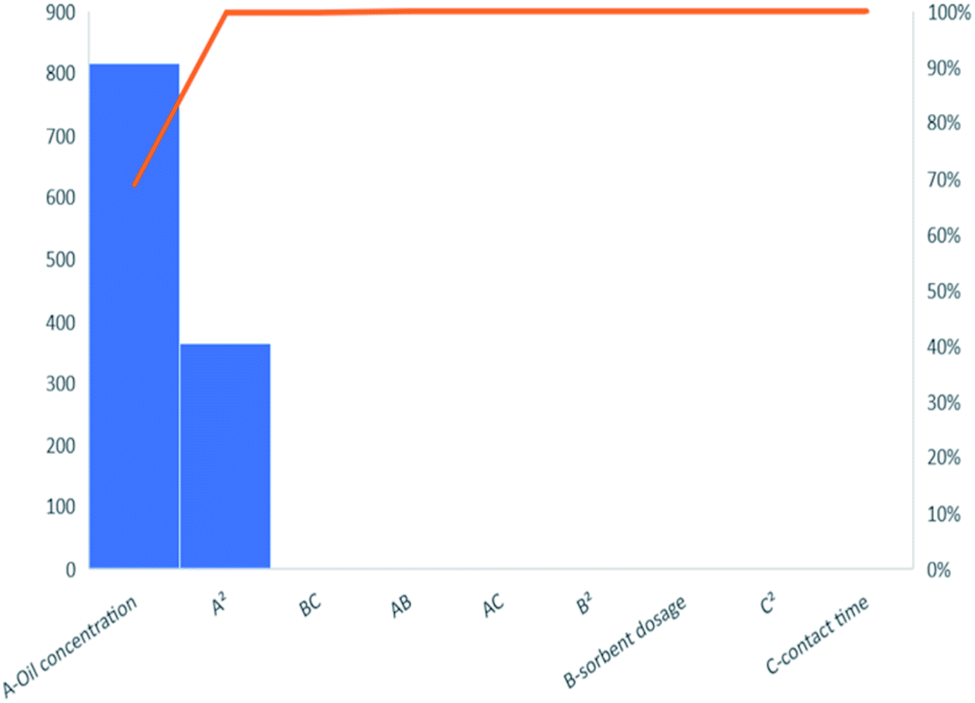
Analysis of variance (ANOVA) was used to find out which of the model terms were statistically significant. The values are presented in Table S2† and summarized in the Pareto chart in Fig. 5. Pareto charts typically highlight the most important among a large set of data by plotting a series of bar graphs in descending order with the most important factor on the far left. The Pareto chart in Fig. 5 shows that the most significant factors affecting oil adsorption is the initial oil concentration and its quadratic function. Table S2† showed that the quadratic polynomial model employed in the representation of percentage adsorption was significant (p-value less than 0.05 and high F-value) which means that the model was sufficient to represent the design space just like a line of best fit. The lack of fit P-value, which was high and therefore not significant, further proved that the model was good. As seen from the Pareto chart, Table S2† also showed that only initial oil concentration and its quadratic function had an effect on the percentage oil removal.
 |
| | Fig. 5 Pareto charts of contribution of model terms to percentage yield. | |
Effect of oil concentration and sorbent dosage
As the response surface plot (Fig. 6) shows, an increase in initial oil concentration caused an increase in percentage adsorption up to a maximum and started to decrease. This could be because as the oil concentration is increased, larger oil droplets are formed by the coming together of smaller droplets due to the coagulative effect of the adsorbents. These large oil droplets become trapped in the pores of the adsorbent and settle at the base, leaving the water clear.29,30,43 This could also be because of the introduction of new binding sites as the dosage is increased but as these get saturated, the adsorption capacity begins to reduce.44–46 With adsorbent dosage, there is a slight increase in adsorption capacity as the adsorbent dosage is increased because of an increase in the binding sites.
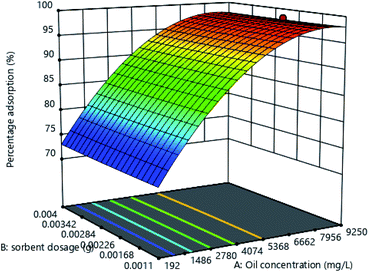 |
| | Fig. 6 Response surface plot for the effect of initial oil concentration and adsorbent dosage on percentage adsorption. | |
Effect of oil concentration and time
The 3D graph in Fig. 7 shows an increase in percentage oil removal with time. This could be as a result of an increase in the number of positive interactions between the 3-bromo benzimidazolone polymer adsorbent and oil, as the adsorbent stayed in longer contact with the oily solution.29,30,45
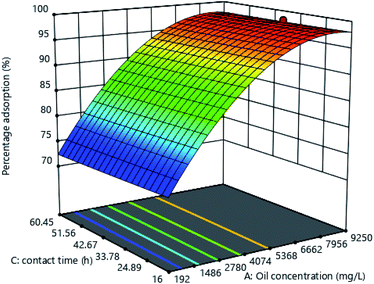 |
| | Fig. 7 Response surface plot for the effect of initial oil concentration and time on percentage adsorption. | |
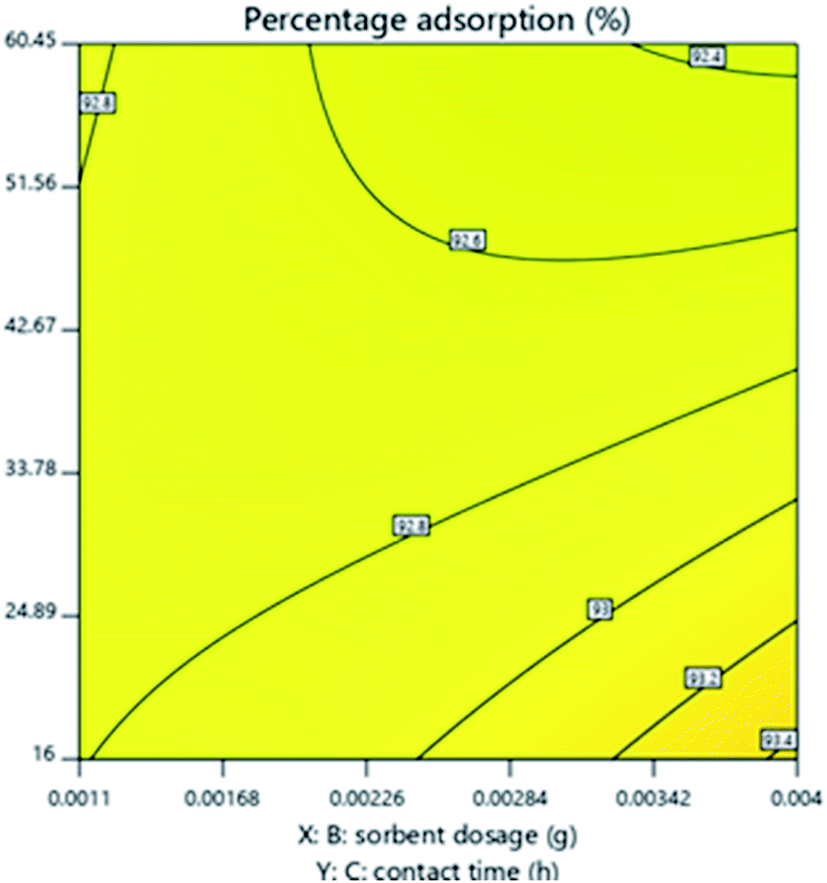
Effect of adsorbent dosage and time
As can be seen from the response surface contour plot in Fig. 8, which represents the effect of adsorbent dose and time on percentage adsorption, as time and adsorbent dosage increased, the percentage adsorption also increased. The reason for this is, as the dosage was increased, the number of binding sites were also increased and with increase in time, there was prolonged interaction between the oil molecules and the binding sites.29,30,46
 |
| | Fig. 8 Response surface contour plot for the effect of contact time and adsorbent dosage on percentage adsorption. | |
Comparison to other similar adsorbents
The adsorption capacity of 3-bromo-benzimidazolone polymer has been compared with other adsorbents in Table 2. As can be seen from the table, the adsorption capacity of 3-bromo-benzimidazolone is comparable to other adsorbents employed in literature. This makes 3-bromo-benzimidazolone a promising adsorbent in the treatment of oily wastewater.
Table 2 Comparison of adsorption capacity for different adsorbents
| Adsorbent |
Type of oil studied |
Sorption capacity (mg g−1) |
Reference |
| Silica aerogels |
Dibutylphthalate |
3500 |
47 |
| Carbon nanotube polymer composite |
Phenol |
262 |
48 |
| Polypyrrole–Si complex |
Synthetic oily wastewater (SOWW) |
8451 |
30 |
| Carbon–silica composite |
n-Hexane |
442 |
49 |
| 3-Bromo-benzimidazolone polymer |
SOWW |
5196 |
This study |
Conclusions
In this study, 3-bromo-benzimidazolone polymer was successfully synthesized by first synthesizing the benzimidazolone via a solvent free process. The synthesized bromo benzimidazolone was then functionalized on pre-extracted silica gels as an oil sorbent material. The oil adsorption performance of this polymer–silica sorbent material in synthetic oily wastewater (SOWW) was then optimized using response surface methodology. It was found that the central composite model chosen was adequate to represent the relationship between the optimized parameters: initial oil concentration, adsorbent dosage and contact time. The results demonstrated that oil removal by adsorption onto benzimidazolone modified silica is feasible. The adsorption and percentage removal were found to be dependent on the adsorbent dose, initial oil concentration and contact time with initial oil concentration being the major determinant of oil adsorption. The optimum conditions for removal of oil from synthetic oily wastewater using silica functionalized with benzimidazolone were as follows 6650 mg L−1 oil concentration, with adsorbent dosage of 0.004 g and a duration of 16 h. The percentage oil adsorption using these optimum conditions was found to be 97.9%. Given the percentage oil removal, then optimum duration of adsorption and the fact that oil adsorption takes place with stirring or shaking or any form of mechanical agitation, the benzimidazolone modified silica adsorbent can be applied in field wastewaters. In addition, preliminary studies suggests that mechanical pressure followed by drying at 60 °C gives the adsorbents a potential for regeneration.
Author contributions
Conceptualization, O. U. I. and W. M. G.; methodology, O. U. I.; software, O. U. I.; investigation, O. U. I.; resources, W. M. G.; writing—original draft preparation, O. U. I., W. M. G. and N. T. T.; writing—review and editing, O. U. I., W. M. G., N. T. T., W. B. A., R. M.; supervision, W. M. G. and N. T. T.; funding acquisition, W. M. G. All authors have read and agreed to the published version of the manuscript.
Conflicts of interest
There are no conflicts to declare.
References
- J. M. Wilson and J. M. VanBriesen, Environ. Pract., 2012, 14, 288–300 CrossRef.
- J. Pichtel, Appl. Environ. Soil Sci., 2016, 2016, 1–24 CrossRef.
- X. Li, C. Zhang and J. Liu, Min. Sci. Technol., 2010, 20, 778–781 CAS.
- I. M. Cozzarelli, K. J. Skalak, D. B. Kent, M. A. Engle, A. Benthem, A. C. Mumford, K. Haase, A. Farag, D. Harper, S. C. Nagel, L. R. Iwanowicz, W. H. Orem, D. M. Akob, J. B. Jaeschke, J. Galloway, M. Kohler, D. L. Stoliker and G. D. Jolly, Sci. Total Environ., 2017, 579, 1781–1793 CrossRef CAS PubMed.
- X.-N. Cheng and Y.-W. Gong, Environ. Eng. Res., 2018, 23, 159–163 CrossRef.
- M. Han, J. Zhang, W. Chu, J. Chen and G. Zhou, Water, 2019, 11, 2517 CrossRef CAS.
- S. Noamani, S. Niroomand, M. Rastgar and M. Sadrzadeh, npj Clean Water, 2019, 2, 20 CrossRef CAS.
- M. N. Rashed, in Organic Pollutants-Monitoring, Risk and Treatment, ed. M. N. Rashed, InTech Publisher, Rijeka, Croatia, 2013, ch. 7, pp. 167–194 Search PubMed.
- L. Yu, M. Han and F. He, Arabian J. Chem., 2017, 10, S1913–S1922 CrossRef CAS.
- M. K. Dinker and P. S. Kulkarni, J. Chem. Eng. Data, 2015, 60, 2521–2540 CrossRef CAS.
- H. Moazed and T. Viraraghavan, Energy Sources, 2005, 27, 101–112 CrossRef CAS.
- H. X. Jin, B. Dong, B. Wu and M. H. Zhou, Polym.-Plast. Technol. Eng., 2012, 51, 154–159 CrossRef CAS.
- C. Y. Wang, L. Li and S. X. Zheng, RSC Adv., 2016, 6, 105840–105853 RSC.
- L. H. Yan and D. F. Zhao, Arid Environmental Monitoring, 1998, 12, 139–144 Search PubMed.
- W. Stöber, A. Fink and E. Bohn, J. Colloid Interface Sci., 1968, 26, 62–69 CrossRef.
- I. J. Fernandes, D. Calheiro, F. A. L. Sánchez, A. L. D. Camacho, T. L. A. d. C. Rocha, C. A. M. Moraes and V. C. d. Sousa, Mater. Res., 2017, 20, 512–518 CrossRef.
- A. B. D. Nandiyanto, F. Iskandar and K. Okuyama, Chem. Lett., 2008, 37, 1040–1041 CrossRef CAS.
- O. Izevbekhai, A. Mavrova and K. Anichina, presented in part at the 13th National Poster Session for Young Scientists, Students and Doctorate Students, University of Chemical Technology and Metallurgy, Sofia, Bulgaria, 2016 Search PubMed.
- A. Mavrova, K. Anichina, O. Izevbekhai, D. Vutchev, G. Popova-Daskalova, D. Yancheva and S. Stoyanov, J. Chem. Technol. Metall., 2021, 56, 3–9 Search PubMed.
- S. Samai and K. Biradha, Chem. Mater., 2012, 24, 1165–1173 CrossRef CAS.
- H. Lgaz, Y. El Aoufir, Y. El Bakri, A. Zarrouk, R. Salghi, I. Warad, Y. Ramli, A. Guenbour, E. M. Essassi and H. Oudda, J. Mater. Environ. Sci., 2017, 8, 3290–3302 Search PubMed.
- O. U. Izevbekhai, W. M. Gitari and N. T. Tavengwa, presented in part at the 20th WaterNet/WARFSA/GWPSA Symposium, Indaba Hotel, Spa & Conference Centre Fourways, Johannesburg, South Africa, 2019 Search PubMed.
- O. Izevbekhai, W. M. Gitari and N. T. Tavengwa, S. Afr. J. Chem., 2020 Search PubMed , in press.
- B. Shoba, J. Jeyanthi and S. Vairam, Environ. Technol., 2018, 1–16, DOI:10.1080/09593330.2018.1543353.
- A. Mavrova, S. Dimov and O. Izevbekhai, Proceedings of the II-nd International Scientific and Practical Conference - The goals of the World Science, Dubai, UAE, 2016, vol. 6, pp. 13–15 Search PubMed.
- O. Izevbekhai, K. Anichina-Zarkova, A. Mavrova, D. Vutchev, G. Popova-Daskalova, D. Yancheva and S. Stoyanov, 1st International Balkan Chemistry Congress, Edirne, Turkey, 2018, vol. 1, p. 237 Search PubMed.
- Z. Yang, J. Wang, L. Li, C. Ye and H. Liu, J. Heterocycl. Chem., 2009, 46, 788–790 CrossRef CAS.
- L. Mdlalose, M. Balogun, K. Setshedi, M. Tukulula, L. Chimuka and A. Chetty, Appl. Clay Sci., 2017, 139, 72–80 CrossRef CAS.
- O. U. Izevbekhai, W. M. Gitari, A. Wasiu B, N. T. Tavengwa and R. Mudzielwana, J. Taibah Univ. Sci., 2020, 14, 1033–1041 CrossRef.
- O. U. Izevbekhai, W. M. Gitari, N. T. Tavengwa, W. B. Ayinde and R. Mudzielwana, Molecules, 2020, 25, 4628 CrossRef CAS PubMed.
- D. S. Ramadhan, Warsito and E. D. Iftitah, IOP Conf. Ser.: Mater. Sci. Eng., 2018, 299, 012076 Search PubMed.
- A. Abdolmaleki and Z. Bazyar, Polym.-Plast. Technol. Eng., 2013, 52, 1542–1549 CrossRef CAS.
- H. Abdeldjebar, Y. Belmiloud, W. Djitli, S. Achour, M. Brahimi and B. Tangour, Prog. React. Kinet. Mech., 2019, 44, 143–156 CrossRef CAS.
- A. Kasinathan, R. Rama and G. Sivakumar, International Journal of Nanotechnology and Applications, 2010, 4, 61–66 Search PubMed.
- R. Tian, O. Seitz, M. Li, W. Hu, Y. J. Chabal and J. Gao, Langmuir, 2010, 26, 4563–4566 CrossRef CAS.
- S. Anand and A. Muthusamy, J. Mol. Struct., 2017, 1148, 254–265 CrossRef CAS.
- M. El-Naggar, W. M. Eldehna, H. Almahli, A. Elgez, M. Fares, M. M. Elaasser and H. A. Abdel-Aziz, Molecules, 2018, 23, 1420 CrossRef PubMed.
- D. Zhang and L. Yan, J. Phys. Chem. B, 2010, 114, 12234–12241 CrossRef CAS PubMed.
- D. Smith, Chemistry of Heterocyclic Compounds: Benzimidazoles and Cogeneric Tricyclic Compounds, Part 1, 2008, ch. vol. 3, pp. 331–389, DOI:10.1002/9780470187159.
- B. Eberhard, Structure elucidation by NMR in organic chemistry – a practical guide, John Wiley and Sons Ltd, West Sussex, 2002 Search PubMed.
- J. U. Ani, U. C. Okoro, L. E. Aneke, O. D. Onukwuli, I. O. Obi, K. G. Akpomie and A. C. Ofomatah, Appl. Water Sci., 2019, 9, 60 CrossRef.
- L. C. Zhao, J. Liang, W. Li, K. M. Cheng, X. Xia, X. Deng and G. L. Yang, Molecules, 2011, 16, 5928–5937 CrossRef CAS PubMed.
- G. Carlos, C. Juan, S. Wang, G. Luis, R. S. Mohan and S. Ovadia, SPE Journal, 2002, 7, 353–372 CrossRef.
- N. Syuhada, R. Mohd Ghazi and N. Ismail, Malaysian Journal
of Analytical Sciences, 2017, 21, 1101–1110 Search PubMed.
- A. A. Hassan, H. T. Naeem and R. T. Hadi, IOP Conf. Ser.: Mater. Sci. Eng., 2019, 518, 062003 CAS.
- S. Rahdar, M. Taghavi, R. Khaksefidi and S. Ahmadi, Appl. Water Sci., 2019, 9, 87–95 CrossRef.
- R. Filipovic, D. Lazić, M. Perusic and I. Stijepović, Process. Appl. Ceram., 2010, 4, 265–269 CrossRef CAS.
- T. A. Saleh, A. Sarı and M. Tuzen, J. Environ. Manage., 2019, 252, 109660 CrossRef CAS PubMed.
- L. Fu, J. Zhu, W. Huang, J. Fang, X. Sun, X. Wang and K. Liao, Processes, 2020, 8, 372 CrossRef CAS.
Footnote |
| † Electronic supplementary information (ESI) available. See DOI: 10.1039/d0ra10848k |
|
| This journal is © The Royal Society of Chemistry 2021 |
Click here to see how this site uses Cookies. View our privacy policy here. 
 Open Access Article
 This Open Access Article is licensed under a Creative Commons Attribution-Non Commercial 3.0 Unported Licence
 *a,
Wilson Mugera Gitari*a,
Nikita Tawanda Tavengwab,
Wasiu Babatunde Ayindea and
Rabelani Mudzielwanaa
*a,
Wilson Mugera Gitari*a,
Nikita Tawanda Tavengwab,
Wasiu Babatunde Ayindea and
Rabelani Mudzielwanaa