
 Open Access Article
 This Open Access Article is licensed under a Creative Commons Attribution-Non Commercial 3.0 Unported Licence
Electrochemical bubble generation via hydrazine oxidation for the in situ control of an electrodeposited conducting polymer micro/-nanostructure
David Possetto,
Luciana Fernández,
Gabriela Marzari and
Fernando Fungo *
*
Instituto de Investigaciones en Tecnologías Energéticas y Materiales Avanzados, (UNRC-CONICET) Departamento de Química, Universidad Nacional de Río Cuarto, Agencia Postal 3 (X5804BYA), Río Cuarto, Argentina. E-mail: ffungo@exa.unrc.edu.ar
First published on 16th March 2021
Abstract
Herein, a simple, in situ, on step and highly repeatable electrochemical method that allows controlling the nanostructure of electrodeposited polymer films is reported. As an example, the tuning of the electrodeposited polypyrrole nanostructures using inert gas bubbles as the template at the electrode surface generated by the electrochemical oxidation of hydrazine is shown. The hydrazine discharge occurs at a lower potential regarding the beginning of pyrrole electropolymerization process, which allows the modulation of the density and size of the bubbles on the surface electrode controlling electrochemical parameters (applied potential, concentration, time, etc.). Subsequently, the applied potential is moved to where the pyrrole polymerization begins, which induces the material discharges around the bubble template producing polypyrrole hollow structures with definite patterns on the electrode surface. This methodology is proposed as a simple model for the electrodeposition with the morphological control of a wide range of conductive polymers.
Introduction
Great research efforts are nowadays made to develop organic conducting polymers due to their great importance for numerous applications, such as biological1 or chemical sensors,2,3 energy conversion and storage,4–6 electronic and optoelectronic devices,7,8 solar cells,9,10 and lighting systems.11 This wide range of potential applications demands multifunctional materials with specific physicochemical properties (light interaction absorption and/or emission, charge transport, solubility, adequate chemical stability for the device operating exigency, precise relative position in the energy scale of the valence-conduction bands regarding the device's contact work functions, biocompatibility, etc.), which can be tailored owing to the infinite versatility of the organic chemistry.12 On the other hand, the working principles of many of those applications demand the use of polymer materials in solid-state as a thin film.13–19 Therefore, aside from the adequate physicochemical properties of organic conducting polymers, the material must be able to form films with the correct thickness and morphology (typically in micro-nanoscale) for a specific application. Thus, the techniques that allow controlling the thin film formation and its morphological characteristics are a central aspect in the dispositive construction; for example, n-p junction devices need smooth or flat film surfaces,14 while gas capture,15,16 drug delivery17,18 and capacitors19 demand structured films at the micro-nanoscale.There exist numerous wet methods for polymer film formation, such as spin coating, dip coating, and drop-casting, but among them electrochemical techniques stand out. Electrodeposition techniques only require the monomer to be soluble in the electrolyte solution, which shows several advantages: one of which is the fact that the film formed in one-step at room temperature allows a fine film thickness control with morphological surface tuning (e.g. smoothness, roughness, and porosity). All these properties are important parameters in the manufacture of different devices or applications.4,6
Nowadays, there are vast examples of electropolymerizable monomers that form organic conducting polymers with different capabilities or physiochemical properties.4,20–22 However, examples of one-step electropolymerization in which printed structures in the micro-nanoscale are under electrochemical control are less common. There are two main strategies for tuning the deposited film morphology by electropolymerization: one of them is a chemical intervention on the mechanism of polymer chain formation.23 In general, the oxidized monomer coupling releases protons and produces a heavier polymer chain that precipitates material on the electrode surface. For example, the electrochemical control of polypyrrole (PPy) mesostructures on a nanometric scale has been achieved by adding weak and strong acid anions into the electrolyte.24,25 Another elegant method in the electropolymerization process concomitantly forms oxygen and/or hydrogen bubbles by the electrochemically discharge of water in the electrode surface. As a consequence, the bubbles act as a template and make the polymer precipitation form ordered porous structures (in literature, this method is often called “template-less or one-step template-free electropolymerization”).24,26 Since its discovery, the interest in this technique has continuously increased.27 Thus, pyrrole electropolymerization in water with and without a surfactant to stabilize these gas bubbles during the polymer growth has been studied in literature.27–30 More recently, Guittard et al. have expanded a templateless electropolymerization approach in organic solvents without the use of surfactant (e.g., dichloromethane) and through molecular engineering they designed monomers that facilitate the film morphologic manipulation.31,32 Despite these advances, the new precursors that produce gas via their electrochemical discharge have not been explored yet.
In this context, we show the in situ electrochemical gas bubbles generation by discharging hydrazine (N2H4) in organic electrolytes as a template to manipulate the PPy nanostructure morphology. Hydrazine is composed of hydrogen and nitrogen atoms, and its anodic oxidation produces molecular nitrogen gas33–35 and its use has several advantages regarding water as a bubble template precursor: (i) its oxidation produces an inert gas at a lower potential value than water and most of the electropolymerizable monomers, which allow the formation of bubbles before the polymer film formation. (ii) It is possible to manipulate its concentration in the aqueous and nonaqueous electrolytes.
In this study, we demonstrate that through the control of the hydrazine concentration and electrochemical parameters, it is possible to get a precise tuning of the diameter and density of tubular or hollow structures on a PPy film synthesized by a one-step electrochemical method.
Experimental section
Materials and reagents
All reagents available were purchased from commercial sources. Solvents were purified by standard methods and dried, if necessary. All experiments were carried out at room temperature using hydrazine hydrate 50–60% (Merck) in 1,2-dichloroethane (DCE, Sintorgan), which was purified by simple distillation and stored over molecular sieves (Biopack, 3 Å) and CaCO3 (Riedel-de Haen, 95%), containing 0.1 M tetra-n-butylammonium hexafluorophosphate (TBAPF6) (Merck) as the supporting electrolyte.Electrochemical polymer film formation and film surface characterization
The pyrrole electropolymerization was induced by the voltamperometric technique in a DCE solution with 0.1 M TBAPF6 as the supporting electrolyte in a three-electrode cell using a CH instrument 700 E potentiostat. The used working electrode was indium-tin oxide (ITO) electrodes (Biotain Crystal Co., Ltd). The ITO electrodes were cleaned following this protocol: first, they were washed with water and neutral detergent using a brush and then ultrasonicated in distilled water, ethanol, and isopropyl alcohol. A silver wire and a loop of Pt wire were used as the quasi-reference and the counter electrode, respectively. The silver quasi-reference electrode was calibrated using ferrocenium/ferrocene couple (Fc+/Fc = 0.4 V vs. saturated calomel electrode).36 The film morphology was observed under a scanning electron microscope (SEM), Carl Zeiss EVO MA 10, operating at 3 kV, and the electrode was examined bare, without prior metal covering.The images were processed using the Fiji ImageJ software to obtain the density of PPy tubular structures and their inner diameter (Feret's diameter, a shape descriptor) in at least 4 images for each condition. To determine these parameters, the images were converted to binary (black/white) images using the Fiji software. To accomplish this, the brightness and contrast of each image were automatically adjusted by the software and a particular gray scale level (threshold) was selected. Then, all pixels with intensities higher than the threshold value were converted to “white,” while pixels with lower intensities than the threshold level were converted to “black”. The value of the threshold level was determined on the basis of an optimal resolution of the structures by performing a constant comparison with the original photo.
Results and discussion
The oxidation of hydrazine in aprotic solvents is a one-electron electrochemical process at ∼0 V vs. SCE that produces molecular nitrogen and ammonium ions as final products.34 The nitrogen gas released saturates the electrode nearby the electrolyte solution and small bubbles appear on the electrode surface. The generated bubbles proportionally grow with the current passing through the electrode until they reached a certain size and are then detached.33,34,37,38 As a consequence of the hydrazine oxidation, a gas evolution reaction is produced, which forms nitrogen bubbles that partially block the electrode surface decreasing the electrode area in contact with the electrolyte solution. This characteristic opens the possibility of using the generated bubbles as a template of electrochemically grown materials around them.PPy is a well-known conducting polymer utilized in a wide number of applications where the film morphology tuning plays an important role.13 PPy starts to electropolymerize at a higher potential (0.6–0.9 V vs. SCE) compared to the N2H4 discharge.34 Thus, the bubble size and density on the electrode surface formed from hydrazine discharge can be modulated applying a potential lower than the PPy oxidation and adjusting the electrochemical conditions used (electrochemical technique, concentration, and time). Subsequently, the applied potential is moved at higher values where the pyrrole polymerization begins, which induces material deposition around the bubble template producing structures with a determinate stamped morphology. Fig. 1 shows the SEM micrographs of the PPy-deposited patterns obtained via pyrrole electrochemical polymerization in the DCE electrolyte solution, with and without N2H4.
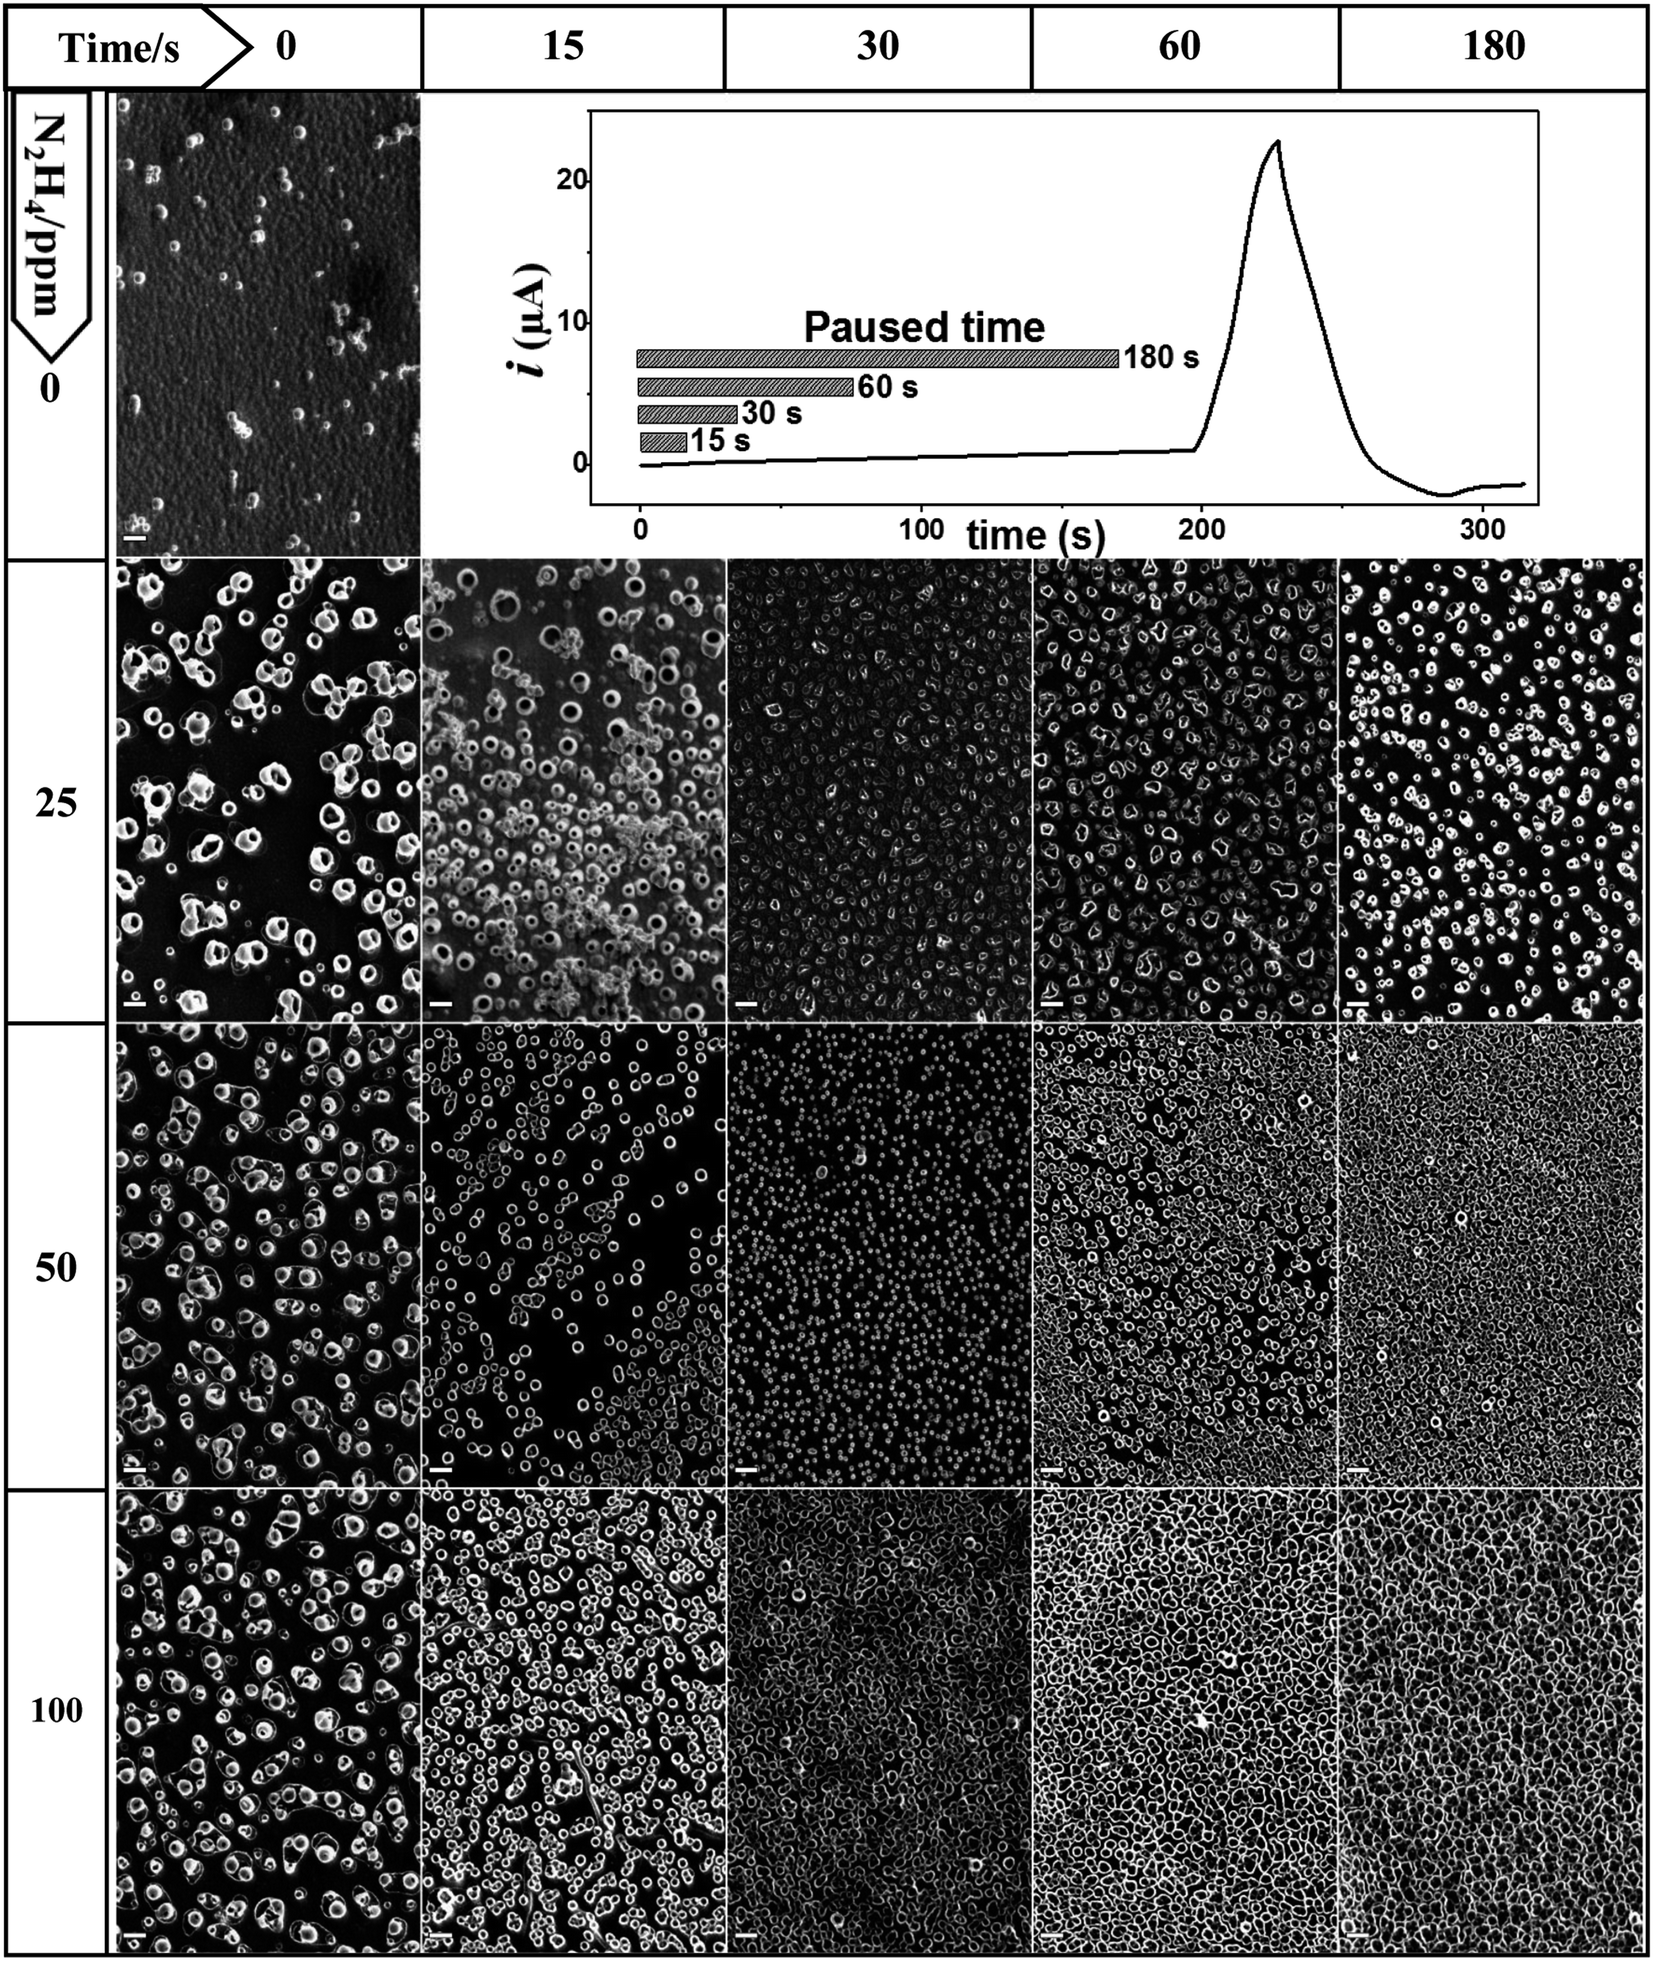 | ||
| Fig. 1 SEM images of the surface of the PPy film on the ITO electrode, which was electrodeposited from different N2H4 concentrations (rows: 0, 25, 50 and 100 ppm) and at different waiting times (columns: 0, 15, 30, 60 and 180 s) at 0.30 V. The pyrrole monomer concentration was fixed at 10 mM in the DCE solution containing 0.1 M TBAPF6 as the electrolyte. Scale bar: 2 μm. | ||
The growth of the nanostructures of PPy was carried out potentiodynamically via cyclic voltammetry and the same experimental parameters were utilized in all showed images (one growth voltammetry cycle from 0.30 to 0.70 V vs. SCE swept at 20 mV s−1). While the nitrogen bubble formation was controlled by varying the N2H4 concentration, the electrochemical discharge (or gas evolution) time was applied at a fixed potential. Thus, the cyclic voltammogram starts at 0.30 V vs. SCE, where the N2H4 oxidation proceeds under the diffusion limited condition, which produces nitrogen evolution at a potential that remains just below where the electrodeposition of polypyrrole starts. The initial potential (0.30 V) is applied for a time that varies from 0 to 180 s, where the bubbles are generated or incubated, and then, it is suddenly swept at 20 mV s−1 to reach the PPy deposition potential (see cyclic voltammograms as current vs. time in Fig. 1).
The SEM images of the PPy films shown in Fig. 1 are ordered in a table format, where each row represents different N2H4 concentrations (0, 25, 50 and 100 ppm), and the columns are the time of gas evolution applied at 0.30 V (0, 15, 30, 60 and 180 s). The first column cell ([N2H4] = 0 ppm, t = 0 s) shows a PPy film image obtained in the absence of N2H4 in comparison to the other generated surfaces. This PPy film fully and homogeneously coats the electrode surface and shows the typical globular-shaped features of an electrochemically grown polymer film.39,40 On the other hand, the addition of N2H4 to the electrolyte solution has a clear impact on the PPy electrodeposited film morphology. Now, hollow or tubular structures at the nanoscale dimension are generated on the film surface, and their size, shape and density depending on the N2H4 concentration and the bubble incubation time. Fig. 1 clearly shows that the increment in the N2H4 concentration and/or waiting time at 0.30 V induces arise on the tubular structure number per square millimeter of the electrode surface. For example, the PPy polymerization at 25 ppm of N2H4 produces a more compact tube distribution as the waiting time at 0.30 V increases; however, even after 180 s, the tube walls do not reach to touch each other. However, when the N2H4 concentration and gas evolution time are above 50 ppm and 60 s (30 s for 100 ppm), respectively, a very dense tube formation is stamped where the tube walls collapse in a homogeneous film structure that completely covers the electrode surface. Quantitatively speaking, this tendency is shown in Fig. 2, where it is observed that without bubble incubation time (t = 0 s), changes in the N2H4 concentration have little impact on the tube density dispersion producing 6.0 ± 0.5 × 10⁴, 17.2 ± 0.6 × 10⁴, and 16.3 ± 0.4 × 10⁴ unit per mm2 regarding higher N2H4 discharge time. Thus, as the N2H4 discharge at 0.30 V is kept longer, it is observed that changes in the N2H4 concentration produce a higher variation on the PPy tubular structures density. For example, by applying 60 s of bubble incubation, 25.7 ± 0.5 × 10⁴, 105.5 ± 0.9 × 10⁴, and 80.2 ± 0.6 × 10⁴ tubes are formed per mm2 for 25, 50 and 100 ppm of N2H4, respectively. On the other hand, if the N2H4 concentration is fixed (e.g. 50 ppm), significant changes in the structure density can be observed more than 10 times from 17.2 ± 0.6 × 10⁴ to 165.6 ± 0.9 × 10⁴ unit per mm2 after applying 0.30 V during 180 s. Moreover, the electrodeposited PPy tube density shows almost a linear growth between t = 0 and t = 30 s, and then at longer times, it approaches a plateau. The densest packaging of the hollow structures with the widest tuning of the PPy surface morphology of all explored experimental conditions is reached with 50 ppm of N2H4 (see Fig. 1 and 2).
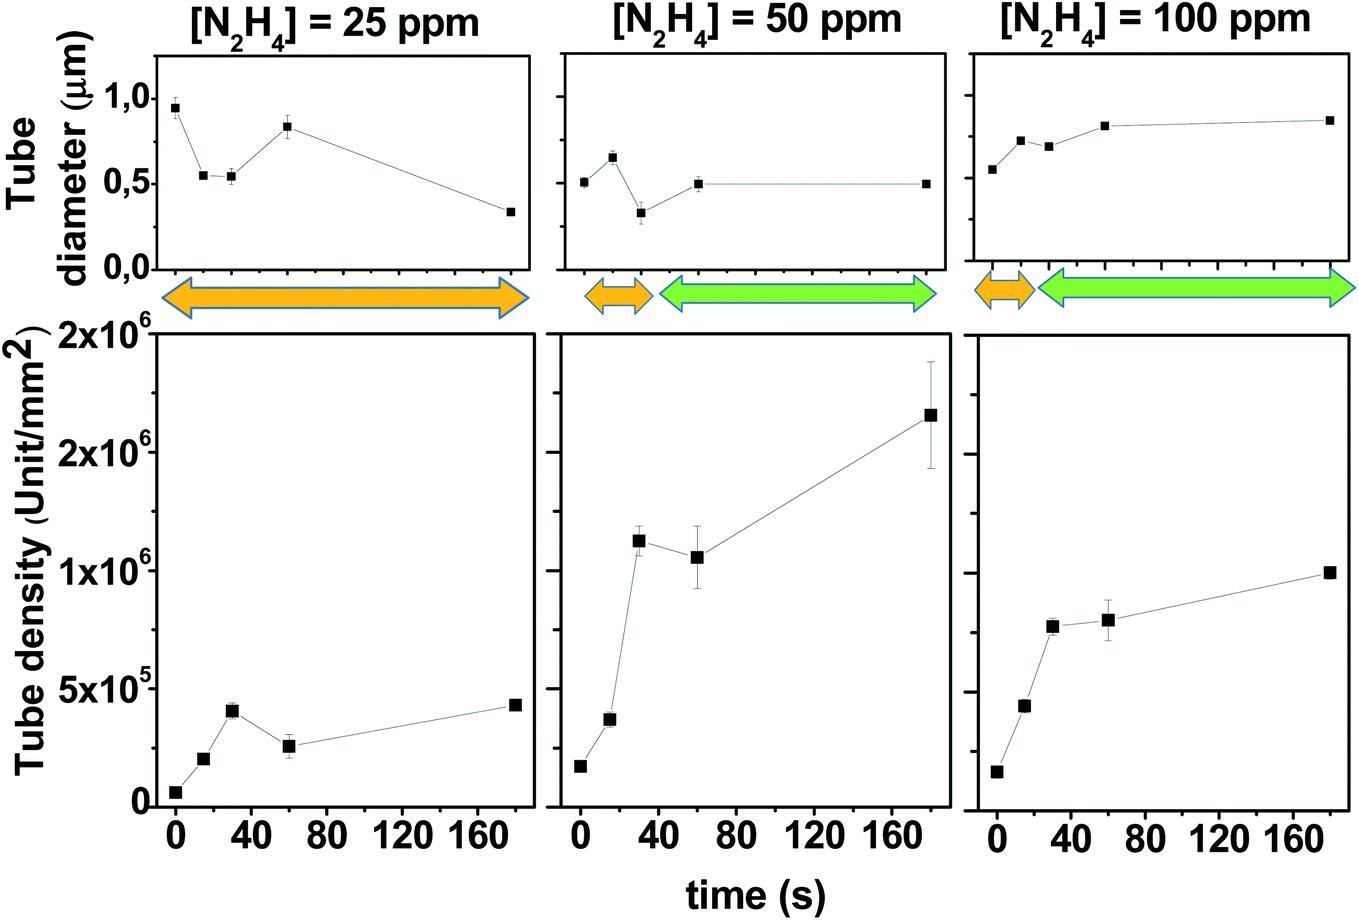 | ||
| Fig. 2 Variation of the inner tube diameter and tube density at different N2H4 concentrations as a function of the paused time at 0.30 V. The pyrrole monomer concentration was fixed at 10 mM in the DCE solution containing 0.1 M TBAPF6. The orange and green arrows indicate where the tubular structures are isolated or collapsed, respectively. | ||
On the other hand, Fig. 2 also shows the behavior of PPy tubes' internal diameter regarding the two main variable parameters that control the electrodeposition process: the N2H4 concentration and how long its electrochemical discharge takes at 0.30 V. The size range of the PPy tubes electrochemically formed oscillates between 300 nm and 1000 nm. If the variation in the PPy inner pore diameter is analyzed at a short bubble generation time (below 30 s), for the three N2H4 evaluated concentrations (25, 50 and 100 ppm), it can be observed that the diameters vary more erratically than at longer bubble incubation times, where the tube diameter seems to reach a stable value. This behavior is more clearly observed for 50 ppm and 100 ppm of N2H4 (see Fig. 2).
The modulation of the surface morphology of electrodeposited PPy tubular structures at the micro-nanoscale dimension starts with bubble formation processes. Thus, the electrode surface area covered by adhering bubbles, the so-called bubble coverage, can be correlated with the N2H4 discharge current density.37,38 However, the whole process is complex and it is influenced by numerous further parameters such as temperature, pressure, diffusion coefficient, supersaturation, gas evolution efficiency, bubble coalescence, and bubble break-off diameter.37,38 Nevertheless, many of these parameters are under control and remain constant for all the experiments comparatively evaluated. Consequently, not only does the bubble incubation time increase the bubble electrode surface area coverage but also it allows the bubbles to mature until they reach a similar size.38 On the other hand, the electropolymerization process also interacts with the formed bubbles. PPy is electrochemically induced to discharge around the bubble template producing bubble shrinkage through the leakage of gas, which permits that the growth in the height of PPy tubes and its own collapse affecting the diameter of its hole. Hence, when the experimental conditions induce the formation of a very dense bubble template, the PPy tube walls can touch each other. This stabilizes the tube structure allowing its growth with a fixed diameter size, as shown in Fig. 2 (see orange and green arrows that indicate the range where the tubular structures are isolated or collapsed, respectively). On the other hand, a deeper look at the SEM images of Fig. 1 reveals that as the PPy tube density increases with a time applied at 0.30 V before covering the electrode with a unique matrix, the PPy tubes collapse in an isolated cluster constituted by several hollow structures. This can be observed in Fig. 3, which shows an image magnification of the SEM pictures displayed in Fig. 1. The isolated tubes clusters are formed from 180 s, 60 s, and 30 s incubation bubble time for 25 ppm, 50 ppm and 100 ppm of N2H4, respectively. Furthermore, it is observed that the tube cluster has an external wall thicker than the interior wall, which can be related to a deficiency in the material transport. The tube clusters grow in number until they completely cover the electrode surface; as it is observed, SEM image corresponds to 180 s and 100 ppm N2H4.
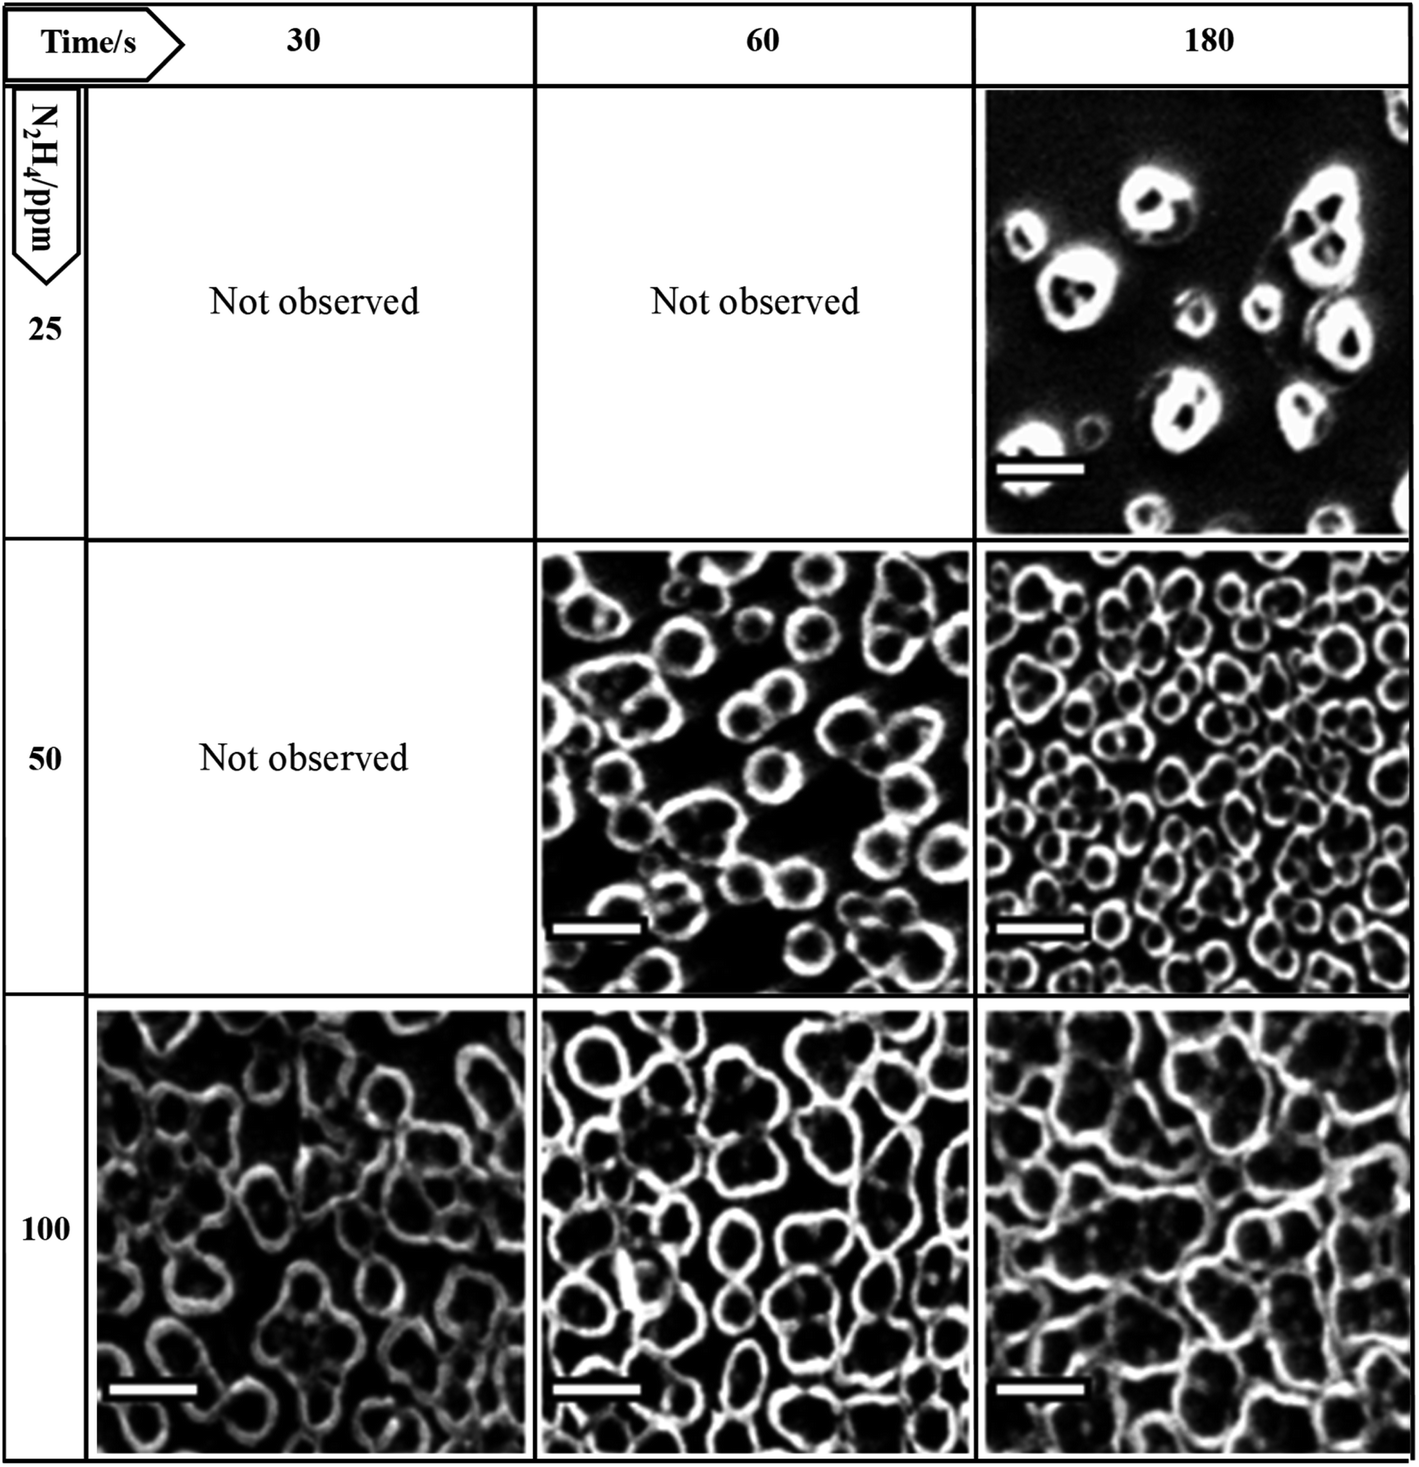 | ||
| Fig. 3 Magnification of the SEM images of the surface of the PPy film on the ITO electrode shown in Fig. 1 where cluster formation is observed. Scale bar: 1 μm. | ||
Moreover, it was observed that an N2H4 concentration higher than 200 ppm completely inhibited the PPy nanostructure formation. It is known that N2H4 is a potent chemical reducing agent with the power to reduce the pyrrole radical cation, and therefore, it is able to compete with the polymerization process. Consequently, if the N2H4 concentration is highly enough, the PPy film formation can be inhibited. Thus, it was shown that through the control of the N2H4 concentration and bubble incubation time, it is possible to electrochemically modulate the PPy film morphology from isolated hollow structures until a very densely packed tubular formation occurs.
Conclusions
In summary, based on the in situ generation of bubble as a soft template from N2H4 oxidation, we developed and tested a cheap, easy, and highly repeatable one-step electrochemical method, which allows the modulation the surface morphology of electrodeposited PPy films at the micro-nanoscale dimension. The obtained results suggest that the formation of hollow structures obtained by the pyrrole electropolymerization is a consequence of the in situ release of gas bubbles (N2) from the electrochemical oxidation of N2H4 at 0.30 V. Thus, the generated bubbles act as a template that forces the PPy deposition around the spherical bubble, and their size, shape, and density depend on the N2H4 concentration and the time applied to 0.30 V. It was also proposed that N2H4 interacts as a reduction agent in the electropolymerization process. This novel approach can be implemented by numerous other systems of template-free fabrication and it could have a high impact on a wide range of electrodeposited materials.Conflicts of interest
There are no conflicts to declare.Acknowledgements
We are grateful to Secretaría de Ciencia y Técnica de la Universidad Nacional de Río Cuarto (SECYT-UNRC) for the financial support. D. P., L. F, G. M., and F. F. are scientific members of Consejo Nacional de Investigaciones Cientificas y Técnicas (CONICET-Argentina).References
- N. K. Guimarda, N. Gomez and C. E. Schmidt, Prog. Polym. Sci., 2007, 32, 876–921 CrossRef.
- U. Lange, N. V. Roznyatovskaya and V. M. Mirsky, Anal. Chim. Acta, 2008, 614, 1–26 CrossRef CAS PubMed.
- A. Ramanavicius, A. Ramanaviciene and A. Malinauskas, Electrochim. Acta, 2006, 51, 6025–6037 CrossRef CAS.
- Z. Yin and Q. Zheng, Adv. Energy Mater., 2012, 2, 179–218 CrossRef CAS.
- L. Pan, H. Qiu, C. Dou, Y. Li, L. Pu, J. Xu and Y. Shi, Int. J. Mol. Sci., 2010, 11, 2636–2657 CrossRef CAS PubMed.
- Y. Shi, L. Peng and G. Yu, Nanoscale, 2015, 7, 12796–12806 RSC.
- P. Bujak, I. Kulszewicz-Bajer, M. Zagorska, V. Maurel, I. Wielgus and A. Pron, Chem. Soc. Rev., 2013, 42, 8895–8999 RSC.
- A. Kiriy, R. Poetzsch, Q. Wei and B. Voit, Polym. Degrad. Stab., 2017, 145, 150–156 CrossRef CAS.
- G. Li, R. Zhu and Y. Yang, Nat. Photonics, 2012, 6, 153–161 CrossRef CAS.
- S. Zhang, Y. Qin, J. Zhu and J. Hou, Adv. Mater., 2018, 30, 1800868 CrossRef PubMed.
- M.-H. Park, T.-H. Han, Y.-H. Kim, S.-H. Jeong, Y. Lee, H.-K. Seo, H. Cho and T.-W. Lee, J. Photonics Energy, 2015, 5, 1–21 Search PubMed.
- R. Schroot, M. Jäger and U. S. Schubert, Chem. Soc. Rev., 2017, 46, 2754–2798 RSC.
- J. Heinze, B. A. Frontana-Uribe and S. Ludwigs, Chem. Rev., 2010, 110, 4724–4771 CrossRef CAS PubMed.
- N. I. Kovtyukhova and T. E. Mallouk, Adv. Mater., 2005, 17, 187–192 CrossRef CAS.
- W. Wang, M. Zhou and D. Yuan, J. Mater. Chem. A, 2017, 5, 1334–1347 RSC.
- J. Liu, R. Zou and Y. Zhao, Tetrahedron Lett., 2016, 57, 4873–4881 CrossRef CAS.
- F. Zabihi, P. Graff, F. Schumacher, B. Kleuser, S. Hedtrich and R. Haag, Nanoscale, 2018, 10, 16848–16856 RSC.
- S. Mitra, H. S. Sasmal, T. Kundu, S. Kandambeth, K. Illath, D. D. Díaz and R. Banerjee, J. Am. Chem. Soc., 2017, 139, 4513–4520 CrossRef CAS PubMed.
- T. D. Huan, S. Boggs, G. Teyssedre, C. Laurent, M. Cakmak, S. Kumar and R. Ramprasad, Prog. Mater. Sci., 2016, 83, 236–269 CrossRef CAS.
- S. Orlandi, G. Pozzi, M. Cavazzini, D. Minudri, M. Gervaldo, L. Otero and F. Fungo, Macromolecules, 2015, 48, 4364–4372 CrossRef CAS.
- M. I. Mangione, R. A. Spanevello, D. Minudri, P. Cavallo, L. Otero and F. Fungo, Electrochim. Acta, 2018, 263, 585–595 CrossRef CAS.
- I. Pecnikaj, S. Orlandi, G. Pozzi, M. V. Cappellari, G. Marzari, L. Fernández, M. A. Zensich, L. Hernandez and F. Fungo, Langmuir, 2019, 35, 8732–8740 CrossRef CAS PubMed.
- L. Zhang and T. L. Andrew, Adv. Mater. Interfaces, 2017, 4, 1700873 CrossRef.
- A. Fakhry, H. Cachet and C. Debiemme-Chouvy, Electrochim. Acta, 2015, 179, 297–303 CrossRef CAS.
- Z. Yin and Q. Zheng, Adv. Energy Mater., 2012, 2, 179–218 CrossRef CAS.
- O. Sane, A. Diouf, M. Pan, G. Moran Cruz, F. Savina, R. Meallet-Renault, S. Y. Dieng, S. Amigoni, F. Guittard and T. Darmanin, Electrochim. Acta, 2019, 320, 134594 CrossRef CAS.
- L. Qu, G. Shi, F. Chen and J. Zhang, Macromolecules, 2003, 36, 1063–1067 CrossRef CAS.
- Y. Li and Y. Ouyang, Synth. Met., 2000, 113, 23–28 CrossRef CAS.
- S. Bai, Q. Hu, Q. Zeng, M. Wang and L. Wang, ACS Appl. Mater. Interfaces, 2018, 10, 11319–11327 CrossRef CAS PubMed.
- J. T. Kim, S. K. Seol, J. H. Je, Y. Hwu and G. Margaritondo, Appl. Phys. Lett., 2009, 94, 034103 CrossRef.
- C. R. Szczepanski, I. M'Jid, T. Darmanin, G. Godeau and F. Guittard, J. Mater. Chem. A, 2016, 4, 17308–17323 RSC.
- T. Darmanin, J.-P. Laugier, F. Orange and F. Guittard, J. Colloid Interface Sci., 2016, 466, 413–424 CrossRef CAS PubMed.
- A. J. Bard, Anal. Chem., 1963, 35, 1602–1607 CrossRef CAS.
- M. Michlmayr and D. T. Sawyer, J. Electroanal. Chem., 1969, 23, 375–385 CrossRef CAS.
- M. Petek and S. Bruckenstein, J. Electroanal. Chem. Interfacial Electrochem., 1973, 47, 329–333 CrossRef CAS.
- C. M. Cardona, W. Li, A. E. Kaifer, D. Stockdale and G. C. Bazan, Adv. Mater., 2011, 23, 2367–2371 CrossRef CAS PubMed.
- B. J. Plowman, L. A. Jones and S. K. Bhargava, Chem. Commun., 2015, 51, 4331–4346 RSC.
- H. Vogt and R. J. Balzer, Electrochim. Acta, 2005, 50, 2073–2079 CrossRef CAS.
- M. I. Mangione, R. A. Spanevello, D. Minudri, D. Heredia, L. Fernandez, L. Otero and F. Fungo, Electrochim. Acta, 2016, 207, 143–151 CrossRef CAS.
- C.-Y. Lau, J. Xu and K.-K. Shiu, Electrochim. Acta, 2012, 72, 143–149 CrossRef CAS.
| This journal is © The Royal Society of Chemistry 2021 |