 Open Access Article
Creative Commons Attribution 3.0 Unported Licence
Iron oxide coated hollow poly(methylmethacrylate) as an efficient adsorption media for removal of arsenic from water
Dhiraj Dutta,
J. P. Borah and
Amrit Puzari
 *
*
National Institute of Technology Nagaland, Chumukedima, Dimapur, 797 103, Nagaland, India. E-mail: amrit09us@yahoo.com
First published on 12th April 2021
Abstract
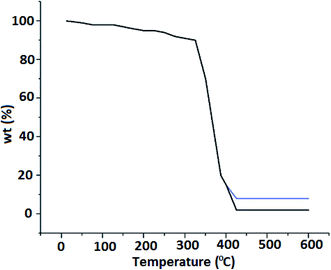
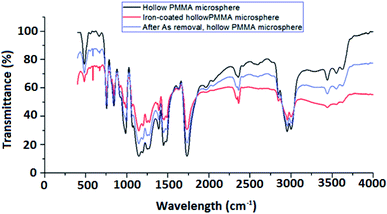
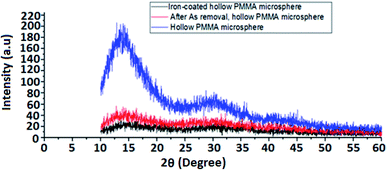
Adsorption of arsenic onto iron-based adsorption media has been established as a convenient method for the removal of arsenic from contaminated water. The study describes the efficiency of iron oxide coated hollow poly(methyl methacrylate) microspheres (FHM) as an adsorptive media for the removal of arsenic from water. Hollow poly(methyl methacrylate) microspheres (HPMM) were synthesized by solvent evaporation and an electroless plating technique and the surface of the polymer was coated with iron oxide (FeO) particles. Structural characterization was performed using Optical Microscopy (OM), Scanning Electron Microscopy (SEM), Fourier Transform Infrared spectroscopy (FTIR), Energy Dispersive X-ray diffraction (EDAX), and Thermogravimetric Analysis (TGA). A study on the effect of the varying initial concentration of arsenic ions on percentage removal was performed in the laboratory and the adsorption capacity of the adsorbent was measured. Adsorption isotherm studies were carried out to evaluate the adsorption efficiency of FHM in removing arsenic from contaminated water. The Langmuir and Freundlich isotherm models were used to analyze the equilibrium experimental data. The isotherm study revealed that Langmuir adsorption data are well fitted and the maximum adsorption capacity of FHM in removing arsenic is 10.031 mg g−1. This high arsenic uptake capability combined with a low density of FHM makes it a potential material for arsenic removal particularly during the fabrication of lightweight portable water purification devices.
1 Introduction
Iron-based sorbents, which are also innocuous, inexpensive, chemically stable, and readily accessible, possess strong arsenic removal efficiency from drinking water.2–7 Thus iron(II) oxide has a better sorption affinity towards As(V) or arsenates and As(III) or arsenite, which are also electron-pair donors. Even iron oxide adsorbent systems possess a strong affinity for arsenic under neutral pH (pH ∼ 7) conditions. As(V) and As(III) species form a coordinate bond becoming adsorbed on the surface of iron oxide.2,8,9 Since As(V) or As(III) species possess ligand characteristics10 (electron-donating ability) and iron oxide has a larger surface area per unit mass and hence more sorption sites, selective separation of As(V) and As(III) oxyanions or oxyacids from drinking water sources is highly facilitated.However, despite the high sorption affinity of these submicron iron oxide particles, the stability of these particles and their aggregates in fixed beds is relatively low because of excessive pressure drops and poor mechanical strength.7 Therefore, embedding these particles into macroporous polymeric materials or any other host materials having the ability to bind effectively the metal oxide particles helps to overcome such drawbacks. Such examples of host materials are already available in literature which includes alginate11,12 zeolite,13,14 metal–organic framework,15,16 activated carbon,2,6,17 chitosan,18–20 etc. In yet another example hydrated iron(III) oxide nanoparticles were dispersed within a macroporous polymeric cation exchanger to develop a hybrid material for arsenic removal.7,21 Other techniques used for the removal of arsenic(III) ions from water is coagulation,22–24 adsorption,19,25,26 and reverse osmosis.27–29 Except for adsorption which is an effective and economical method, other methods have high operational cost and less efficient for arsenic removal.30,31 Several studies on the adsorption of arsenic(III) have been carried out using various adsorbents, such as fly ashes,32–34 natural and synthetic clay materials,35,36 ion-exchange resins,21,37,38 carbon nanotubes39,40 and metal oxides.1,41,42 Additionally, polymeric adsorbents in the form of hollow microspheres possess advantages such as low density, high surface area with a size range of about 1 to 1000 μm, and can readily be synthesized using various polymerization techniques.28,43 Their performance can also be optimized for targeted applications by coating the surface29 with specific materials. Therefore, these adsorbents are used for the removal of a wide variety of contaminants from drinking water.30–34 Arsenite, As(III), and arsenate, As(V) are the predominant oxidation states of arsenic found in water, under reduced and oxygenated conditions respectively,25,44 and are potentially harmful to health. Trace amounts of methylated arsenic species are typically found in drinking water, and higher levels are found in biological systems.45 The concentration of arsenic in open ocean seawater and groundwater is 1–2 μg L−1, although groundwater concentrations can be up to 3 mg L−1 in areas with volcanic rock and sulfide mineral deposits.46 A high level of arsenic contamination in drinking water47 has been reported in several parts of the world which include the countries like Bangladesh, China, West Bengal, Australia, etc.44 In most of these regions, the drinking-water source is groundwater, naturally contaminated with arsenic-rich geological formations. Long-term exposure to arsenic from drinking-water and food can cause melanosis, edema, keratosis, dark spots on the chest, enlargement of liver, kidney, and spleen, cancers of the skin, lungs, and urinary bladder, etc.48–52 As per WHO recommendations, arsenic contamination should be less than 0.05 mg L−1 in drinking water while the same recommended by BIS is less than 0.01–0.05 mg L−1.53 Hence arsenic removal from drinking water sources has become a major concern nowadays for individuals at the household level and water distribution companies as well.
The present study thus emphasizes the supremacy of iron oxide coated hollow (polymethylmethacrylate) microspheres as adsorptive media for removal of arsenic from drinking water. The effects of the operational parameters, such as initial adsorbate concentration, contact time, and pH have also been investigated.
2 Materials and methods
2.1 Materials
Polymethylmethacrylate (PMMA) was purchased from Sigma-Aldrich with an average molecular weight of about 120![[thin space (1/6-em)]](https://www.rsc.org/images/entities/char_2009.gif) 000 Da, and 98% viscosity 0.20 dL g−1 (lit.), dichloromethane 99.5% was procured from Merck with [M = 84.93 g mol−1], poly vinyl alcohol was obtained from Central Drug House, Delhi, MW (Avr.) 125
000 Da, and 98% viscosity 0.20 dL g−1 (lit.), dichloromethane 99.5% was procured from Merck with [M = 84.93 g mol−1], poly vinyl alcohol was obtained from Central Drug House, Delhi, MW (Avr.) 125![[thin space (1/6-em)]](https://www.rsc.org/images/entities/char_2009.gif) 000 Da and 99.25% viscosity 35–50 cP at 4% cold aqueous solution. Stock solutions of 1000 μg ml−1 iron were prepared from FeSO4·7H2O [Merck, 99%, M = 278.02 g mol−1] using double distilled water. All other reagents used were of analytical grade and were obtained from Merck, India. Limestone was obtained from a mining site, Meghalaya, India.
000 Da and 99.25% viscosity 35–50 cP at 4% cold aqueous solution. Stock solutions of 1000 μg ml−1 iron were prepared from FeSO4·7H2O [Merck, 99%, M = 278.02 g mol−1] using double distilled water. All other reagents used were of analytical grade and were obtained from Merck, India. Limestone was obtained from a mining site, Meghalaya, India.
2.2 Preparation of PMMA microsphere
Hollow PMMA microspheres were synthesized by solvent evaporation technique.54 A solution was prepared by dissolving PMMA (5–6% w/v) in dichloromethane with occasional stirring. The resultant solution was then added dropwise to a stirring aqueous medium. The aqueous medium comprises (0.5%, w/v) of poly(vinyl alcohol) which acts as a stabilizer. The stirring was maintained at 550 rpm with a propeller-type mechanical stirrer. Hollow PMMA microspheres (HPMM) were formed by slow evaporation of dichloromethane at room temperature. The material so obtained was washed with water and dried at 70 °C. The bulk density of the HPMMwas calculated to be 0.69 gm cm−3.2.3 Preparation of iron oxide coated HPMM (FHM)
An electroless coating process, a literature procedure used for polyaniline coating on HPMM surface, was used for iron oxide coating on PMMA. Hollow PMMA (2% w/v) microspheres obtained above were mixed for 10 min in a 200 mg L−1 iron solution. The pH of the solution was maintained at 10 with the help of a 0.5 N NaOH solution. The iron oxide-coated PMMA microspheres (FHM) were then filtered and washed several times with distilled water until the runoff was clear. Then the mixture was dried at 65 °C and stored in capped bottles. The bulk density of the FHM was calculated as 1.27 gm cm−3.2.4 Characterization of materials
The synthesized materials were characterized by using a scanning electron microscope having energy dispersive X-ray analysis attachment (Carl ZEISS, EVO50), FTIR (Bruker model Alpha-T), Optical microscope with Leica DMLM/P, Leica Microsystems AG Switzerland at 50× magnification, and Thermogravimetric analysis (TGA) (TA Instrument USA, Model 2950 and 2910). The specific surface area and porosity were estimated through the Brunauer–Emmet–Teller (BET) method using the 3 Flex instrument (Micromeritics). FT-IR of the samples was taken with the help FT-IR spectrophotometer (Bruker Alpha-model with KBr). The UV-Visible spectrophotometer is a double beam spectrophotometer from ANALYTICA JENA MODEL SPECORD 205. The testing for iron content in water was carried out by using standard method IS: 3025 (part 53).533 Results and discussion
3.1 Characterization of HPMM and FHM
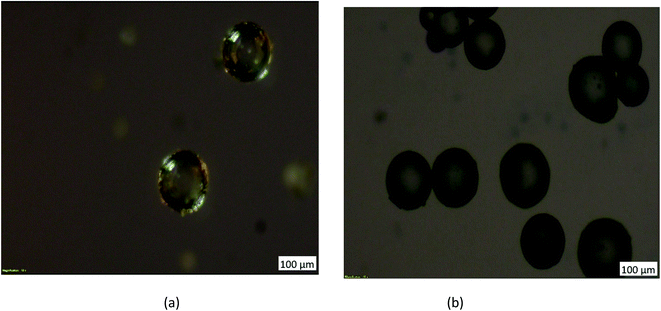
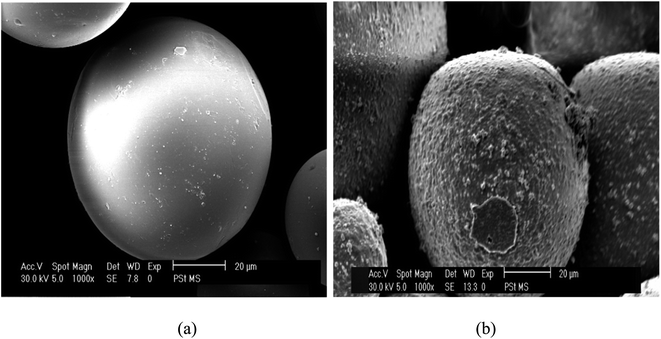
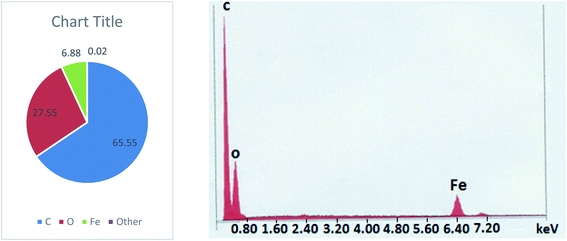
Coating of iron oxide onto the surface of HPMM was further revealed from the images recorded during the morphological study with a scanning electron microscope (SEM) having energy dispersive X-ray analysis attachment (Carl ZEISS, EVO50). The images as shown in Fig. 2 display the difference in surface topography of HPMM and FHM producing conclusive evidence in support of iron oxide coating on to the surface of HPMM. The diameter of HPMM was found in the range of 20–80 μm from the SEM micrographs. The micrographs of HPMM show clearly the smooth surface of microspheres, whereas the surface of FHM shows the presence of precipitate of FeO as is evident from the appearance of a rough surface on the microsphere. The Brunauer–Emmet–Teller (BET) approach was used to measure the real surface area and porosity using the 3 Flex instrument (Micromeritics). BET is a surface characterization approach based on the physical absorption of gas molecules in a monolayer shape on a solid surface under pressure. The specific surface area (S) and porosity (ε) of the particles can be measured using data from the system's relative pressure and the density of the gas molecules being absorbed. The was observed that the real surface area (S) is 8.6 m2 g−1, and the porosity (ε) is 18.5 percent which decreases to real surface area (S) is 3.8 m2 g−1, and the porosity (ε) is 5.8 percent after the arsenic removal process.
3.2 Optimization of adsorption parameters
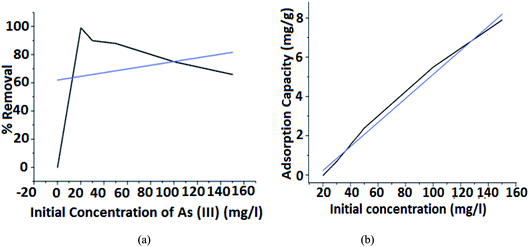
The adsorption kinetics reflects the characterization of the arsenic removal process as a function of time and concentration. Optimization of different adsorption parameters such as contact time of the adsorption process, As(III) concentration, and pH was effectively carried out as it plays a significant role in determining the type and the number of adsorbents that one should use for the process to take place efficiently.In Fig. 7(a), it is observed that a high percentage of 99.1% is achieved for an initial concentration of 20 mg L−1 and the percentage of removal decreased with the increase of the initial As(III) concentration. This is because the number of available active sites for adsorption in FHM is less compared to the available metal ion in the medium. These variations are small at low concentrations because of the smaller ratio of the initial number of metal ions to the available adsorption active sites. However, it becomes more significant with the increase in the initial concentration.
From Fig. 7(b), it is observed that for 10 mg L−1 of arsenic concentration, the absorption capacity is 1.9833 mg g−1 whereas for 30 mg L−1 of arsenic concentration the capacity increases to 2.701233 mg g−1 indicating that the equilibrium adsorption capacity for As(III) ion increases with an increase in the concentration of As(III) ions. Therefore, it is assumed that at low initial concentrations, the monolayer is formed at the outer surface of the adsorbent and controls the adsorption rate. Thus, the adsorption process is very intense and fast, as most adsorbent active sites remain unsaturated.
3.3 Adsorption isotherms
Adsorption studies allow us to investigate the distribution of adsorbate and adsorbent in the solution at equilibrium conditions in the form of adsorption isotherms. These isotherm plots establish the relationship between the amounts of adsorbed and non-adsorbed quantities during series of adsorption at a given temperature and pressure. From these plots, we can also obtain the nature of the adsorption process. The distribution of metal ions between the liquid phase and the solid phase can be described by several isotherm models such as Langmuir and Freundlich. These models are used to determine the efficiency of synthesized FM in removing As(III) ions from contaminated water.The Langmuir adsorption isotherm is used to describe the equilibrium between the adsorbate and the adsorbent system, where the adsorption partial pressure approaches saturation.56 This means that this isotherm is suggested when the adsorbate occupies a site where further adsorption cannot take place. All sites are energetically equivalent and there is no interaction between molecules adsorbed on neighboring sites.57
The Langmuir equation is written in a linear form as follows:
| qe/Ce = KLqm − KLqe | (1) |
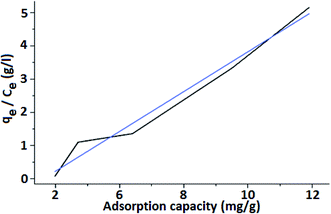
Fig. 8 shows the Langmuir isotherm model using FHM to remove arsenic from water. The obtained linear plot indicates the monolayer coverage of the material. The adsorption capacity (qe) is the amount of adsorbate (arsenic) that a particular adsorbent (iron coated PMMA) is capable of removing. It is characterized by the relation:
| qe = X/M | (2) |
Maximum adsorption capacity (qm) is the capacity to retain the maximum amount of an adsorbate (arsenic) per unit mass of the adsorbent (FHM). In general, the adsorbent achieves qm at a lower concentration, and rarely it is obtained at higher concentrations. The adsorption enthalpy is correlated with Langmuir isotherm constant (KL in L mg−1). The isotherm constant KL is the affinity of FHM towards the adsorbate (arsenic in this case). From eqn (1), the slope is obtained as KL and the intercept is qm. The correlation coefficient R2 value is used to indicate whether the adsorption is favorable or whether a better correlation of parameters is required. From the results of the experiment carried out with FM, it was observed that the maximum adsorption capacity (qm) for FHM was achieved at around 10.031 mg g−1. The obtained value of the Langmuir constant (KL) is 1.478 L mg−1 and the value of R2 is calculated as 1. Experimentally obtained adsorption data of the Langmuir isotherm & Freundlich isotherm parameters are listed in Table 1.
| Langmuir isotherm | Freundlich isotherm | |||||
|---|---|---|---|---|---|---|
| qm (mg g−1) | KL (L mg−1) | R2 | 1/n | n | KF (L mg−1) | R2 |
| 10.031 | 1.478 | 1 | 0.280 | 3.559 | 3.280 | 0.902 |
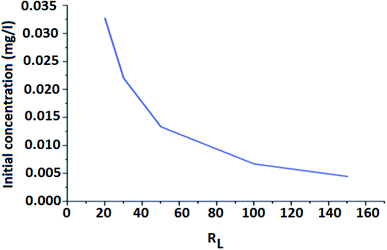
Langmuir model is an empirical model having a linear plot, which indicates that the active sites on the surface are filled linearly and the monolayer of FHM is fitted into the heterogeneous surface. The RL is a separation factor and its value is used to evaluate the characteristic of the Langmuir isotherm. The RL value is inversely proportional to qe and it decreases with the increase in the adsorption capacity (qe). Thereby, the isotherm process is favored.
| q = 1/[1 + (RL + Co)] | (3) |
From Fig. 9, it is revealed that the value of RL is dependent on the initial concentration of the adsorbents. It is seen that separation factor RL decreases with increasing concentration from 0.032 at 20 mg L−1 to 0.022 at 30 mg L−1. As the value of RL is less than 1, it indicates that adsorption is favorable.58
log![[thin space (1/6-em)]](https://www.rsc.org/images/entities/char_2009.gif) qe = log qe = log![[thin space (1/6-em)]](https://www.rsc.org/images/entities/char_2009.gif) KF + (1/n)log KF + (1/n)log![[thin space (1/6-em)]](https://www.rsc.org/images/entities/char_2009.gif) Ce Ce
| (4) |
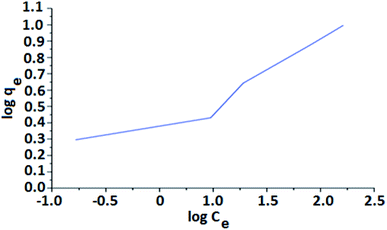
The adsorption capacity (KF) and the adsorption intensity (1/n) are directly obtained from the slope and the intercept of the linear plot of log![[thin space (1/6-em)]](https://www.rsc.org/images/entities/char_2009.gif) qe versus log
qe versus log![[thin space (1/6-em)]](https://www.rsc.org/images/entities/char_2009.gif) Ce. The higher fractional values of 1/n signify that strong adsorption forces are operative on the system. The magnitude of 1/n also indicates the favorability and capacity of the adsorbent/adsorbate system. The value 1/n, between 0 and 1, represents favorable adsorption.
Ce. The higher fractional values of 1/n signify that strong adsorption forces are operative on the system. The magnitude of 1/n also indicates the favorability and capacity of the adsorbent/adsorbate system. The value 1/n, between 0 and 1, represents favorable adsorption.
Fig. 10 shows Freundlich isotherm as a plot of log![[thin space (1/6-em)]](https://www.rsc.org/images/entities/char_2009.gif) qe against log
qe against log![[thin space (1/6-em)]](https://www.rsc.org/images/entities/char_2009.gif) Ce. The plot displays a deviated line with a slope of 1/n and intercept of log
Ce. The plot displays a deviated line with a slope of 1/n and intercept of log![[thin space (1/6-em)]](https://www.rsc.org/images/entities/char_2009.gif) qm. The 1/n is the Freundlich constant related to sorbent intensity, whereas qm is the Freundlich constant associated with adsorption capacity.
qm. The 1/n is the Freundlich constant related to sorbent intensity, whereas qm is the Freundlich constant associated with adsorption capacity.
The adsorption of As(III) metal ions on FHM is described by Langmuir and Freundlich isotherms. Based on the R2 values, we can mention that Langmuir isotherm provided a better fit compared to Freundlich isotherm. This fact otherwise suggests that maximum adsorption of As(III) metal ions occurred via monolayer of the adsorbate.
The magnitude of the Freundlich adsorption capacity ‘n’ indicates favourability of adsorption. The values of ‘n’ ranges from 2–10 indicating good adsorption capacity, 1–2 moderate adsorption capacity, and less than one indicates poor adsorption capacity. 1/n is a function of the strength of the absorbent material. The smaller value of 1/n (<1) implies stronger interaction and the greater value of 1/n (>1) implies weaker interaction between adsorbate and adsorbent.60 Also, the absorption coefficient increases with an increase in the concentration of the solution and that eventually led to an increase in hydrophobic surface characteristics after monolayer. While 1/n equals 1 indicates linear adsorption sites leading to identical adsorption energies for all sites. The n value obtained from the curve (which is the measurement of the favorability (0 < n < 10) of adsorption) is 3.55. In general, the value of n is greater than 1 due to the distribution of surface sites, leading to the decrease in the adsorbent–adsorbate ratio in the case of higher surface density. As a result, the adsorption process is favorable when n > 1. The value of KF denotes the affinity of the adsorbent towards the adsorbate molecules. The KF value, in this case, is 3.280789 L mg−1. The high value of KF indicates more binding of adsorbate molecules on the surfaces of the adsorbent. The coefficient of correlation (R2) denotes the favorability and the fitting of the Freundlich data onto the modeling analysis. In the case of FHM, the R2 was observed to be 0.9027 which is near to the Langmuir correlation factor (R2 = 1).
Freundlich isotherm is an empirical construct. So the logarithm data fits the equations and the obtained value of R2 validates that the modeling is better in the case of the Langmuir isotherm model and the dataset fits well into it. The reason for this is the high separation factor value obtained through the Langmuir isotherm model.
Table 2 presents the comparison data for arsenic removal, carried out by different researchers.
| S.No | Adsorbents | Adsorption capacity (mg g−1) | References | |
|---|---|---|---|---|
| As(III) | As(V) | |||
| 1 | Iron oxide coated hollow PMMA | 8.12 | 10.03 | Present study |
| 2 | Granular ferric hydroxide (GFH) | — | 1.1 | 61 |
| 3 | Ultrafine δ-FeOOH | — | 37.3 | 62 |
| 4 | Magnetite–maghemite nanoparticles | 3.69 | 3.71 | 63 |
| 5 | α-Fe2O3 | — | 0.2 | 64 |
| 6 | Fe3O4 nanoparticles | 16.56 | 46.06 | 65 |
| 7 | g-Fe2O3 nanoparticles | — | 2.9 | 66 |
| 8 | Fe3O4-γ-Fe2O3 nanoparticles | 3.69 | 3.71 | 67 |
| 9 | Bituminous based Filtrasirb 400 | — | 2.45 | 68 |
| 10 | Modified activated carbons with iron hydro(oxide) nanoparticles | 0.035 | (Initial total As conc. is 0.31 mg L−1) | 69 |
| 11 | Lignite-based AC | — | 0.26 (initial As conc. is 0.12 mg L−1) | 70 |
| 12 | Ferric oxyhydroxides anchored onto activated carbon | 26.8 | — | 71 |
| 13 | Straw activated carbon | 51.3 | 33.8 | 72 |
| 14 | Iron-impregnated granular activated carbon | — | 1.95 (initial As conc. is 0.12 mg L−1) | 73 |
| 15 | Sawdust-based AC | — | 204 | 74 |
| 16 | Fe3O4 coated wheat straw | 3.9 | 8.1 | 75 |
| 17 | ZVI nanoparticles modified starch | 12.2 | 14 | 76 |
| 18 | Iron loaded orange peel | 68.2 | 68.6 | 69 |
| 19 | Coconut shell with 3% ash | — | 2.4 | 77 |
| 20 | Ce–Ti oxide adsorbent | 6.8 | 7.5 | 78 |
| 21 | Char carbon | 89 | 34.46 | 79 |
| 22 | Activated bauxsol (red mud) | 0.541 | 7.642 | 80 |
| 23 | Empty fruit bunch biochar | 18.9 | 5.5 | 81 |
| 24 | Leonardite char | 4.46 | 8.4 | 82 |
| 25 | Magnetic Fe3O4 nanoparticles (tea waste) | 189 | 154 | 83 |
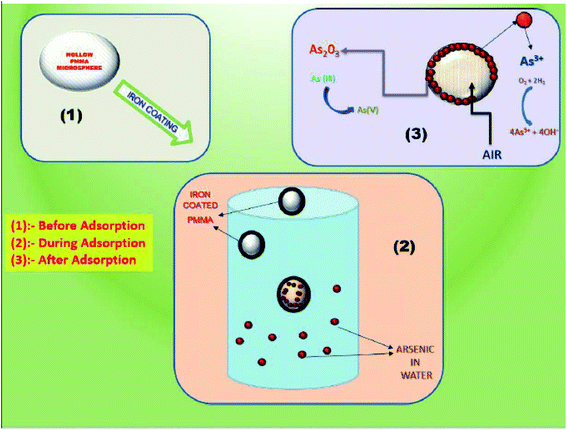
The process of removal of arsenic from the water is shown in Fig. 11. When the iron-coated HPMM are brought in contact with the arsenic-contaminated water solution, the arsenic intends to deposit on the surface of FHM. In this case, the FeO layer on the polymeric surface acts as a catalyst surface and facilitates the oxidation of arsenic ions present in the aqueous medium. Therefore, arsenic adsorbed on the surface of FHM being converted to arsenic trioxide form, which is further separated from the solution. Thus, the arsenic is removed from the drinking water by an iron coating layer on FHM.
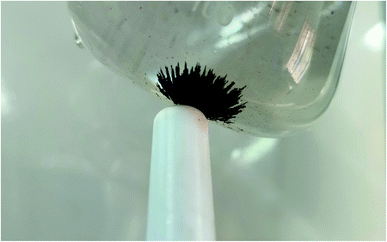
A regeneration study on the efficiency of adsorbent is carried out too. A mild acidic solution (pH < 5) is used to wash the adsorbent after the study. The absorbance study has retreated on the same adsorbent. The recovery rate is calculated as 98.2% after 10 continuous studies. The adsorption of arsenate and arsenite increases as pH becomes more alkaline, because the positive charges on the iron cations attract the negative charges of the arsenic anions, creating ionic bonds. The lowering pH retracts the phenomenon causing recovery of the adsorbent. The adsorbent can be recovered easily by using any magnetic retriever as shown in the Fig. 12.
4 Conclusion
We have successfully demonstrated the synthesis of iron oxide-coated hollow polymethylmethacrylate microspheres, which are highly efficacious in removing arsenic(III) from drinking water. The material (FHM) also possesses other advantages such as low density, high surface area, and economic viability. The arsenic removal efficiency is influenced by an operational parameter such as the concentration of arsenic ions in the solution. The removal efficiency of ‘As’ is high at low concentrations and decreases as the concentration of ions increases in the solution. Adsorption studies performed by using Langmuir and Freundlich adsorption isotherm models showed that the Langmuir isotherm model is well fitted into the adsorption data of arsenic ions. Overall from the ease of synthesis and economic aspect, we can conclude that the FHM can be projected as a viable material for the removal of arsenic from drinking water, which otherwise provides a solution to a major environmental and health concern.Ethics approval and consent to participate
Ethics approval has taken whenever necessary and consent to participate all participants are also obtained.Consent for publication
Consent for publication is taken from the competent authority and all authors.Availability of data and material
All data is made available in manuscript.Conflicts of interest
There are no conflicts to declare.Funding
No funding has been received from any source for this manuscript.Author contributions
DD performed the material synthesis and wrote the manuscript, JPB facilitated the infrastructure and provided the necessary guidance for the article, AP performed final editing of the article and overall guidance.Acknowledgements
The authors would like to acknowledge the kind help of the Director DRL Tezpur and Director & testing team of DMSRDE, Kanpur along with director & faculty members NIT Nagaland for guidance in research work.References
- I. Polowczyk, P. Cyganowski, J. Ulatowska, W. Sawiński and A. Bastrzyk, Water, Air, Soil Pollut., 2018, 229, 1–10 CrossRef CAS PubMed.
- S. Joshi, M. Sharma, A. Kumari, S. Shrestha and B. Shrestha, Appl. Sci., 2019, 9, 3732–3713 CrossRef CAS.
- T. V. Nguyen, S. Vigneswaran, H. H. Ngo, D. Pokhrel and T. Viraraghavan, Water Qual. Res. J. Can., 2006, 41, 164–170 CrossRef CAS.
- B. Petrusevski, S. K. Sharma, F. Kruis, P. Omeruglu and J. C. Schippers, Water Sci. Technol.: Water Supply, 2002, 2, 127–133 CAS.
- R. Chalasani and S. Vasudevan, J. Mater. Chem., 2012, 22, 14925–14931 RSC.
- S. Yao, Z. Liu and Z. Shi, J. Environ. Health Sci. Eng., 2014, 12, 6–13 CrossRef PubMed.
- L. Cumbal and A. K. Sengupta, Environ. Sci. Technol., 2005, 39, 6508–6515 CrossRef CAS PubMed.
- K. Vaaramaa and J. Lehto, Desalination, 2003, 155, 157–170 CrossRef CAS.
- B. A. Manning, S. E. Fendorf and S. Goldberg, Environ. Sci. Technol., 1998, 32, 2383–2388 CrossRef CAS.
- L. N. Pincus, H. E. Rudel, P. V. Petrović, S. Gupta, P. Westerhoff, C. L. Muhich and J. B. Zimmerman, Environ. Sci. Technol., 2020, 54, 9769–9790 CrossRef CAS PubMed.
- J. H. Min and J. G. Hering, Water Res., 1998, 32, 1544–1552 CrossRef CAS.
- A. I. Zouboulis and I. A. Katsoyiannis, Ind. Eng. Chem. Res., 2002, 41, 6149–6155 CrossRef CAS.
- M. Bilici Baskan and A. Pala, Desalination, 2011, 281, 396–403 CrossRef CAS.
- C. R. Melo, H. G. Riella, N. C. Kuhnen, E. Angioletto, A. R. Melo, A. M. Bernardin, M. R. Da Rocha and L. Da Silva, Mater. Sci. Eng., B, 2012, 177, 345–349 CrossRef CAS.
- T. Davydiuk, X. Chen, L. Huang, Q. Shuai and X. C. Le, J. Environ. Sci., 2020, 97, 162–168 CrossRef PubMed.
- P. K. Samantaray, S. Baloda, G. Madras and S. Bose, J. Mater. Chem. A, 2018, 6, 16664–16679 RSC.
- M. A. Hashim, A. Kundu, S. Mukherjee, Y. S. Ng, S. Mukhopadhyay, G. Redzwan and B. Sen Gupta, J. Water Process. Eng., 2019, 30, 100591 CrossRef.
- K. C. M. Kwok, L. F. Koong, G. Chen and G. McKay, J. Colloid Interface Sci., 2014, 416, 1–10 CrossRef CAS PubMed.
- R. M. Dhoble, S. Lunge, A. G. Bhole and S. Rayalu, Water Res., 2011, 45, 4769–4781 CrossRef CAS PubMed.
- J. Qi, G. Zhang and H. Li, Bioresour. Technol., 2015, 193, 243–249 CrossRef CAS PubMed.
- M. J. DeMarco, A. K. SenGupta and J. E. Greenleaf, Water Res., 2003, 37, 164–176 CrossRef CAS.
- B. Bina, A. Ebrahimi, F. Hesami and M. Amin, Int. J. Environ. Health Eng., 2013, 2, 17 CrossRef.
- D. Mohan and C. U. Pittman, J. Hazard. Mater., 2007, 142, 1–53 CrossRef CAS PubMed.
- S. R. Wickramasinghe, B. Han, J. Zimbron, Z. Shen and M. N. Karim, Desalination, 2004, 169, 231–244 CrossRef CAS.
- L. Hao, M. Liu, N. Wang and G. Li, RSC Adv., 2018, 8, 39545–39560 RSC.
- J. G. Hering, I. A. Katsoyiannis, G. A. Theoduloz, M. Berg and S. J. Hug, J. Environ. Eng., 2017, 143, 03117002 CrossRef.
- R. Y. Ning, Desalination, 2002, 143, 237–241 CrossRef CAS.
- A. Abejón, A. Garea and A. Irabien, Sep. Purif. Technol., 2015, 144, 46–53 CrossRef.
- C. M. George, A. H. Smith, D. A. Kalman and C. M. Steinmaus, Arch. Environ. Occup. Health, 2006, 61, 171–175 CrossRef CAS PubMed.
- V. K. Sharma and M. Sohn, Environ. Int., 2009, 35, 743–759 CrossRef CAS.
- J. B. Kempic, in Arsenic, Springer Netherlands, 1997, pp. 393–405 Search PubMed.
- K. S. Hui, C. Y. H. Chao and S. C. Kot, J. Hazard. Mater., 2005, 127, 89–101 CrossRef CAS PubMed.
- F. O. Ochedi, Y. Liu and A. Hussain, J. Cleaner Prod., 2020, 267, 122143–122158 CrossRef CAS.
- E. Diamadopoulos, S. Ioannidis and G. P. Sakellaropoulos, Water Res., 1993, 27, 1773–1777 CrossRef CAS.
- B. A. Manning and S. Goldberg, Environ. Sci. Technol., 1997, 31, 2005–2011 CrossRef CAS.
- R. Foroutan, R. Mohammadi, A. S. Adeleye, S. Farjadfard, Z. Esvandi, H. Arfaeinia, G. A. Sorial, B. Ramavandi and S. Sahebi, Environ. Sci. Pollut. Res., 2019, 26, 29748–29762 CrossRef CAS PubMed.
- M. A. Barakat and S. Ismat-Shah, Arabian J. Chem., 2013, 6, 307–311 CrossRef CAS.
- J. Kim and M. M. Benjamin, Water Res., 2004, 38, 2053–2062 CrossRef CAS PubMed.
- D. Liu, S. Deng, A. Maimaiti, B. Wang, J. Huang, Y. Wang and G. Yu, J. Colloid Interface Sci., 2018, 511, 277–284 CrossRef CAS PubMed.
- W. K. Park, Y. Yoon, S. Kim, S. Yoo, Y. Do, J. W. Kang, D. H. Yoon and W. S. Yang, J. Environ. Chem. Eng., 2016, 4, 3246–3252 CrossRef CAS.
- S. Purohit, M. K. Chini, T. Chakraborty, K. L. Yadav and S. Satapathi, SN Appl. Sci., 2020, 2, 1–10 Search PubMed.
- J. S. Yamani, S. M. Miller, M. L. Spaulding and J. B. Zimmerman, Water Res., 2012, 46, 4427–4434 CrossRef CAS PubMed.
- R. A. Ramli, RSC Adv., 2017, 7, 52632–52640 RSC.
- B. K. Mandal and K. T. Suzuki, Talanta, 2002, 58, 201–235 CrossRef CAS PubMed.
- W. R. Cullen, M. Fricke, Q. Liu, X. Lu, H. Peng, X. Yan, Q. Zhang, H. Sun, X. C. Le, A. McKnight-Whitford, A. Popowich and X. C. Le, J. Environ. Sci., 2016, 49, 7–27 CrossRef CAS PubMed.
- B. Casentini, M. Pettine and F. J. Millero, Aquat. Geochem., 2010, 16, 373–393 CrossRef CAS.
- Arsenic in Drinking-Water Background Document for Development of WHO Guidelines for Drinking-water Quality, World Health Organization, 2011, p. 24 Search PubMed.
- V. Kumar, P. K. Bharti, M. Talwar, A. K. Tyagi and P. Kumar, Water Sci., 2017, 31, 44–51 CrossRef.
- M. F. Hughes, Toxicol. Lett., 2002, 133, 1–16 CrossRef CAS.
- M. I. Luster and P. P. Simeonova, Toxicol. Appl. Pharmacol., 2004, 198, 419–423 CrossRef CAS PubMed.
- C. Hopenhayn-Rich, M. Lou Biggs and A. H. Smith, Int. J. Epidemiol., 1998, 27, 561–569 CrossRef CAS PubMed.
- A. H. Smith, G. Marshall, Y. Yuan, C. Ferreccio, J. Liaw, O. von Ehrenstein, C. Steinmaus, M. N. Bates and S. Selvin, Environ. Health Perspect., 2006, 114, 1293–1296 CrossRef CAS.
- Bureau of Indian Standard, Indian Standards Drinking Water Specifications IS 10500:2012, 2012, vol. 2 Search PubMed.
- R. Dubey, D. S. Bag, V. K. Varadan, D. Lal and G. N. Mathur, React. Funct. Polym., 2006, 66, 441–445 CrossRef CAS.
- T. Chen, Y. Zhao, L. Zhao, J. Du and C. Xie, IOP Conf. Ser. Earth Environ. Sci., 2018, 108, 42097 CrossRef.
- Y. Tan, M. Chen and Y. Hao, Chem. Eng. J., 2012, 191, 104–111 CrossRef CAS.
- S. Zhang, H. Niu, Y. Cai, X. Zhao and Y. Shi, Chem. Eng. J., 2010, 158, 599–607 CrossRef CAS.
- K. Y. Foo and B. H. Hameed, Chem. Eng. J., 2010, 156, 2–10 CrossRef CAS.
- H. M. F. Freundlich, J. Phys. Chem., 1906, 57, 385–471 CAS.
- S. Nethaji, A. Sivasamy and A. B. Mandal, Int. J. Sci. Environ. Technol., 2013, 10, 231–242 CrossRef CAS.
- M. C. Collivignarelli, A. Abbà, M. Carnevale Miino and S. Damiani, J. Environ. Manage., 2019, 236, 727–745 CrossRef CAS.
- R. C. Hott, T. G. Andrade, M. S. Santos, A. C. F. Lima, M. C. S. Faria, C. A. Bomfeti, F. Barbosa, L. F. O. Maia, L. C. A. Oliveira, M. C. Pereira and J. L. Rodrigues, Environ. Sci. Pollut. Res., 2016, 23, 21969–21979 CrossRef CAS PubMed.
- S. R. Chowdhury and E. K. Yanful, J. Environ. Manage., 2010, 91, 2238–2247 CrossRef CAS PubMed.
- W. Tang, Q. Li, S. Gao and J. K. Shang, J. Hazard. Mater., 2011, 192, 131–138 CAS.
- F. Beduk, Environ. Technol., 2016, 37, 1790–1801 CrossRef CAS PubMed.
- H. Park, N. V. Myung, H. Jung and H. Choi, J. Nanoparticle Res., 2009, 11, 1981–1989 CrossRef CAS.
- S. R. Chowdhury, E. K. Yanful and A. R. Pratt, Environ. Earth Sci., 2011, 64, 411–423 CrossRef CAS.
- S. Liu, S. Kang, G. Wang, H. Zhao and W. Cai, J. Colloid Interface Sci., 2015, 458, 94–102 CrossRef CAS PubMed.
- L. Hao, M. Liu, N. Wang and G. Li, RSC Adv., 2018, 8, 39545–39560 RSC.
- K. D. Hristovski, P. K. Westerhoff, T. Möller and P. Sylvester, Chem. Eng. J., 2009, 146, 237–243 CrossRef CAS.
- J. A. Arcibar-Orozco, M. Avalos-Borja and J. R. Rangel-Mendez, Environ. Sci. Technol., 2012, 46, 9577–9583 CrossRef CAS PubMed.
- Y. Xiong, Q. Tong, W. Shan, Z. Xing, Y. Wang, S. Wen and Z. Lou, Appl. Surf. Sci., 2017, 416, 618–627 CrossRef CAS.
- Q. Chang, W. Lin and W. Chi Ying, J. Hazard. Mater., 2010, 184, 515–522 CrossRef CAS PubMed.
- Z. Liu, F. S. Zhang and R. Sasai, Chem. Eng. J., 2010, 160, 57–62 CrossRef CAS.
- L. Hao, T. Zheng, J. Jiang, Q. Hu, X. Li and P. Wang, RSC Adv., 2015, 5, 10723–10732 RSC.
- M. Mosaferi, S. Nemati, A. Khataee, S. Nasseri and A. A. Hashemi, J. Environ. Health Sci. Eng., 2014, 121, 1–11 Search PubMed.
- L. Lorenzen, J. S. J. van Deventer and W. M. Landi, Miner. Eng., 1995, 8, 557–569 CrossRef CAS.
- Z. Li, S. Deng, G. Yu, J. Huang and V. C. Lim, Chem. Eng. J., 2010, 160, 106–113 CrossRef.
- J. Pattanayak, K. Mondal, S. Mathew and S. B. Lalvani, Carbon, 2000, 38, 589–596 CrossRef CAS.
- H. Genç-Fuhrman, J. C. Tjell and D. McConchie, Environ. Sci. Technol., 2004, 38, 2428–2434 CrossRef.
- N. Claoston, A. W. Samsuri, M. H. Ahmad Husni and M. S. Mohd Amran, Waste Manage. Res., 2014, 32, 331–339 CrossRef CAS PubMed.
- Y. Chammui, P. Sooksamiti, W. Naksata, S. Thiansem and O. anong Arqueropanyo, Chem. Eng. J., 2014, 240, 202–210 CrossRef CAS.
- S. Lunge, S. Singh and A. Sinha, J. Magn. Magn. Mater., 2014, 356, 21–31 CrossRef CAS.
| This journal is © The Royal Society of Chemistry 2021 |

