 Open Access Article
Synthesis conditions impact on Sr11Mo4O23 electroceramic: crystal structure, stability and transport properties†
Carlos Darío Miranda a,
Dimar Villarroel-Rocha
 b,
Karim Sapagb,
Carlos Alberto López
 *a,
José Carmelo Pedregosaa and
José Antonio Alonso
 c
c
aINTEQUI, Universidad Nacional de San Luis, CONICET and Facultad de Química, Bioquímica y Farmacia, UNSL, Almirante Brown 1455, San Luis, Argentina. E-mail: calopez@unsl.edu.ar
bINFAP, Universidad Nacional de San Luis, CONICET, Ejército de los Andes 950, San Luis, Argentina
cInstituto de Ciencia de Materiales de Madrid, CSIC, Cantoblanco, 28049 Madrid, Spain
First published on 13th April 2021
Abstract
Crystal structure and properties of Sr11Mo4O23 treated at 1100 and 1400 °C were studied via synchrotron X-ray powder diffraction and thermogravimetric analysis, coupled with mass spectrometry. Synchrotron studies reveal the crystallographic effect of the annealing temperature, showing that the lowest-temperature phase must be defined in a triclinic symmetry, in contrast to the cubic one obtained at 1400 °C. The mass spectrometry allowed the identification of the released compounds during the thermogravimetric analysis, thus unveiling the physicochemical behavior of the sample during the heating process. Furthermore, an aging analysis was made, confirming the superior stability of this sample when it is treated at 1400 °C. Finally, an optimized sintering procedure allowed us to obtain a superior density and hence the highest conductivity measured so far for this system.
Introduction
Fuel cells (FC) are environmentally sustainable electrochemical devices that directly convert the chemical energy stored in fuels into electric power.1,2 A particular type are the so-called Solid Oxide Fuel Cells (SOFC), which are made up of solid components, including the electrolyte, which would need high temperatures (typically over 750 °C, and as much as 1000 °C) to work properly.3,4 SOFCs exhibit excellent conversion rates and performance, due to the enhanced kinetics associated with the working temperatures; in addition, they are flexible regarding the used fuel (often H2 or CH4).5 Given the desirable reduction of the working temperatures, the solid components of SOFCs (electrodes, electrolytes and interconnects) are nowadays actively investigated and developed to meet the technological needs. The solid electrolyte, acting as a separator between the electrodes where the two redox semi-reactions take place, needs to display an excellent ionic conductivity, of either O2− or H+ ions. On the other hand, the electrodes, cathode and anode, must have both electronic and ionic conduction, in addition to the ability to catalyse the reduction of O2 and oxidation of H2, respectively. Actually, the progress in SOFC research relies on the development of novel materials with enhanced properties.6,7The materials with perovskite structure (ABO3) present a versatile crystal structure that may contain oxygen vacancies, enabling the oxide ion motion across the solid; hence, they could satisfactorily work as SOFC electrolytes.8–10 La0.8Sr0.2Ga0.8Mg0.2O3 (LSGM), for example, is an electrolyte based on the LaGaO3 perovskite,11 and its conductivity is slightly higher than other well-known electrolytes like yttria stabilized zirconia (YSZ) and gadolinium doped ceria (GDC).12,13 Due to the exceptional flexibility of the perovskite structure, many have been extensively characterized and novel compositions and superstructures continue to be explored. An example of this is the strongly defective double perovskite Sr11Mo4O23, which has been obtained and characterized in our group.14,15 The double-perovskite nature is patent when rewritten as (Sr7)A(Sr4Mo4)BO23 or Sr1.72SrMoO5.75, where part of the Sr2+ atoms are at the A sublattice, and the rest accommodates in the octahedral B sublattice. The presence of a large cation as Sr2+ at the B site leads to a strongly distorted framework, described as a broken corner-sharing arrangement of the octahedral network.16 Neutron powder diffraction data reported by us revealed that this phase crystallizes in the tetragonal I41/a space group; furthermore, a combination of reversible and non-reversible processes was described by thermogravimetric analysis.14 In addition, the conductivity property of this oxide makes it a promising framework where to look for novel solid-state electrolytes. In fact, some enhancement in the conductivity has been obtained upon Nb, Ti and Al doping.17–19 On the other hand, King et al. presented novel structural evidences and reported Sr11Mo4O23 as cubic (Fd![[3 with combining macron]](https://www.rsc.org/images/entities/char_0033_0304.gif) m), the difference between both materials only residing in the annealing temperature.20 In addition, in a recent work, Kharton et al. studied the ionic conductivity and also observed the mass changes with temperature.21 So far, the physicochemical reasons behind these changes remain unknown.
m), the difference between both materials only residing in the annealing temperature.20 In addition, in a recent work, Kharton et al. studied the ionic conductivity and also observed the mass changes with temperature.21 So far, the physicochemical reasons behind these changes remain unknown.
Considering these facts, this work presents the study of two phases of Sr11Mo4O23 obtained at 1100 and 1400 °C, using synchrotron X-ray diffraction to analyze the structural differences between them; the results from thermogravimetric analysis coupled with mass spectroscopy helped us to unveil the chemical changes occurring at high temperatures. Furthermore, a superior sintering process that yields the highest conductivity to date is reported.
Experimental
The sample was obtained via citrate method as it was previously reported.14 Pure reactants (NH4)6Mo7O24·4H2O and Sr(NO3)2 were dissolved in a beaker with a citric acid solution (10%), and the resulting solution was dried, until the formation of a viscous gel. Then, the gel was placed in a furnace for 2 hours at 200 °C, forming an organometallic low-density foam. This foam was ground and then heated at 600 °C to decompose the organic matrix. Then, the fine powder was heated at 800 °C for 12 h, reground in agate mortar, and fired again up to 1100 °C for 12 h. Finally, after grinding in the mortar, half of the powder product was fired at 1400 °C for 8 h. The obtained samples with final treatments at 1100 °C and 1400 °C were labelled as SMO11 and SMO14, respectively.All the samples were analyzed using a Rigaku Ultima IV type II diffractometer with Kα-Cu radiation λ = 1.5418 Å, collecting laboratory XRPD patterns. Preliminary Rietveld refinements confirmed the presence of Sr11Mo4O23 above 800 °C. A more in-depth analysis of the crystal structure and temperature dependence was subsequently carried out by using synchrotron X-ray powder diffraction (SXRPD). Patterns were collected on the MSPD diffractometer, beamline Bl-04, at the ALBA synchrotron, Cerdanyola del Vallès, Spain.22 The sample was held inside a 300 μm diameter amorphous quartz capillary that was rotating during the data acquisition. Collection temperatures were 25, 200, 400, 600 and 800 °C for SMO11 sample, using the high angular resolution mode (MAD set-up), with the beam energy set at 38 keV, λ = 0.3252 Å. SXRPD whole patterns were fitted using the FullProf Suite software,23,24 for accurate and detailed determination of the structural parameters and features.
Thermogravimetric analysis (TGA) was carried out using an SDT Q600 thermal analyser (TA Instruments). The samples (ca. 5 mg) were placed in an alumina pan and then heated from room temperature up to 1000 °C under air and He atmosphere at 100 mL min−1, using a heating rate of 10 °C min−1. The evolved gases were analyzed using a Discovery mass spectrometer. The obtained data were treated with the software Universal Analysis 2000 from TA Instrument.
Scanning electron microscopy (SEM) images were obtained on a Zeiss LEO1450VP instrument; the samples were placed on adhesive carbon tape coated with gold.
Electrical conductivity was measured by two-probe electrochemical impedance spectroscopy (EIS) from 200 to 900 °C, in 50 °C steps, with different sample atmospheric/environment conditions, using a Potentiostat/Galvanostat AUTOLAB PGSTAT 302 from ECO CHEMIE. The spectral region of frequencies set for each experiment ranged from 105 down to 0.1 Hz, using the same logarithmic down stepping in each run. An improved pellet sintering process was obtained by high-energy ball milling. Before milling, the sample was mixed with 1% in weight proportion of PVDF polymer. Milling conditions were the following: six tungsten carbide 15 mm diameter balls, in a 80 mL tungsten carbide grinding bowl, ball-to-powder ratio of 18, disk rotational speed of 370 rpm, totalling 7.5 h of milling. This amounts to approximately 65 MJ g−1 of total cumulated energy.25 The resulting fine powder was pressed using a die at 5000 psi, obtaining a dense disk. Afterwards, the disk was sintered at 1100, 1200, and 1300 °C, for 8 hours at each temperature, with heating and cooling rates of 5 °C min−1, in order to avoid the cracking of the pellet and for ensuring both optimal grain growth and sintering. Disk density was measured between each heating stage, achieving a final density of 4.92 g cm−3, which corresponds to 95% of the crystallographic (theoretical) density. For these measurements, sintered pellets were painted with a thin uniform layer of Pt conductive paste, then Pt wire contacts/electrodes were attached to each of the disk sides with the same Pt paste. Finally, the whole device was fired at 1100 °C for 1 h to sinter the Pt paste.
Results and discussion
Structural features and refinement
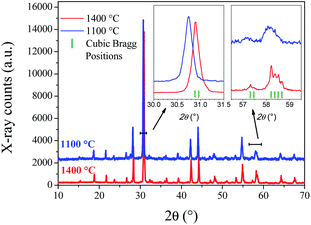
Laboratory XRPD patterns at RT of SMO11 and SMO14 (Fig. 1) exhibit subtle differences, suggesting that SMO11 presents a lower symmetry than SMO14. The diffraction pattern of Sr11Mo4O23 treated at 1400 °C can be indexed with a cubic symmetry in the Fd![[3 with combining macron]](https://www.rsc.org/images/entities/char_0033_0304.gif) m space group, as previously reported by King et al.20 This pattern was properly fitted with this cubic model with a unit-cell parameter of 16.3982(2) Å. Fig. S1 (ESI) and Table S1† show the Rietveld refinement crystallographic results, respectively. However, the sample treated at 1100 °C exhibits some peaks with an unusual shape, and it seems that plausible additional lines are masked due to the instrumental limitation. The insets of Fig. 1 show zooms of the selected lines of the cubic SMO14, in contrast with the SMO11 pattern. A Sr11Mo4O23 phase obtained in similar conditions to SMO11 was reported previously as tetragonal in I41/a space group from XRPD and NPD14 by some of us. The refinement in the tetragonal model for SMO11 converged notoriously well; however, a higher resolution diffraction pattern was essential to resolve the lower-symmetry features, described in the following.
m space group, as previously reported by King et al.20 This pattern was properly fitted with this cubic model with a unit-cell parameter of 16.3982(2) Å. Fig. S1 (ESI) and Table S1† show the Rietveld refinement crystallographic results, respectively. However, the sample treated at 1100 °C exhibits some peaks with an unusual shape, and it seems that plausible additional lines are masked due to the instrumental limitation. The insets of Fig. 1 show zooms of the selected lines of the cubic SMO14, in contrast with the SMO11 pattern. A Sr11Mo4O23 phase obtained in similar conditions to SMO11 was reported previously as tetragonal in I41/a space group from XRPD and NPD14 by some of us. The refinement in the tetragonal model for SMO11 converged notoriously well; however, a higher resolution diffraction pattern was essential to resolve the lower-symmetry features, described in the following.
Synchrotron X-ray analysis
To unveil the structural distortions observed in the SMO11 sample, high-resolution SXRPD patterns were collected at 25, 200, 400, 600 and 800 °C. As was argued from laboratory XRPD data, the synchrotron patterns confirm that this sample presents a lower symmetry from 25 °C up to 600 °C. In contrast, at 800 °C the diffraction lines can be indexed in a cubic symmetry. Fig. 2 plots the synchrotron pattern refinements at 800 °C in the cubic model (Fd![[3 with combining macron]](https://www.rsc.org/images/entities/char_0033_0304.gif) m), with a unit-cell parameter of 16.61883(3) Å. In this model, strontium atoms are distributed among three crystallographic (Wyckoff) sites; molybdenum between two, and oxygen among three. Two out of three Sr atoms (Sr18b and Sr248f) belong to the A-site sublattice, while the remaining Sr with the two Mo atoms (Sr332e, Mo116d and Mo216c) correspond to B-site cations, in a conventional perovskite framework. Finally, the oxygen atoms are distributed over three positions: O196g, O296g and O396h.
m), with a unit-cell parameter of 16.61883(3) Å. In this model, strontium atoms are distributed among three crystallographic (Wyckoff) sites; molybdenum between two, and oxygen among three. Two out of three Sr atoms (Sr18b and Sr248f) belong to the A-site sublattice, while the remaining Sr with the two Mo atoms (Sr332e, Mo116d and Mo216c) correspond to B-site cations, in a conventional perovskite framework. Finally, the oxygen atoms are distributed over three positions: O196g, O296g and O396h.
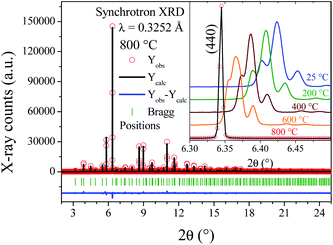 | ||
| Fig. 2 SXRPD pattern of SMO11 obtained at 800 °C, after the Rietveld refinement in a cubic unit cell. Inset: Thermal evolution of main line, (440) in the cubic model. | ||
At lower temperatures, the patterns exhibit clearly the line splitting due to a symmetry reduction, as illustrated in the inset of Fig. 2, where the main reflection corresponding to the (440) plane of different temperature patterns are compared. The first attempts to solve this structure with a tetragonal (I41/a) model were not successful, due to the lack of sufficient reflections to account for all the observed lines, thus indicating that the symmetry would be lower, namely monoclinic or triclinic. Later, testing with an indexing software did not lead to any plausible solutions. Given these facts, the cubic unit-cell at 800 °C was used to build the possible monoclinic and triclinic cells (16.61 Å ≈ a ≈ b ≈ c and 90 ≈ α ≈ β ≈ γ) using the holohedral space groups: P2 and P1, respectively. Le-Bail refinements show that the triclinic model leads to a fit with lower reliability factors than the P2 space group; furthermore, the α and γ parameters are far from 90°, taking into account the standard deviations. Although the pattern was properly fitted in both P1 and P![[1 with combining macron]](https://www.rsc.org/images/entities/char_0031_0304.gif) space groups, the later was preferred to assemble the proposed model. The high-temperature structure was the departure model to build the triclinic atomic distribution in the P
space groups, the later was preferred to assemble the proposed model. The high-temperature structure was the departure model to build the triclinic atomic distribution in the P![[1 with combining macron]](https://www.rsc.org/images/entities/char_0031_0304.gif) space group. Thus, the Sr1, Sr2, Sr3, Mo1, Mo2, O1, O2 and O3 atoms of the cubic space group are distributed in 24, 4, 16, 10, 10, 48, 48 and 48 new sites, respectively, in the P
space group. Thus, the Sr1, Sr2, Sr3, Mo1, Mo2, O1, O2 and O3 atoms of the cubic space group are distributed in 24, 4, 16, 10, 10, 48, 48 and 48 new sites, respectively, in the P![[1 with combining macron]](https://www.rsc.org/images/entities/char_0031_0304.gif) space group. This model was tested at the four available temperatures. Then, consecutively, the unit-cell parameters, profile parameters, isotropic displacement factors and atomic positions for Sr and Mo atoms were refined, reaching 188 independent parameters. It was not possible to refine the oxygen positions due to the excessively high number of new independent parameters, as high as 576, which quite likely would have led to unstable and/or non-realistic results. Despite these constraints, all the patterns were successfully refined, obtaining proper fits within the 2θ range of 2°–30° (dhkl = 9.3–0.63 Å). Fig. 3 shows the final refinement at room temperature, and the inset shows a detail of the fit of the most intense reflection. Table S2† lists the crystallographic parameters and Fig. S2† illustrates the crystal structure of SMO11 at 25 °C. Fig. S3–S5† show the Rietveld refinements at 200, 400 and 600 °C. Table 1 lists the unit-cell parameters and reliability factors for all the temperatures, and Fig. 4 plots the thermal evolution of the unit-cell parameters of the SMO11 sample compared with those of cubic SMO14 at room temperature. A view of the crystal structure at 800 °C is shown in the inset of Fig. 4b. A volume reduction is observed for SMO14, which is certainly related to a higher compactness of the crystal structure. This structural difference between both samples reveals the decisive effect of the synthesis temperature in the crystal structure. Previous result where this sample (treated at 1200 °C) was defined in a tetragonal structure (I41/a)14 can be incorporated to this analysis. Evidently, synthesis temperatures below 1400 °C are not sufficient to stabilize the cubic symmetry.
space group. This model was tested at the four available temperatures. Then, consecutively, the unit-cell parameters, profile parameters, isotropic displacement factors and atomic positions for Sr and Mo atoms were refined, reaching 188 independent parameters. It was not possible to refine the oxygen positions due to the excessively high number of new independent parameters, as high as 576, which quite likely would have led to unstable and/or non-realistic results. Despite these constraints, all the patterns were successfully refined, obtaining proper fits within the 2θ range of 2°–30° (dhkl = 9.3–0.63 Å). Fig. 3 shows the final refinement at room temperature, and the inset shows a detail of the fit of the most intense reflection. Table S2† lists the crystallographic parameters and Fig. S2† illustrates the crystal structure of SMO11 at 25 °C. Fig. S3–S5† show the Rietveld refinements at 200, 400 and 600 °C. Table 1 lists the unit-cell parameters and reliability factors for all the temperatures, and Fig. 4 plots the thermal evolution of the unit-cell parameters of the SMO11 sample compared with those of cubic SMO14 at room temperature. A view of the crystal structure at 800 °C is shown in the inset of Fig. 4b. A volume reduction is observed for SMO14, which is certainly related to a higher compactness of the crystal structure. This structural difference between both samples reveals the decisive effect of the synthesis temperature in the crystal structure. Previous result where this sample (treated at 1200 °C) was defined in a tetragonal structure (I41/a)14 can be incorporated to this analysis. Evidently, synthesis temperatures below 1400 °C are not sufficient to stabilize the cubic symmetry.
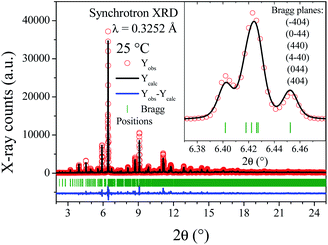 | ||
| Fig. 3 SXRPR pattern at room temperature, after the Rietveld refinement in a triclinic lattice. Inset: Detailed view of main reflection, including the planes obtained from the (440) cubic one. | ||
| Temperature | Uint-cell parameters | Reliability factors |
|---|---|---|
| 25 °C | a = 16.4007(8) Å, α = 90.084(3)° | Rp = 14.8%, Rwp = 19.9%, RBragg = 43.7%, χ2 = 5.62 |
| b = 16.4237(5) Å, β = 90.449(1)° | ||
| c = 16.4090(8) Å, γ = 89.964(4)° | ||
| 200 °C | a = 16.4413(6) Å, α = 90.080(2)° | Rp = 13.6%, Rwp = 18.4%, RBragg = 40.8%, χ2 = 4.79 |
| b = 16.4661(4) Å, β = 90.408(1)° | ||
| c = 16.4515(6) Å, γ = 89.969(3)° | ||
| 400 °C | a = 16.4952(5) Å, α = 90.064(2)° | Rp = 12.9%, Rwp = 17.3%, RBragg = 46.0%, χ2 = 4.28 |
| b = 16.5214(4) Å, β = 90.334(1)° | ||
| c = 16.5040(5) Å, γ = 89.974(3)° | ||
| 600 °C | a = 16.5443(4) Å, α = 90.077(2)° | Rp = 12.5%, Rwp = 16.6%, RBragg = 46.8%, χ2 = 3.92 |
| b = 16.5737(3) Å, β = 90.323(1)° | ||
| c = 16.5530(4) Å, γ = 89.951(2)° | ||
| 800 °C | a = 16.61883(3) Å | Rp = 8.5%, Rwp = 11.4%, RBragg = 11.6%, χ2 = 2.43 |
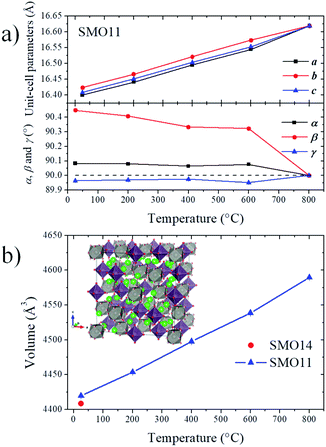 | ||
| Fig. 4 Thermal evolution of unit-cell parameters (a) and volume (b). Inset: Crystal structure at 800 °C. | ||
Thermogravimetric analysis-mass spectrometry (TGA-MS)
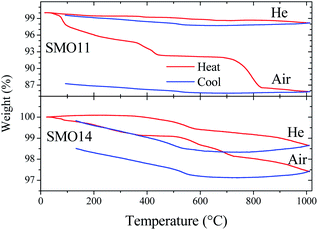
Thermal analysis coupled to mass spectrometry was useful to study the physicochemical changes in both samples (SMO11 and SMO14) upon heating and cooling, and to survey the thermal treatment effect in their structural stability. In order to identify the products formed in the process, the following fragments were set for measurement as a function of temperature: CO2˙+ (m/z = 44), O2˙+ (m/z = 32), H2O˙+ (m/z = 18), HO˙+ (m/z = 17) and O˙+ (m/z = 16). These fragments were selected to seek for the elimination or up-take of CO2, H2O or O2. The experiments for each sample were carried out in two cycles of heating and cooling in air and then this program was repeated in a helium atmosphere. This last cycle in helium was conducted for two reasons: to reveal the presence of any reversible process and, on the other hand, to avoid that atmospheric O2 could interfere in detecting O2˙+ fragments, should the sample present any oxygen evolution.Fig. 5 shows the sample weight as a function of the temperature in the conditions mentioned above. The main difference between both experiments resides in the overall weight loss. In the first cycle (in air), SMO11 loses more weight than SMO14, revealing the superior stability of Sr11Mo4O23 when it is treated at 1400 °C. On the other hand, in both samples the weight loses are distributed in more than one process. These weight profiles are similar to those previously reported by us, where both reversible and non-reversible processes were observed.14 The irreversible changes were assigned to dehydration and decarbonation of the sample due to the surface absorptions of H2O and CO2 after a time in ambient atmosphere; these facts were confirmed from FTIR spectroscopy.14 These processes are clearly observed, for SMO11 sample, below 300 °C and above 700 °C. For SMO14 sample these steps are more subtle but they do not disappear. On the other hand, the most interesting fact resides in the reversible process, between 300 and 700 °C, displayed in Fig. 5 for both air and helium runs. This reversible process has been explained by proposing the removal and uptake of O2, H2O or CO2;14,17,19,21 however, these works contain no conclusive evidences to confirm or discard any of them.
The thermal evolution of fragment signals from mass spectroscopy is shown in Fig. 6. SMO11, in the first cycle in air, presents several strong peaks (90, 190, 390 and 430 °C) of H2O˙+ and HO˙+ fragments indicating the water elimination. In addition, this sample exhibits a continuous elimination of CO2 up to 350 °C and a strong peak centred at 800 °C. Thus, there is evolution of both H2O and CO2 in the first irreversible process, observed up to 300–350 °C. Taking into account these fragments profiles, the water eliminated up to ≈130 °C corresponds to adsorbed water. Then, in the 130–350 °C range the H2O and CO2 eliminated can be assigned to hydrated or basic strontium carbonates (SrCO3·H2O or Sr2(OH)2CO3). The two last peaks of water release, without CO2 elimination (390 and 430 °C), can be produced by the Sr(OH)2 decomposition. The next irreversible process (above to 700 °C) is only accompanied with CO2 release, hence, it correspond to the SrCO3 decomposition. This behaviour supports that the sample adsorbs water and it reacts with the sample, producing Sr(OH)2, which yields SrCO3 with the atmospheric CO2.
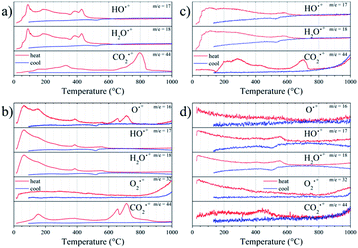 | ||
| Fig. 6 Thermal evolution of the fragment signals of SMO11 (a and b) and SMO14 (c and d) in Air (a and c) and He (b and d) atmospheres. | ||
Regarding the reversible mass loss, between 500 and 650 °C approximately, the associated changes in the fragments evolutions are minimized due to the high intensity of the processes mentioned above; however, these are well observed in the second cycle with helium flow (Fig. 6b), where O2˙+ and O˙+ fragments were also detected. In the second cycle, it is possible to observe that those irreversible processes, despite being noticeably weaker, take place anyhow. This indicates that the sample undergoes rehydration and recarbonation between the cycles, highlighting the high hygroscopic character of the SMO11 sample. In spite of this, in this second cycle it is possible to observe that the reversible mass process is accompanied with a water loss and uptake at 570 and 515 °C, respectively, as the evolution of fragments with m/z = 18, 17 and 16 suggest. In addition, the absence of changes in the O2˙+ fragment would allow discarding or considering negligible the loss/uptake of O2, as proposed in previous works.14,21
On the other hand, the first cycle in air (Fig. 6c) of SMO14 shows a profile resembling that of SMO11, but it is less intense considering the weight changes. This is a solid evidence that Sr11Mo4O23 phase achieves a superior stability when it is heated at 1400 °C. Furthermore, as displayed in Fig. 6d, the reversible process of water elimination and uptake nonetheless still remains in this sample (SMO14), occurring at 550 and 500 °C, respectively. Fig. 6d also shows that there is no evidence of reversible loss and uptake of O2 and/or CO2, as proposed previously.14,21
Aging analysis
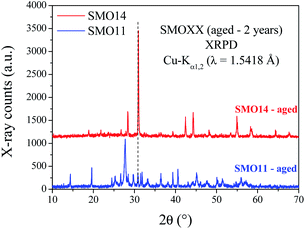
To deepen in the long-term stability of both samples, TGA was performed after two years from previous measurements. Comparisons between fresh and aged TGA data are shown in Fig. S6.† These plots show that SMO11 after this time exhibits a similar amount of weight loss but with a slightly different thermal evolution. However, for SMO14 (Fig. S6b†) there are no differences in the TGA profile between the fresh and aged samples. This fact also supports the higher stability of SMO14; however, a structural evidence is also needed to understand the aging process.The XRPD patterns collected after two years are plotted in Fig. 7. These patterns show that the SMO14 sample remains unaltered. Nevertheless, in SMO11 the Sr11Mo4O23 structure was almost completely decomposed, yielding SrMoO4, SrCO3 and Sr(OH)2·H2O, as illustrated in Fig. S7.† These results confirm the superior chemical stability of Sr11Mo4O23 when it is synthesized at 1400 °C.
Conductivity measurements
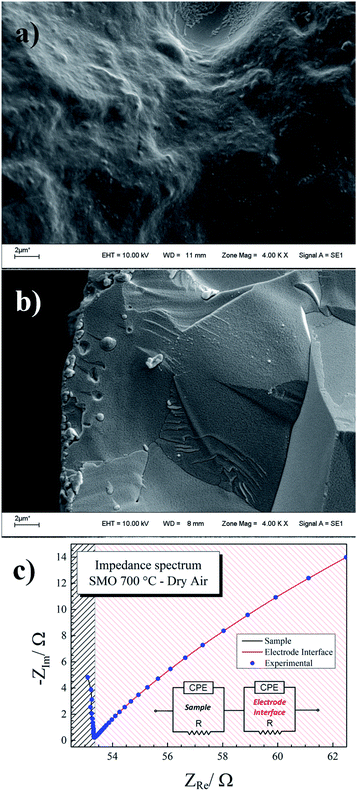
Temperature-dependent impedance spectroscopy measurements were carried out in order to characterize the thermal evolution of the transport parameters, such as the bulk conductivity. After firing the sample at 1400 °C, in the aforementioned synthesis step, it was subjected to further mechanical treatment. This was done before pressing the pellet, to ensure an optimal particle size and pore mean diameter as low as possible. After due compaction and sintering, the highly dense pellet obtained (95% of crystallographic density) had its sides painted with the Pt paste, as described before.Fig. 8a and b show SEM images of sintered pellet used in the measurements, and Fig. 8c plots the representative impedance spectrum at 700 °C. Each experimental spectrum was modelled with an equivalent circuit with two components (see inset Fig. 8c). The first arc at higher frequencies (red line) is attributed to the sample contributions. On the other hand, the second contribution (blue line) is assigned to the electrode interface (sample/Pt paint).
Sample atmospheric/environment composition, i.e. oxygen partial pressure, varied from negligible (pure N2), to rich (air in analytical grade), during each set of experiments. The atmosphere was saturated during two further sets of runs with water vapour, which was added as a secondary component, trying to measure whether any hint of proton conductivity is present. In all cases, the measurements were performed at temperatures ranging from 950 to 200 °C with intervals of 50 °C, with heat rates of −5 °C min−1, dwelling 15 minutes at each step before the acquisition of the impedance spectra. This was done to make sure that temperature homogeneity was achieved all over the sample.
The thermal evolution of conductivity plotted in Fig. 9 shows that the investigated atmospheres played an almost negligible role on the measured values, such that the obtained conductivity values were remarkably close to each other. In a detailed analysis, it is possible to observe subtle changes with the atmospheric conditions that could be explained in terms of high oxygen-ion conduction and a low protonic conduction component below to 400 °C. These facts are in agreement with the thermochemical behaviour of the sample shown above from TGA-MS data. Kharton et al. also reported this atmosphere conductivity dependence,21 but in the present work the changes were more insignificant, most likely due to a superior stability of SMO14 to humid atmospheres.
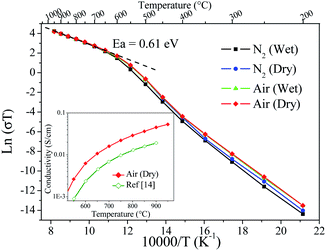 | ||
| Fig. 9 ln(σT) vs. 1/T for different atmosphere conditions. Inset: Comparison between the previous14 and the present conductivity thermal evolution. | ||
The activation energy was calculated from the Arrhenius plots in Fig. 9 yielding 0.61 eV; this value is in agreement with the preceding work.14,21 However, the conductivities are superior to previous data; for instance, the conductivity of SMO14 at 800 °C is 0.029 S cm−1, which doubles the values formerly reported at this temperature.14,21 Inset in Fig. 9 shows the comparison between the previous and the present conductivity thermal evolution. These enhanced values are assigned to the superior sintering level reached with the previous ball milling treatment and the use of PVDF. Even if this value is below those exhibited by electrolytes such as LSGM (0.14 S cm−1),11 La2Mo2O9 (0.13 S cm−1)26 and GDC (8.5 × 10⁻² S cm−1),12 it is indeed superior to YSZ (2.1 × 10⁻² S cm−1)13 in this temperature range. Thus, the Sr11Mo4O23 phase presents promising features, although a significant conductivity enhancement would be still needed to compete with state-of-the art electrolytes in SOFC.
Conclusions
The strong structural dependence of Sr11Mo4O23 with the synthesis temperature was confirmed by resolving the dichotomy posed in previous works. While at higher temperatures (1400 °C) a cubic crystal structure is stabilized, a sample annealed at lower temperatures (1100 °C) exhibits a SXRD pattern that matches with a triclinic symmetry. In spite of the inherent difficulty of resolving ab initio a new structure in this low symmetry from powder data, the synchrotron patterns (at 25, 200, 400 and 600 °C) were well fitted with the P![[1 with combining macron]](https://www.rsc.org/images/entities/char_0031_0304.gif) model built from the cubic one. This result reveals the non-negligible effect of the final temperature used in the synthesis process in the resulting crystal structure. On the other hand, the TG-MS turned out to be a powerful method to provide conspicuous evidence of the reversible and non-reversible processes occurring by interaction with the atmosphere at high temperature. The main result of this technique was to show that the reversible process around 500 °C corresponds to a loss and uptake of water. Besides, the aging analysis reveals that a synthesis temperature of 1400 °C is needed to achieve a long-term chemical and structural stability. Finally, a superior sintering effect was obtained after ball milling the sample and using PVDF as additive, leading to an excellent oxide-ion conductivity, comparable to that of YSZ at 800 °C, doubling previous reported values for the SMO system.
model built from the cubic one. This result reveals the non-negligible effect of the final temperature used in the synthesis process in the resulting crystal structure. On the other hand, the TG-MS turned out to be a powerful method to provide conspicuous evidence of the reversible and non-reversible processes occurring by interaction with the atmosphere at high temperature. The main result of this technique was to show that the reversible process around 500 °C corresponds to a loss and uptake of water. Besides, the aging analysis reveals that a synthesis temperature of 1400 °C is needed to achieve a long-term chemical and structural stability. Finally, a superior sintering effect was obtained after ball milling the sample and using PVDF as additive, leading to an excellent oxide-ion conductivity, comparable to that of YSZ at 800 °C, doubling previous reported values for the SMO system.
Conflicts of interest
There are no conflicts to declare.Acknowledgements
CDM acknowledges CONICET for PhD fellowship. CAL acknowledges ANPCyT for financial support (project PICT 2017-1842). JCP and CAL thanks CONICET (PIP 00912/12 and PIP 00820CO); and SECyT-UNSL (PROICO 2-2320). JAA thanks the Spanish MINECO for funding the project MAT2017-84496-R. We are grateful to Dr N. A. Ochoa (INFAP CONICET-UNSL) for providing the impedance measurements facilities. We are grateful to ALBA for making the synchrotron light beamtime available.References
- B. C. H. Steele and A. Heinzel, Nature, 2001, 414, 345–352 CrossRef CAS PubMed.
- A. M. Abdalla, S. Hossain, P. M. Petra, M. Ghasemi and A. K. Azad, Front. Energy, 2020, 14, 359–382 CrossRef.
- B. Yang, J. Wang, M. Zhang, H. Shu, T. Yu, X. Zhang, W. Yao and L. Sun, Energy Convers. Manage., 2020, 213, 112856 CrossRef.
- D. J. L. Brett, A. Atkinson, N. P. Brandon and S. J. Skinner, Chem. Soc. Rev., 2008, 37, 1568 RSC.
- H. Su and Y. H. Hu, Chem. Eng. J., 2020, 402, 126235 CrossRef CAS.
- C. Graves, S. D. Ebbesen, S. H. Jensen, S. B. Simonsen and M. B. Mogensen, Nat. Mater., 2015, 14, 239–244 CrossRef CAS.
- S. Sengodan, S. Choi, A. Jun, T. H. Shin, Y.-W. Ju, H. Y. Jeong, J. Shin, J. T. S. Irvine and G. Kim, Nat. Mater., 2015, 14, 205–209 CrossRef CAS PubMed.
- T. Ishihara, Perovskite Oxide for Solid Oxide Fuel Cells, Springer US, Boston, MA, 2009 Search PubMed.
- Z. Gao, L. V. Mogni, E. C. Miller, J. G. Railsback and S. A. Barnett, Energy Environ. Sci., 2016, 9, 1602–1644 RSC.
- I. R. de Larramendi, N. Ortiz-Vitoriano, I. B. Dzul-Bautista and T. Rojo, Perovskite Materials - Synthesis, Characterisation, Properties, and Applications, InTech, 2016 Search PubMed.
- K. Huang, R. S. Tichy and J. B. Goodenough, J. Am. Ceram. Soc., 2005, 81, 2565–2575 CrossRef.
- V. Kharton, F. Marques and A. Atkinson, Solid State Ionics, 2004, 174, 135–149 CrossRef CAS.
- J. W. Fergus, J. Power Sources, 2006, 162, 30–40 CrossRef CAS.
- C. A. López, J. C. Pedregosa, D. G. Lamas and J. A. Alonso, J. Appl. Crystallogr., 2014, 47, 1395–1401 CrossRef.
- C. A. López, J. C. Pedregosa, M. T. Fernández-Díaz and J. A. Alonso, J. Appl. Crystallogr., 2016, 49, 78–84 CrossRef.
- G. King, A. M. Abakumov, J. Hadermann, A. M. Alekseeva, M. G. Rozova, T. Perkisas, P. M. Woodward, G. Van Tendeloo and E. V. Antipov, Inorg. Chem., 2010, 49, 6058–6065 CrossRef CAS PubMed.
- C. D. Miranda, C. A. López, J. C. Pedregosa and J. A. Alonso, Dalton Trans., 2017, 46, 3934–3942 RSC.
- C. A. López, J. C. Pedregosa, M. T. Fernández-Díaz and J. A. Alonso, RSC Adv., 2017, 7, 16163–16172 RSC.
- C. D. Miranda, C. A. López, J. C. Pedregosa, M. T. Fernández-Díaz and J. A. Alonso, Solid State Ionics, 2019, 339, 115003 CrossRef CAS.
- G. King, M. Avdeev, I. Qasim, Q. Zhou and B. J. Kennedy, Dalton Trans., 2017, 46, 12466–12473 RSC.
- V. V. Kharton, E. V. Tsipis, V. A. Kolotygin, M. Avdeev and B. J. Kennedy, J. Solid State Electrochem., 2020, 24, 2943–2951 CrossRef CAS.
- F. Fauth, R. Boer, F. Gil-Ortiz, C. Popescu, O. Vallcorba, I. Peral, D. Fullà, J. Benach and J. Juanhuix, Eur. Phys. J. Plus, 2015, 130, 160 CrossRef.
- H. M. Rietveld, J. Appl. Crystallogr., 1969, 2, 65–71 CrossRef CAS.
- J. Rodríguez-Carvajal, Phys. B, 1993, 192, 55–69 CrossRef.
- T. Rojac, M. Kosec, B. Malič and J. Holc, J. Eur. Ceram. Soc., 2006, 26, 3711–3716 CrossRef CAS.
- A. Tarancón, T. Norby, G. Dezanneau, A. Morata, F. Peiró and J. R. Morante, Electrochem. Solid-State Lett., 2004, 7, A373 CrossRef.
Footnote |
| † Electronic supplementary information (ESI) available. CCDC 2049039–2049043. For ESI and crystallographic data in CIF or other electronic format see DOI: 10.1039/d0ra10620h |
| This journal is © The Royal Society of Chemistry 2021 |

