 Open Access Article
A signal-on fluorescent aptasensor based on gold nanoparticles for kanamycin detection
Yimeng Suna,
Tong Qia,
Yan Jinac,
Lijuan Liang *a and
Jianlong Zhaoab
aState Key Laboratory of Transducer Technology, Shanghai Institute of Microsystem and Information Technology, Chinese Academy of Sciences, Shanghai 200050, China. E-mail: llj@mail.sim.ac.cn
bCenter of Materials Science and Optoelectronics Engineering, University of Chinese Academy of Sciences, Beijing 100049, China
cCollege of Sciences, Shanghai Institute of Technology, Shanghai 201418, China
First published on 8th March 2021
Abstract
This study describes the development, verification and practical application of an aptasensor for the fluorometric detection of kanamycin. Using the nucleic acid aptamer with FAM fluorescent group as the conjugate, using gold nanoparticles as the fluorescence dynamic quenching source, a fluorescence sensor was fabricated through the signal-on method for the micro-detection of kanamycin. The nucleic acid chimera is connected to the fluorophore, and the gold nanoparticles are used as the fluorescence dynamic quenching source under actual conditions. The detection limit of kanamycin is 0.1 pM, and the detection range is 0.1 pM to 0.1 μM. This biosensor works satisfactorily in complex samples with no impurities, which gives this method an obvious advantage over other analytical methods. In addition, the mechanism of action between gold nanoparticles/FAM–aptamer/kanamycin is discussed and studied in depth here. It provides a more thorough analysis and more application possibilities for fluorescence-aptamer biosensing.
Introduction
Since the advent of antibiotics, mortality rates due to microbial infections have dropped dramatically, saving countless lives throughout human history. However, the misuse of antibiotics can lead to the emergence of bacterial resistance, resulting in an increase in the use of antibiotics, which in turn can lead to drug resistance and reduce the options available for antibiotics in the treatment of some diseases.1 In addition, individuals may be allergic to some antibiotics, which may cause ototoxicity and liver toxicity and inappropriate use of antibiotics can be life-threatening. In addition, the discharge of wastewater containing antibiotics, whether or not it has been treated, can contaminate surface water, groundwater and agricultural soil.2–4 Kanamycin (kana) is an aminoglycoside antibiotic that is effective in treating diseases caused by a variety of germs and bacteria, including E. coli, Proteus, and Staphylococcus infections.5 Kanamycin is used as one of the commonly used antibiotics in the livestock and food processing industries, dairy farms, chicken farms and fish ponds.6,7 To combat the high pressure and unsanitary conditions common in industrial animal agriculture, meat producers feed their animals antibiotics, including kanamycin, to promote growth or prevent disease. Therefore, it is urgent to test for antibiotics in water and livestock.Numerous efforts have been made to develop analytical techniques for trace amounts antibiotics detection, such as high-performance liquid chromatography (HPLC), mass spectrum (MS) and capillary electrophoresis (CE) with low detection limit and high accuracy and precision.8–10 There are also many new methods that have emerged with the development, such as colorimetry, fluorescence, electrochemistry, chemiluminescence, electrochemiluminescence, photoelectrochemistry etc.11–19
Fluorescence analysis is characterized by high sensitivity and selectivity. It plays an important role in the preparation of chemical and biological sensors for the detection and analysis of heavy metals, drugs, and biomarkers.20–22 The fluorescence method has been used as a common method for the determination of tetracycline due to its advantages of high sensitivity, selectivity and easy observation of the signal. El Hassani N. E. et al.23 fabricated a fluorescent sensor based on bio micro-electromechanical system (Bio-MEMS) to detect tetracycline, Wang et al.24 reported a novel bimetallic cerium/copper-based metal organic framework as a scaffold for electrochemical aptasensors for ultrasensitive detection of trace tobramycin in real samples, such as milk and human serum, and both has excellent detection range and detection limits.
Aptamer is a synthetic oligonucleotide sequence. It binds to target molecules with a high degree of specificity and activity. Compared to antibodies or receptor proteins, aptamer is low-cost, easy to synthesize and mix, has good thermal stability, lacks immunogenicity and is non-toxic, making it widely used in biosensors.25 Deng et al.26 based on fluorescence resonance energy transfer (FRET) to detect kanamycin with high sensitivity and selectivity by triggering a polymerase-catalysed amplification (PCA) process of aptamer to autonomously generate a single-strand DNA. Geng et al.27 achieved fluorescent sensing of kanamycin by fluorescent aptamer functionalized molecularly imprinted polymer (MIP) using dual recognition of the aptamer and imprinted cavity.
Gold nanoparticles (Au NPs) are commonly used for chemical and biological sensing due to their aggregation color change, fluorescence bursting ability and unique high surface area and catalytic and optical properties.28 They can be used as probes for stable and rapid adsorption of polysaccharides, proteins, peptides, antigens, hormones, nucleic acids and other biomolecules. Fluorescent sensors have been widely used in antibiotic detection by exploiting the fluorescence burst characteristics of Au NPs.29–32
In this report, we made a fluorescence sensor by signal-on method for the trace detection of kanamycin. This sensor uses an aptamer with a FAM fluorescent group as a specific binding carrier, and uses Au NPs as a fluorescence dynamic quenching source. The proposed method has good selectivity and high sensitivity, and it was applied to the determination of kanamycin in water and milk with satisfactory results.
Experimental
Chemicals and materials
Kanamycin sulfate, tetracycline hydrochloride, streptomycin, chloramphenicol, gentamicin sulfate were purchased from Adamas Reagent, Ltd. Streptomycin sulfate was purchased from Tokyo Chemical Industry Co., Ltd. The above antibiotics were made into a solution with a concentration of 0.01 M and prepared with ultrapure water kept at 4 °C. The aptamer (FAM–apt, 5′-FAM-TGG GGG TTG AGG CTA AGC CGA-3′) was synthesized at Sangon Biotech (Shanghai) Co., Ltd. Phosphate buffer saline (PBS) and TE (Tris–EDTA) buffer as Oligonucleotide stock solution were purchased from Sangon Biotech (Shanghai) Co., Ltd. and kept at 4 °C. The HNO3 and HCl needed for glassware cleaning are purchased from Yonghua Chemical Co., Ltd., and HNO3 and HCl are prepared in a ratio of 1![[thin space (1/6-em)]](https://www.rsc.org/images/entities/char_2009.gif) :
:![[thin space (1/6-em)]](https://www.rsc.org/images/entities/char_2009.gif) 3. All chemical reagents used are analytical reagents, and all solutions are prepared in autoclaved double distilled deionized water.
3. All chemical reagents used are analytical reagents, and all solutions are prepared in autoclaved double distilled deionized water.
Apparatus
Fluorescence spectra were tested by HORIBA Fluoromax-4 spectrofluorometer. The model of the centrifuge was Eppendorf Centrifuge 5804R. The equipment for the UV-visible (UV-vis) absorption spectra was a Thermo scientific GENESYS 180 UV-visible spectrophotometer. The pH meter 206 was supplied by TESTO. Transmission electron microscopy (TEM) was the model number JEM-2100F from Nippon Electronics Co. The model of X-ray photoelectron spectroscopy (XPS) equipment was the *1/AXIS Ultra-DLD manufactured by Shimadzu-Kratos Corporation, Japan. The equipment for the Circular Dichroism (CD) spectrometer was a J-815 manufactured by JASOC, Japan. The Photon Correlation Spectroscopy was manufactured by Malvern, UK, model */Zetasizer Nano S.Synthesis of Au NPs
All glassware should be thoroughly washed and soaked in aqua regia overnight, then rinsed with ultrapure water, and then rinsed with ethanol before use to dry it for later use in the synthesis operation. Under magnetic stirring, 0.75 mL 1.0% trisodium citrate was quickly added to 50 mL 0.01% chloroauric acid (HAuCl4) boiling solution. The color of the solution changed from light yellow to blue-black, and finally to purple-red. Continue stirring and boiling for 10 minutes, then remove the heating mantle and continue magnetic stirring for 15 minutes. After cooling to room temperature with continuous stirring, the solution was passed through a 0.22 μm filter membrane, and then stored in refrigerator at 4 °C before use. The Au NPs solution was characterized by TEM and ultraviolet-visible absorption spectroscopy.Fabrication of sensor for kanamycin detection
First, we add 10 μL FAM–aptamer (5 μM), 50 μL AuNPs solution (3 nM), 10 μL of 0.1 M PBS buffer (pH 8.0), and 20 μL ultrapure water to a 100 μL centrifuge tube. The mixture was vortexed and then incubated for 5 minutes at room temperature. Next, 10 μL of kanamycin solution was added, vortexed, and incubated at 4 °C for 45 minutes. Use a pipette to move the mixed solution to a quartz cuvette to measure the fluorescence spectrum. The whole experiment process was carried out at 4 °C.Real samples pretreatment and detection
The lake water samples which obtained from Zhongshan Lake and Suzhou River (Shanghai, China) were left to stand for 48 h. Then the supernatant was taken as the sample to be measured.The milk used in the real sample experiment was purchased from a local supermarket. First, take 2 mL of milk in a centrifuge tube and add 3 mL of acetonitrile, and sonicate the mixture for 2 minutes. Then it was centrifuged for 5 minutes at 2800 rpm. Take the supernatant liquid for rotary evaporation, and then dissolve the obtained powder in 1 mL of deionized (DI) water. 1 mL of acetone was added to it, the mixed solution was sonicated for 2 minutes and then subjected to rotary evaporation, and then dissolved in PBS with a pH of 8.0. Store the processed milk sample at 4 °C for later use.
Results and discussion
Design strategy and analytical principle
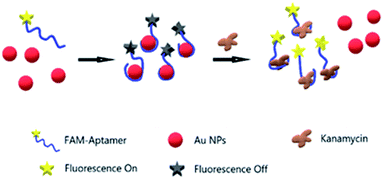
This aptamer and method were derived from a report by Song et al.33 The experimental strategy of the fabricated Au NPs aptasensor is shown in Fig. 1. First, when Au NPs meet FAM–apt in a solution environment, aptamer single chains are adsorbed on the surface of Au NPs, and the attached FAM groups are quenched by fluorescence due to the FRET mechanism. When the fluorescence spectrum of AuNPs overlaps with the excitation spectrum of FAM groups, the interaction between the quencher and the excited state molecules of the luminescent material leads to fluorescence burst, that is, the fluorescence energy resonance transfer occurs. The degree of FRET is closely related to the spatial distance of the donor and acceptor molecules, generally 5–10 nm when FRET can occur; as the distance increases, FRET is significantly weakened. The efficiency of FRET between the donor and the acceptor can be reflected by E = 1/1 + (R/R0)exp![[thin space (1/6-em)]](https://www.rsc.org/images/entities/char_2009.gif) 6, where R represents the distance between the donor and the acceptor, and R0 represents the Fourier radius, which depends on the degree of overlap between the donor emission spectrum and the acceptor excitation spectrum, as well as the relative orientation of the dipoles of the donor and the acceptor energy transfer. With the addition of a trace amount of kanamycin at this time, aptamer desorbs from Au NPs and binds specifically to kanamycin. The FAM group regains fluorescence due to detachment from the surface of Au. We will further interpret the experimental principles by circular dichroism (CD) and X-ray photoelectron spectroscopy (XPS). The buffer is added so as to provide a certain salt concentration to the AuNPs. As more and more DNA is adsorbed on the surface of AuNPs, DNA is electrically charged and can cause DNA in solution to no longer adsorb to the surface of AuNPs. Providing a certain salt concentration can shield this electrostatic repulsion and allow more single-stranded DNA to adsorb to its surface.
6, where R represents the distance between the donor and the acceptor, and R0 represents the Fourier radius, which depends on the degree of overlap between the donor emission spectrum and the acceptor excitation spectrum, as well as the relative orientation of the dipoles of the donor and the acceptor energy transfer. With the addition of a trace amount of kanamycin at this time, aptamer desorbs from Au NPs and binds specifically to kanamycin. The FAM group regains fluorescence due to detachment from the surface of Au. We will further interpret the experimental principles by circular dichroism (CD) and X-ray photoelectron spectroscopy (XPS). The buffer is added so as to provide a certain salt concentration to the AuNPs. As more and more DNA is adsorbed on the surface of AuNPs, DNA is electrically charged and can cause DNA in solution to no longer adsorb to the surface of AuNPs. Providing a certain salt concentration can shield this electrostatic repulsion and allow more single-stranded DNA to adsorb to its surface.
CD analysis of the fabricated aptasensor
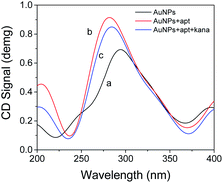
CD can make the plane-polarized light propagating through the material become elliptically polarized light, and this elliptically polarized light can only be observed at the wavelength of absorption. Optically active materials have different absorption rates for left or right circularly polarized light. The difference in light absorption is called the circular dichroism of the material, which is a useful tool for monitoring DNA conformational changes. Fig. 2 shows the CD spectra of AuNPs, AuNPs + apt, AuNPs + apt + kana in three different states in the experiment. Negative peaks appear in each of the different states around 230 nm and 370 nm, and a higher positive peak appears around 270 nm, which is consistent with the state of B-DNA.34 Only AuNPs have the lowest positive peak value. After apt treatment, the peak value changes and causes the CD spectrum to change. It can be seen that after adding apt, the curvature of the negative peak increases, and the positive peak increases significantly due to the accumulation of DNA bases. After kanamycin was added, the peak value dropped, indicating that the apt secondary structure change based on the specific binding process of π–π* and n/π* transitions, which caused the change of CD signal. Since the main effect of light-sensitive is the electric field vector, plane polarized light can be decomposed into two circularly polarized light with the same amplitude and frequency and opposite rotation direction. The electric vector rotating in the clockwise direction is called right circularly polarized light, which rotates in the counterclockwise direction is called left circularly polarized light. After the addition of kanamycin, the two beams of polarized light with opposite amplitude and frequency as well as rotation direction were shifted due to the binding of kanamycin to the corresponding nucleic acid aptamer, resulting in a decrease in the positive peak, which proved that the aptamer detached from the gold nanoparticles causing conformational changes. Therefore, it can be concluded that the mechanism of the combination of apt and kanamycin in the AuNPs aqueous solution system proves the feasibility of the detection method.XPS analysis of the fabricated aptasensor
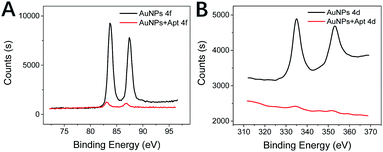
To further verify the feasibility of the experimental principle, XPS was used to analyze the experimental mechanism. The XPS for each step of the experiment is shown in Fig. 3. The Au NPs are in a homogeneously dispersed state in an independently present state. In this state, the solution is predominantly Au0. Since a short ssDNA (typically less than 30 bases) can adsorb rapidly, long ssDNA and dsDNA cannot. So, when FAM–apt is near the surface of Au NPs, FAM–apt readily adsorbs to the surface of Au NPs.35 This adsorption is associated with a redistribution of charge, and this redistribution causes the surface to exhibit a more negative charge. During this process, the interaction between Au NPs and the outermost electron of aptamer decreases the total energy in order to reduce the entropy, resulting in a small leftward shift in the binding energy of the 4d/4f electron layer in XPS. The peak fluorescence emission spectrum of the FAM group was 512 nm after attachment of the FAM group to the aptamer, and the peak UV absorption spectrum of the Au NPs was 523 nm, and the energy levels of the two outermost electrons were similar. After adsorption of the ligand to Au NPs, the connected FAM fluorophores are close to the surface of gold together. When the fluorophore is attached to the Au NPs, it results in fluorescence quenching by FRET.Since the aminoglycoside kanamycin compounds with multiple positive charges, they are highly pliable, which can facilitate their entry into the pockets of predominantly negatively charged aptamers. Binding of kanamycin in the inner loop causes a shift in the position of the two adenines, which recognizes codon and anticodon interactions. At this point, the aptamer undergoes a conformational change and forms a complex with kanamycin, thus binding firmly together. At the same time, because the FAM group on the aptamer detaches from the surface of the gold nanoparticles, the interaction between the outermost layer of electrons and the 4f and 4d layers of gold nanoparticles disappears. The energy level between HOMO and LUMO shrinks again, and the required fluorescence energy becomes less, so that fluorescence resumes.
Characterization of gold nanoparticles
TEM characterization of Au NPs is shown in Fig. 4A and B. The size of the synthesized Au NPs is 15–20 nm. Through TEM, it can be seen that the lattice fringe spacing of Au NPs is 20 nm, which matches the d value of Au (111). The UV-vis absorption spectra determine that the wavelength peak is at 523 nm (Fig. 4C). Through dynamic light scattering (DLS) analysis (Fig. 4D), the Z-average diameter is 126.3 nm. DLS measures the particle size of the entire dispersion, which is statistically significant; not only that, the particle size measured by DLS is mainly the hydration radius of the particles, which is often protected by a layer of sol, otherwise it is easy to agglomerate. This is the reason why the particle size measured by DLS is not consistent with the results measured by TEM. In addition, the zeta potential of AuNPs monitored by DLS is −23.37 mV, confirming that Au NPs have a negative charge. The concentration of the gold nanoparticle aqueous solution is calculated by the formula to be about 3 nM according to Lambert–Beer's law.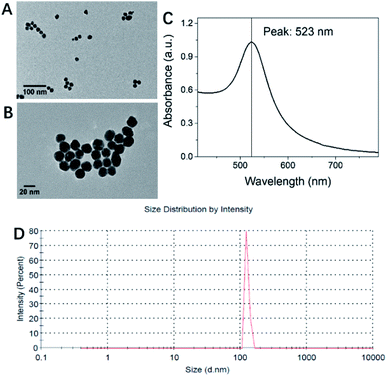 | ||
| Fig. 4 Characterization of gold nanoparticles. (A and B) TEM, (C) UV-vis absorption spectra and (D) dynamic light scattering (DLS) analysis. | ||
Optimization of detection conditions
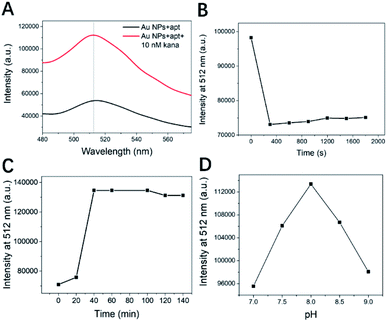
First, we measured the UV-vis absorption spectra in the two states by adding no kanamycin and 10 nM kanamycin, as shown in Fig. 5A. The addition of kanamycin had a significant fluorescence recovery and was able to identify the peak wavelength of the fluorescence emission spectra of the FAM fluorophore attached to the aptamer as 512 nm. This will also serve as a benchmark for the selection of the fluorescence peak in subsequent experiments.Fluorescence burst occurs when the fluorophore is attached to Au NPs, resulting in FRET from the organic donor to the AuNPs acceptor.36 The experiments required kanamycin detection in a state where the fluorescence was fully burst and stable, so we optimized the experiment and the incubation time for the addition of FAM–apt, as shown in Fig. 5B. Within the first five minutes, the fluorescence burst on the aptamer did not recover after rapid adsorption on bare gold nanoparticles. In order to get better cost effectiveness, we chose an incubation time of 5 min for Au NPs to undergo full bursting with FAM–apt.
Not only that, we optimized the kanamycin incubation time, as shown in Fig. 5C. At a wavelength of 512 nm and a concentration of 10 nM kanamycin, the fluorescence gradually recovered with time. The aptamer detaches from the surface of the gold nanoparticles due to its strong specific matching to kanamycin and forms a secondary hairpin structure to lock the kanamycin molecules. The maximum fluorescence in the recovered state can be reached in about 35 minutes, and the fluorescence saturation can be reached. A duration of 40 minutes was chosen as the optimized kanamycin incubation time in order to balance the accuracy and efficiency of the experiments.
The optimization of the pH value of the PBS solution is shown in Fig. 5D. From pH 7.0 to 9.0, the fluorescence intensity of the same concentration of kanamycin was significantly enhanced, but continuing to increase the pH of PBS led to a decrease in fluorescence instead. The reason may be that the pH of the solution affects the folded state of the aptamer, and the different distance from the surface of the gold nanoparticles has an effect on the intermolecular interaction force. This can lead to differences in FRET, which directly affects the fluorescence response. Finally, we chose a pH of 8.0 as the optimized experimental conditions.
Kanamycin detection with fluorescent aptasensor
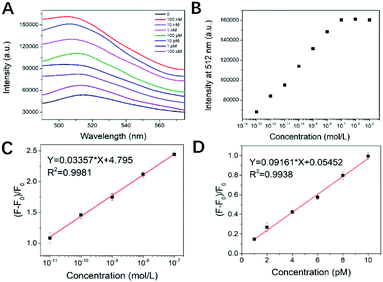
To evaluate the detection range and sensitivity of the platform, we analyzed different concentrations of kanamycin under optimized conditions. The fluorescence gradient test of kanamycin was performed to investigate the detection range of this aptasensor.The fluorescence emission spectra at different kanamycin concentrations in the kanamycin state are shown in Fig. 6A. After adding different concentrations of kanamycin, the specific binding ability of aptamer to kanamycin molecules is much greater than the intermolecular force of gold nanoparticles. As a result, the adsorption from the surface layer of Au NPs is converted into chemical binding to kanamycin, and the secondary structure changes. The binding quantity is positively correlated with the concentration of kanamycin at 0.1 pM to 1 nM. The large concentration gradient fluorescence test for kanamycin is shown in Fig. 6B. Two phases appear in the figure, one is the fluorescence homogenization phase and the other is the fluorescence saturation phase, which is the concentration of 0.1 μM. The fluorescence linearity of kanamycin A concentration between 10 pM to 100 nM is shown in Fig. 6C. The experimental data were calculated to be in good agreement with the linear model and the fluorescence signal was obvious. In addition, we also tested the gradient of 1–10 pM kanamycin concentrations, as shown in Fig. 6D. The results obtained a good fluorescence linearity in the small concentration gradient region, indicating that the sensor is still sensitive and accurate at very low kanamycin concentrations.
Application in real samples analyses
To test the efficiency of the fluorescent aptasensor for trace kanamycin detection, we analyzed water from Zhongshan Park Lake, Suzhou River and locally purchased milk, which was spiked (10−8, 10−9, and 10−10 M of kanamycin).Application in water samples analyses
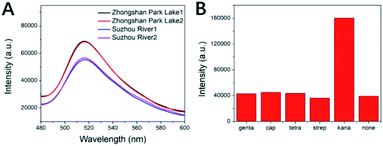
The water of Zhongshan Park Lake and Suzhou River were tested by the same experimental method and the results obtained are shown in Fig. 7A. Through the fluorescence intensity and the linear gradient already obtained, the concentration of kanamycin in the water of Zhongshan Park Lake and Suzhou River is 6.52 × 10⁻¹³ M and 1.47 × 10⁻¹⁴ M. The water quality test results for Suzhou River were obtained based on the left extension of a linear plot of small concentration gradients. In addition, the method has good repeatability for measuring the real water samples.Application in milk samples analyses
We also used the proposed experimental method real milk samples for the detection of kana and determined the recovery of kana in milk samples by standard addition method. Small amounts of kana were added (10−8, 10−9, and 10−10 M, respectively). As shown in Table 1, the acceptable recoveries of kana ranged from 96% to 103%, which indicated that the accuracy of the method was high. In addition, due to the specific recognition of the target by the aptamer probe and the fluorescence detection platform, the experiments are highly reproducible. The above results clearly indicate that this method can be applied to the detection of kana in real samples.| Sample | Spiked (mol L−1) | Found (mol L−1) | Recovery (%) (100% ± SD, n = 3) |
|---|---|---|---|
| 1 | 1 × 10⁻⁸ | 9.65 × 10⁻⁹ | 96% ± 1.4 |
| 2 | 1 × 10⁻⁹ | 1.01 × 10⁻⁹ | 101% ± 1.3 |
| 3 | 1 × 10⁻¹⁰ | 1.03 × 10⁻¹⁰ | 103% ± 2.4 |
Specificity, repeatability and stability
In order to study the specificity of this fluorescent aptasensor, we used the same signal transduction strategy to measure the FL signal intensity of several other antibiotics, such as tetracycline hydrochloride, streptomycin, chloramphenicol, and gentamicin sulfate. The fluorescence signal response to the target antibiotics of kana was less pronounced than that of the blank control for other possible interferers such as other antibiotics (Fig. 7B). These results indicate that the aptamer sensor has good specificity for kanamycin analytes, and the interference with other antibiotics is negligible.An aptasensor prepared by the same method was used for repeated measurements of the fluorescence intensity of kanamycin. These results show that this sensor has good repeatability and stability. Compared with other antibiotic detection sensors of the same type (Table 2), the performance is also excellent, both in detection range and detection limit.
| Method | Linear dynamic range | Limit of detection | Ref. |
|---|---|---|---|
| Electrochemiluminescence | 0.86 nM–0.17 μM | 0.1 nM | 37 |
| Electrochemical | 10 pM–1 μM | 5.24 pM | 38 |
| Fluorescent | 0.04–0.24 μM | 18 nM | 39 |
| Colorimetric | 1–300 nM | 0.05 nM | 40 |
| Electrochemiluminescence | 0.1 pM–1 μM | 0.17 pM | 41 |
| Surface-enhanced Raman scattering | 1–100 nM | 0.75 nM | 42 |
| Fluorescent | 1 pM–0.1 μM | 0.1 pM | This study |
The fluorescence detection method detects the fluorescence intensity superimposed on a very small background. Due to the low signal-to-noise ratio, it is very suitable for trace antibiotic content. In addition, the structure of the FL-Aptasensor device is very simple and easy to handle, which reduces the error caused by complicated steps. The experimental electron hopping and energy level changes, the conformational changes of the aptamer secondary structure and the interaction with kanamycin and codons and anticodons enhance the specificity, which makes this sensor have a lower detection limit than other methods.
Conclusion
In conclusion, this work demonstrates an aptamer-based fluorescence sensing method for the detection of kanamycin and achieves a wide detection range and low detection limit of 0.1 pM. The fluorescent aptasensor was successfully used to detect kanamycin in real water samples and applied to the determination of kanamycin in milk samples, and the limits of detection were lower than the EU limit (257 nM) and the Chinese limit (343 nM). On this basis, we analyzed in depth the mechanism of action of fluorometric aptasensor detection of kanamycin by a series of characterization tools such as TEM, UV-vis spectroscopy, DLS, CD, and XPS. The method is simple and convenient, and can be performed in homogenous aqueous solution. In addition, the assay can be extended to other antibiotics, only by changing the relevant aptamer on the probe. Finally, due to the high specificity between the aptamer and kanamycin, this aptamer-based fluorescence method has good selectivity for kanamycin relative to other common antibiotics, and is therefore expected to be useful for the rapid detection of kanamycin in real samples.Conflicts of interest
There are no conflicts to declare.Acknowledgements
We gratefully acknowledge the National Natural Science Foundation of China (NNSFC 61804158), Shanghai Sailing Program (18YF1428300), the Program of Science and Technology Commission of Shanghai Municipality (17JC1401001) and STS program (KFJ-STS-ZDTP-061), and Chenguang Scholar of Shanghai Municipal Education Commission (No. 18CG67).Notes and references
- A. Mehlhorn, P. Rahimi and Y. Joseph, Biosensors, 2018, 8, 54–116 CrossRef CAS PubMed.
- S. U. Akki and C. J. Werth, Environ. Sci. Technol., 2018, 52, 8989–9007 CrossRef CAS PubMed.
- L. Y. Lan, Y. Yao, J. F. Ping and Y. B. Ying, ACS Appl. Mater. Interfaces, 2017, 9, 23287–23301 CrossRef CAS PubMed.
- Y. N. Chen, Y. W. Wang, L. Q. Liu, X. L. Wu, L. G. Xu, H. Kuang, A. K. Li and C. L. Xu, Nanoscale, 2015, 7, 16381–16388 RSC.
- F. Q. Li, Z. G. Yu, X. D. Han and R. Y. Lai, Anal. Chim. Acta, 2019, 1051, 1–23 CrossRef CAS PubMed.
- K. Zhang, N. Gan, F. T. Hu, X. X. Chen, T. H. Li and J. X. Cao, Microchim. Acta, 2018, 185, 181–190 CrossRef PubMed.
- C. K. Wang, D. Chen, Q. Q. Wang and R. Tan, Biosens. Bioelectron., 2017, 91, 262–267 CrossRef CAS PubMed.
- S. Y. Ma, S. X. Yang, Z. H. Song, J. H. Li, Q. C. Shi, H. Y. You, H. T. Liu, M. Lv and L. X. Chen, Analyst, 2020, 145, 1825–1832 RSC.
- S. Suraritdechachai, C. Charoenpakdee, I. Young, S. Maher, T. Vilaivan and T. Praneenararat, J. Agric. Food Chem., 2019, 67, 3055–3061 CrossRef CAS PubMed.
- Y. X. Hu, L. Y. Su, S. Wang, Z. Y. Guo, Y. F. Hu and H. Z. Xie, Microchim. Acta, 2019, 186, 512–522 CrossRef PubMed.
- L. Y. He, Z. P. Shen, Y. T. Cao, T. H. Li, D. Z. Wu, Y. R. Dong and N. Gan, Analyst, 2019, 144, 2755–2764 RSC.
- J. Zeng, N. Gan, K. Zhang, L. Y. He, J. Y. Lin, F. T. Hu and Y. T. Cao, Talanta, 2019, 199, 491–498 CrossRef CAS PubMed.
- B. S. He and S. S. Yan, Microchim. Acta, 2019, 186, 77–84 CrossRef PubMed.
- P. Liu, C. Li, R. X. Zhang, Q. Tang, J. Wei, Y. Lu and P. P. Shen, Biosens. Bioelectron., 2019, 126, 543–550 CrossRef CAS PubMed.
- X. Zhang, T. Yan, T. T. Wu, Y. X. Feng, M. Sun, L. G. Yan, B. Du and Q. Wei, Biosens. Bioelectron., 2019, 135, 88–94 CrossRef CAS PubMed.
- X. Q. Liu, T. Wang, Y. Lu, W. J. Wang, Z. P. Zhou and Y. S. Yan, Sens. Actuators, B, 2019, 289, 242–251 CrossRef CAS.
- F. Hong, X. T. Lin, Y. X. Wu, Y. R. Dong, Y. T. Cao, F. T. Hu and N. Gan, Microchim. Acta, 2019, 186, 150–158 CrossRef PubMed.
- E. Goux, E. Dausse, V. Guieu, L. Azema, G. Durand, M. Henry, L. Choisnard, J. J. Toulme, C. Ravelet and E. Peyrin, Nanoscale, 2017, 9, 4048–4052 RSC.
- H. B. Li, Y. L. Li, J. Li, F. Yang, L. Q. Xu, W. Wang, X. X. Yao and Y. D. Yin, Anal. Chem., 2020, 92, 4094–4100 CrossRef PubMed.
- X. H. Yin, T. Hou, B. Z. Huang, L. M. Yang and F. Li, Chem. Commun., 2019, 55, 13705–13708 RSC.
- H. Y. Li, H. Y. Lin, W. X. Lv, P. P. Gai and F. Li, Biosens. Bioelectron., 2020, 165, 112336 CrossRef CAS PubMed.
- H. Y. Li, C. F. Wang, T. Hou and F. Li, Anal. Chem., 2017, 89, 9100–9107 CrossRef CAS PubMed.
- N. E. El Hassani, A. Baraket, S. Boudjaoui, E. T. T. Neto, J. Bausells, N. El Bari, B. Bouchikhi, A. Elaissari, A. Errachid and N. Zine, Biosens. Bioelectron., 2019, 130, 330–337 CrossRef PubMed.
- S. J. Wang, Z. Z. Li, F. H. Duan, B. Hu, L. H. He, M. H. Wang, N. Zhou, Q. J. Jia and Z. H. Zhang, Anal. Chim. Acta, 2019, 1047, 150–162 CrossRef CAS PubMed.
- Y. Zhu, P. Chandra, K. M. Song, C. Ban and Y. B. Shim, Biosens. Bioelectron., 2012, 36, 29–34 CrossRef CAS PubMed.
- J. K. Deng, Y. Q. Liu, X. D. Lin, Y. L. Lyu, P. C. Qian and S. Wang, Sens. Actuators, B, 2018, 273, 1495–1500 CrossRef CAS.
- Y. Y. Geng, M. L. Guo, J. A. Tan, S. Y. Huang, Y. W. Tang, L. Tan and Y. Liang, Sens. Actuators, B, 2018, 268, 47–54 CrossRef CAS.
- A. Samanta and I. L. Medintz, Nanoscale, 2016, 8, 9037–9095 RSC.
- W. Huang, H. Y. Zhang, G. S. Lai, S. Liu, B. Li and A. M. Yu, Food Chem., 2019, 270, 287–292 CrossRef CAS PubMed.
- S. Pilehvar, C. Reinemann, F. Bottari, E. Vanderleyden, S. Van Vlierberghe, R. Blust, B. Strehlitz and K. De Wael, Sens. Actuators, B, 2017, 240, 1024–1035 CrossRef CAS.
- M. Ramezani, N. M. Danesh, P. Lavaee, K. Abnous and S. M. Taghdisi, Sens. Actuators, B, 2016, 222, 1–7 CrossRef CAS.
- Y. Y. Xu, C. H. Lu, Y. Y. Sun, Y. G. Shao, Y. Cai, Y. S. Zhang, J. F. Miao and P. Miao, Microchim. Acta, 2018, 185, 548–556 CrossRef PubMed.
- K.-M. Song, M. Cho, H. Jo, K. Min, S. H. Jeon, T. Kim, M. S. Han, J. K. Ku and C. Ban, Anal. Biochem., 2011, 415, 175–181 CrossRef CAS PubMed.
- Y. G. Wu, S. S. Zhan, H. B. Xing, L. He, L. R. Xu and P. Zhou, Nanoscale, 2012, 4, 6841–6849 RSC.
- T. K. Sharma, R. Ramanathan, P. Weerathunge, M. Mohammadtaheri, H. K. Daima, R. Shukla and V. Bansal, Chem. Commun., 2014, 50, 15856–15859 RSC.
- Y. X. Qiao, J. Deng, Y. Jin, G. Z. Chen and L. Wang, Analyst, 2012, 137, 1663–1668 RSC.
- S. T. Cheng, H. M. Liu, H. Zhang, G. L. Chu, Y. M. Guo and X. Sun, Sens. Actuators, B, 2020, 304, 0925–4005 Search PubMed.
- J. Yu, W. X. Tang, F. Wang, F. Zhang, Q. J. Wang and P. G. He, Sens. Actuators, B, 2020, 311, 0925–4005 CrossRef.
- J. L. Wang, T. T. Lu, Y. Hu, X. L. Wang and Y. G. Wu, Spectrochim. Acta, Part A, 2020, 226, 1386–1425 Search PubMed.
- O. H. Shayesteh and A. G. Khosroshahi, Anal. Methods, 2020, 12, 1858–1867 RSC.
- D. F. Feng, X. C. Tan, Y. Y. Wu, C. H. Ai, Y. N. Luo, Q. Y. Chen and H. Y. Han, Biosens. Bioelectron., 2019, 129, 100–106 CrossRef CAS PubMed.
- A. H. Nguyen, X. Ma, H. G. Park and S. J. Sim, Sens. Actuators, B, 2019, 282, 765–773 CrossRef CAS.
| This journal is © The Royal Society of Chemistry 2021 |

