DOI:
10.1039/D0RA10495G
(Paper)
RSC Adv., 2021,
11, 7946-7953
Strategies towards simpler configuration and higher peak capacity with comprehensive multidimensional gas chromatography†
Received
14th December 2020
, Accepted 7th February 2021
First published on 18th February 2021
Abstract
Experimental and data analysis approaches in multidimensional gas chromatography (MDGC) comprising comprehensive multiple heart-cut (H/C) and comprehensive two dimensional GC (GC × GC) were developed with an example application illustrated for analysis of a technical glycol precursor sample. The GC × GC system employed a long 1D (30 m) and a short 2D (5 m) column with a flow modulator and a Deans switch (DS) as a splitter; meanwhile. The H/C system was applied solely as a DS located between long 1D (30 m) and 2D (60 m) columns without use of cryogenic trapping devices. The effects of injection time and 2D column flow in GC × GC and the impacts of H/C window and number of injections (total analysis time) in H/C analysis were investigated. The analysis performance for each condition was evaluated according to peak capacity and number of separated compounds. The continuum between the two techniques was then established via the relationship between analysis time and analysis performance. The separation performances were improved with longer analysis time so that the suitable condition was selected within this compromise. Under the selected conditions, volatile compounds in the technical glycol precursor sample were identified according to the match between the experimental MS spectra and first dimensional retention indices (1I) with that from the NIST2014 database and literature. An hour analysis with GC × GC resulted in a total peak capacity of 798, number of separated peaks of 61 and average MS match score of 887 ± 35; meanwhile, the corresponding numbers were improved to be 9198, 107 and 898 ± 24, respectively, with the 25 h comprehensive H/C analysis.
1 Introduction
Multidimensional gas chromatography (MDGC) is a high performance separation technique with enhanced peak capacity which has been reported for analysis of ‘complex’ samples such as petroleum, food, beverages, pharmaceutical and illicit drugs, and the environment.1–4 Hyphenation with mass spectrometry provides individual molecular-based information of volatile analytes enabling high confidence identification of several hundred compounds within a single analysis.1–3,5,6 In general, MDGC employs two columns with different (ideally orthogonal) selectivities7 which are connected sequentially via a device offering an effective heart-cut (H/C) or modulation process.8,9 Compared with one dimensional (1D) GC, MDGC provides improved separation resolution and analyte peak capacity, reduced chemical background and improved detection limit. Due to the capability to analyse complex sample, sample clean-up steps such as liquid or solid phase extraction can also be reduced or eliminated avoiding the problem of sample loss during sample preparation which is important especially when sample amount is limited.5
Comprehensive H/C MDGC and comprehensive 2DGC (GC × GC) can be classified as a subclass of MDGC and are especially useful for untargeted analysis.10 In these approaches, a sequential sampling strategy is applied which progressively shifts the H/C or modulation over the whole sample zone obtained from 1D prior to 2D separation.3,10 The full comprehensive technique is conventionally performed using a single injection and it is well known as GC × GC. Multiple injections and multiple H/C strategies are also applied in order to increase separation performance by use of a longer 2D column which is called comprehensive H/C MDGC. With the expense of longer analysis time in the comprehensive H/C, the theoretical number of separated compounds (in a mixture of 681 model compounds with different functionalities) under the optimized conditions can be improved to be ∼2 times greater than that obtained with GC × GC.3 A compromise between time and separation performance should thus be made in each analysis. Whilst GC × GC approaches are well developed and applied, comprehensive H/C analysis has not been widely applied due to the complicated experimental setup, e.g. use of both a Deans switch (DS) and a cryogenic trapping device (or cryogenic modulator), of these approaches and the difficulty in data processing.11–13 The cryogenic effect allows analyte pulse trapping with the subsequent release onto a 2D column with a narrow band of the pulse enhancing 2D separation. However, cryogenic approach involves additional devices, such as trapping channel and switching valve for automated on/off operation, cryogen consumption and system maintenance. In order to transfer a narrow H/C band without cryogenic device, H/C window should be significantly narrower than 2D separation time.14 To this end, simulation approach showing the compromise between separation time (H/C window) and analysis performance (number of separated peaks) has been proposed providing high peak capacity analysis of the petrochemical sample within a reasonable analysis time. However, experimental investigation of the concept as well as approach to generate a contour plot has not been reported. In addition, investigation on its advantages over the conventional GC × GC and further application of this technique are still a challenge.
In this study, cryogenic free approaches in compressive H/C techniques using a DS without a cryogenic device were developed and compared with the conventional GC × GC approach with flow modulation for analysis of a technical glycol precursor sample. The continuum between the two techniques was experimentally investigated in detail. Useful data presentation method was proposed. Effects of experimental conditions were then investigated. The selected comprehensive H/C and GC × GC results were evaluated, compared and discussed in terms of peak capacity and number of separated compounds. Relationship between the analysis time and separation performance was also established. The profile of volatiles in the technical glycol precursor sample was also reported.
2 Materials and chemicals
The authentic standard compounds were purchased from Merck (Darmstadt, Germany); Alfa Aesar, TCI and Sigma-Aldrich (St. Louis, MO).
2.1 Instrumental
An Agilent 7890A gas chromatograph hyphenated with an Agilent 5975C QMS (Agilent technologies Inc., US) was applied in this study. The split injection (with the ratio of 12 to 1) was performed at 250 °C. Injection volume was set at 1 μL for injection of the alkane mixture (100 mg L−1 in hexane) and the sample.
2.1.1 GC × GC system. The GC × GC column set was a nonpolar DB-1MS (60 m × 0.25 mm inner diameter (I.D.) × 0.25 μm; J&W Scientific, US) as the first dimension (1D) column with the same polar SUPELCOWAX 10 column (5 m × 0.25 mm I.D. × 0.1 μm; J&W Scientific, USA) as the 2D column. The two columns were connected through a flow modulator (Agilent technologies Inc.). As shown in Fig. 1, the 2D column end was further connected to the DS which behaved as a splitter via two restrictors to flame ionization detector (FID) and MS. The restrictor dimensions were 2.25 m × 0.18 I.D. and 0.75 m × 0.18 I.D. towards MS and FID, respectively. This is performed in order to reduce flow to MS. A modulation period (PM) of 2, 4 or 6 s was applied. Helium was used as carrier gas with a flow rate of 0.8 mL min−1 applied as 1D column flow. Different injection time of the flow modulator (0.15, 0.30, 0.60, 1.20 and 2.40 s) and 2D column flow (7, 14 and 21 mL min−1) were investigated to select the modulation and separation performance. An oven T program was set at 35 °C for 10 min, increased to 135 °C (4 °C min−1), then to 250 °C (10 °C min−1) and held at this temperature for 20 min with the total run time of 66.5 min. The ion source temperature, emission current and electron energy were set at 250 °C, 34.6 μA and 70 eV, respectively, with a mass range of 28–550 m/z.
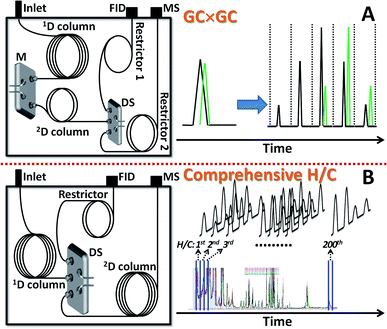 |
| | Fig. 1 Comprehensive MDGC systems used in this study: (A) GC × GC and (B) comprehensive H/C MDGC. M = modulator and DS = Deans switch. | |
2.1.2 Comprehensive H/C MDGC. The comprehensive H/C column set was 1D nonpolar DB-1MS column (60 m × 0.25 mm I.D. × 0.25 μm; J&W Scientific, US) and 2D polar DB-Wax column (60 m × 0.25 mm × 0.25 μm; J&W Scientific, US). The restrictor column (1.5 m × 0.1 mm; Agilent Technologies Inc.) was used to balance flow between first and second dimension. The three columns were connected through dean switch device (DS, Agilent Technologies Inc.) which the initial first dimension was connected from GC inlet to DS and restrictor column was connected from DS to the FID detector and the last second dimension was connected from DS to the MS followed the Fig. 1. Flow rates of helium were 2.3 and 4.7 mL min−1 in 1D and 2D separation, respectively. For each H/C analysis, GC oven temperature program and MS condition were the same as that applied in GC × GC. The total analysis time in comprehensive H/C analysis varies depending on the number of injections applied (an injection per run with the analysis time of 1 h per run). In this study, comprehensive multiple H/C was performed with different H/C windows (tH/C, period to transfer an effluent from 1D to 2D column) of 5.00, 2.50, 1.25, 1.00, 0.50 and 0.20 min covering the range from 10 to 60 min of 1D separation time. For each injection, several H/C were performed in a periodic strategy.13 In this study, each H/C was performed within every 5 min (which is 2D separation time, 2tR,max). The number of injections for each comprehensive analysis was thus calculated as 2tR,max/tH/C. The number of runs for comprehensive H/C analyses with tH/C of 5.00, 2.50, 1.25, 1.00, 0.50 and 0.20 min were 1, 2, 4, 5, 10 and 25 runs, respectively. The corresponding H/C events for each comprehensive H/C analysis were summarized in Table S1 (ESI†).
2.2 Data analysis
General data acquisition and processing were performed by using Agilent Mass Hunter. Microsoft Excel 2007 and Fortner Transform 3.3 (Fortner, Inc., Savoy, IL) were used for data visualisation.
2.2.1 GC × GC. Peak identification and estimation of retention time (1tR and 2tR) and average peak widths at baseline (1wb,ave and 2wb,ave) of all the separated peaks excluding that of the solvent in 1D and 2D separation was performed by using GC image version 2.7r1 GC × GC. The estimation was performed by use of pixel based approach for identification of peak (blob) from a contour plot (http://www.gcimage.com/gcxgc/usersguide/statistics.pdf). The 2D contour plots in GC × GC analysis were obtained by transformation of 1D modulated chromatogram data into a matrix. The matrix was further transformed into a 2D contour plot. All of these processes were performed by using GC image.
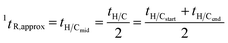
2.2.2 Comprehensive H/C. In generally, use of cryogenic trapping provides benefit in data analysis with simple calculation of 2tR of compounds within each H/C. For example with the 1.0 min H/C window applying along the period from 11.0 to 12.0 min in 1D separation, all the H/C compounds can be cryogenically trapped and then released with the same starting time in 2D separation.12 However, the sampling process from 1D column without use of cryogenic trap can lead to immediate elution onto 2D column and thus variation of the start time in 2D separation. In the case of 11.0–12.0 min heart cutting, compared with a compound with 1tR of 11.7 min, another compound with 1tR of 11.2 min will start eluting 0.5 min earlier in 2D separation. In this study without use of cryogenic trap, all the H/C compounds from 11.0–12.0 min will be set to have the same starting time in 2D separation which is the in middle of the H/C period (11.5 min). This leads to the error of “half of the H/C window” in calculation of both 1tR and 2tR, e.g. ±0.5 min for the 1 min H/C window. Thus, narrower H/C window resulted in more accurate calculation of 2tR.According to the approximation of starting time in 2D separation above, 1tR and 2tR of a peak detected by MS in each multiple H/C analysis were approximated as
| |
 | (1) |
| | |
2tR,approx = tR,observed − 1tR
| (2) |
where
tH/C is H/C window.
tH/Cmid and
tH/Cstart,
tH/Cend are middle time, starting time and ending time of the H/C, respectively.
tobserved is the peak time observed with MS detector (after elution through 1D and 2D columns). In case of modulated (or split) peaks into different H/C fractions, calculation of
1tR and
2tR of a compound was performed by selecting the modulated peak with highest peak area for each compound.
In general, by considering a H/C event, when the applied H/C window (tH/C) is significantly longer than average widths in 1D separation (1wb,ave) of compounds, any compounds separated within the H/C interval will undergo under sampling process resulting in recombination (e.g. by cryogenic trapping process or being collected into the same loop) of the separated peaks into the same H/C fraction (1D resolution loss) prior to 2D separation. In other words, such process can convert the actual 1wb,ave into tH/C, or tH/C = 1wb,ave as previously reported in ref. 3. In this study, there was no recombination effect since sample loop or cryogenic trapping approach was not applied. However, when considering only the raw 2DGC chromatograms observed with MS (see the system in Fig. 1A), the error discussed above occurs. This could also be considered with tH/C = 1wb,ave. In addition, when tH/C is narrower and closer to (or shorter than) 1wb,ave of compounds, under sampling effect can be reduced. In this case, peak splitting occurs and the apparent 1wb,ave will be scaled as the multiple of the H/C window. To this end, a general relationship applied for any H/C window can be proposed for approximation 1wb,ave as
| |
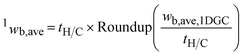 | (3) |
where
wb,ave,1DGC is average peak width at baseline of all the separated peaks excluded that of the solvent obtained from 1DGC analysis (
e.g. with the DS off). “
Roundup” is to result in the rounded number of a value in the parenthesis. The average width at baseline in chromatograms obtained in each H/C analysis (observed with MS detector after H/C) was herein assumed to be average widths in
1D separation (
2wb,ave).
The 2D contour plots in comprehensive H/C analysis covering 10–60 min in 1D separation were obtained by combination of the elution profiles subtracted by tH/Cmid obtained from all the H/C fractions into a matrix. The matrix was then converted into a 2D contour plot by using Fortner Transform 3.3 (Fortner, Inc., Savoy, IL).
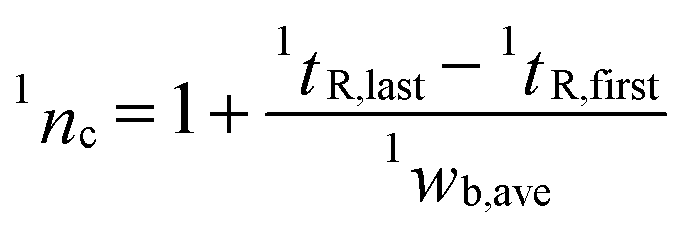
2.2.3 Peak capacity. Total peak capacity (nc,total) is calculated here by filling in the whole available separation space between the first and the last eluting analytes of interest with the retention times of tR,first and tR,last, respectively, and average peak widths at baseline of wb,ave according to| |
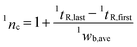 | (5) |
| |
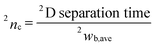 | (6) |
where the superscripts 1 or 2 indicate that the parameters are in 1D or 2D separation, respectively. 2D separation time is PM in GC × GC (6 s) or 2tR,max in comprehensive H/C analysis (5 min).
2.2.4 Compound identification. Compounds in the technical glycol precursor sample were tentatively identified by comparison of their mass spectra and 1D retention index (1I) values with those documented in NIST14 library and literatures. For the 1I determination, a mixture of alkanes was injected using the same experimental condition as that of sample analysis except the modulator was turned off. As analytes eluted from 1D column in a linear T program, 1D RI values were calculated by van den Dool and Kratz index using the relationship:15| |
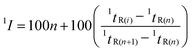 | (7) |
where 1tR(i) is the retention time of analyte of interest on 1D column. n and n + 1 are the numbers of carbons of alkane standards eluting in the positions bracketing the analyte i. Note that 2I was not calculated in this study. However, the criterion that later eluting compounds (taking into account wraparound) in 2D separation for each H/C fraction (or each modulation in GC × GC) should have higher 2I literature values was applied. The compounds reported in this work were identified with MS match score of >650 and 1I difference of ±30 unit from the literature values. The number of separated compounds is obtained by counting all the separated peaks in each analysis. Note that MS identification was also performed in order to avoid repetitive counting caused by the modulated (split) peaks of the same compound during the sampling process in comprehensive H/C.
3 Results and discussion
A technical glycol precursor sample was separated by use of two different comprehensive MDGC systems (GC × GC and comprehensive H/C) prior to detection with FID and MS. The system configurations were shown in Fig. 1. The results were evaluated and compared according to total peak capacity, number of separated peaks and average MS match scores of the separated peaks in each analysis. Peak capacity16 (nc) can be calculated by filling in the whole available separation space between the first and the last eluting analytes with an average peak width assigned. However, selectivity has not been taken into account in nc calculation. The aspect of selectivity was included in this study via calculation of the number of separated peaks in each separation. The experimental parameters related to these two comprehensive techniques were investigated and their results under the selected conditions were compared.
GC × GC employed long 1D column (30 m) and short 2D column (5 m) enabling fast 2D separation of a technical glycol precursor sample (with compounds elution time mostly distributing within a window of 6 s). As a result, comprehensive GC × GC analysis was performed within a single run (a single injection). Flow modulation was applied in this approach which requires high 2D flow for effective modulation process.17,18 The outlet flow was thus split to decrease flow to MS by using DS as a splitter19 as shown in Fig. 1A. The flow was further reduced by use of a longer restrictor with the same I.D. to MS. Investigation of experimental conditions in GC × GC was provided in ESI.† A suitable condition employing constant 1D and 2D column flows of 0.8 and 14 mL min−1, respectively, and the injection time of 0.60 s was selected for comparison with the comprehensive H/C analysis below.
3.1 Investigation of experimental conditions in the developed comprehensive H/C analysis
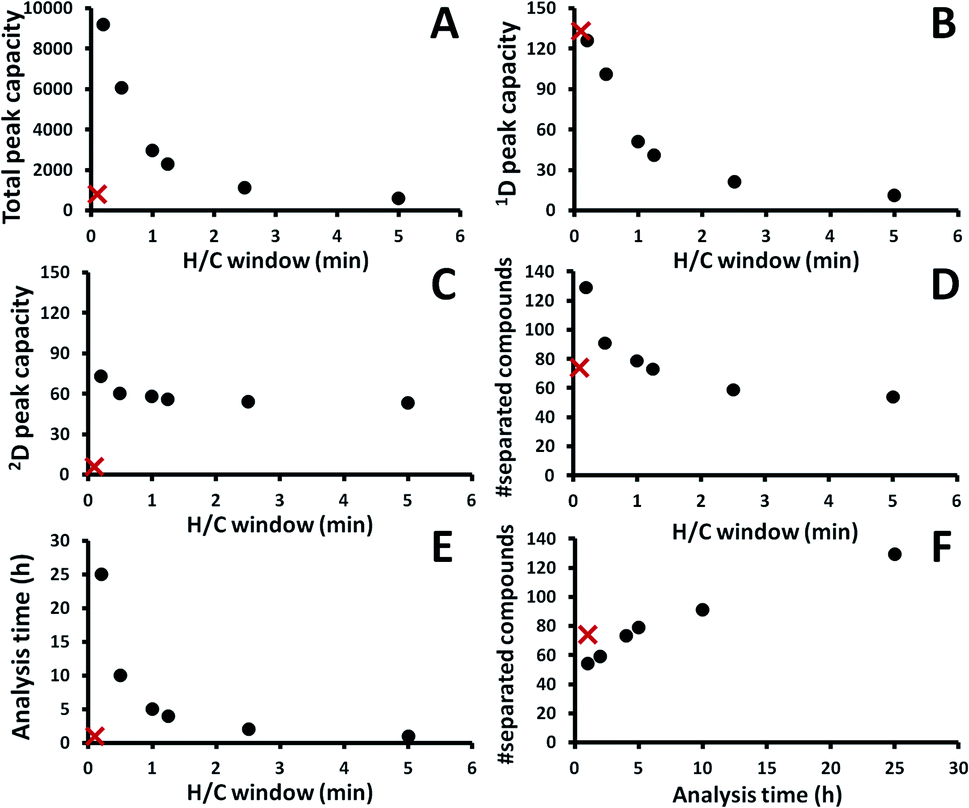
In order to improve 2D separation, comprehensive H/C MDGC system consisting of a long 1D column (30 m) and a long 2D column (60 m) was applied. In general, H/C approaches can be coupled with a cryogenic trapping system allowing peak focusing/sharpening effect and application of independent temperature and flow in 1D and 2D separations.11–13 The system in this study solely employed a DS without cryogenic trapping and splitting devices (Fig. 1B) with lower resolution and less flexibility in 2D separations. However, it is easier to configure and maintain, and also effective (e.g. see the result in Fig. 2 with 0.20 min H/C). Unlike GC × GC with a single injection analysis, several more injections should be performed in order to preserve 1D separation efficiency (by use of narrow H/C windows) and minimize wraparound effect.3 Thus, this approach requires longer analysis time as well as more complicate method generation and data analysis (see the Experimental section above). For example, with a constant 0.2 min H/C window, a comprehensive H/C analysis covering from 10 to 60 min of 1D separation time requires 250 times of H/C. In order to reduce the analysis time, cyclic multiple H/C strategy was performed in this study.13 This approach applies constant H/C window (tH/C) and 2D separation time (2tR,max) throughout the whole comprehensive analysis and the number of injections can be the ratio of 2tR,max to tH/C. In this study, a comprehensive analysis applied constant 2tR,max and tH/C of 5 and 0.2 min, respectively. This was found to be sufficient to elute most of the compounds (excluding those analyzed with 2.5 and 5.0 min H/C) in each H/C without wrapping around into the subsequent H/C. To this end, 25 injections (5 ÷ 0.2) were performed in order to complete the comprehensive analysis with 250 times of H/C. This means 10 H/C was performed in each injection.
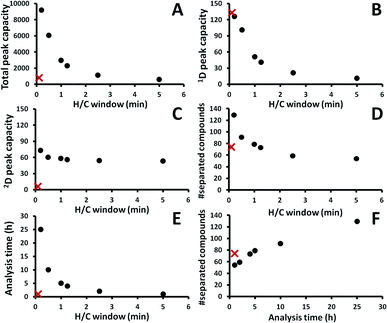 |
| | Fig. 2 Effects of H/C window (tH/C) on separation performance in comprehensive H/C analyses (●): 1nc, 2nc, total nc, number of identified compounds and analysis time (A–E, respectively), using the same 1D and 2D column flows of 2.3 and 4.7 mL min−1, respectively. The number of identified compounds vs. analysis time plot is also shown in (F). The corresponding data for GC × GC analysis are shown by ×, and it can also be said that the H/C window in GC × GC is PM. | |
3.1.1 Effects of H/C window and analysis time in comprehensive H/C analysis. With constant 1D and 2D column flows of 2.3 and 4.7 mL min−1, comprehensive H/C analyses of technical glycol precursor sample were performed using different tH/C. The resulting separation performance and analysis time for all the conditions were shown in Fig. 2.Note that the nc,total was calculated from 1wb,ave and 2wb,ave, see the Data analysis section above. The performance in comprehensive H/C analysis (see (●) in Fig. 2A–D) was significantly improved with the narrower H/C window (shorter tH/C) and thus with the increasing analysis time (Fig. 2E and F, respectively). The GC × GC analysis resulted in the total nc of 798 (see × in Fig. 2A); whilst, the number was improved to be 9198 with the comprehensive H/C analysis using 0.20 min H/C window (Fig. 2A). This is also higher than that reported with the recent cryogen-free GC × GC technology20 albeit with the requirement of much longer analysis time in our study. It should also be noted that the total nc could be improved to be much higher than 9198 by decreasing 1wb, e.g. using the higher split ratio. In addition, the developed system also allows use of lower carrier gas flow on the 2D column compared to that conventionally applied in GC × GC with flow modulation.21 Our approach is thus more compatible with MS detector. The corresponding numbers of separated peaks were 61 and 107, respectively (Fig. 2F). The contour plots obtained from the comprehensive H/C analyses were shown in Fig. 3 revealing better results with the shorter tH/C, see much greater resolution in the horizontal direction in Fig. 3 from 5.00 to 0.20 min H/C window. Shorter tH/C directly resulted in smaller 1wb,ave, thus increasing 1nc, see also the trend in Fig. 2B. This also reduced sampling amount (which decreased 2wb,ave) as well as reducing complexity (coelution) in each H/C pulse.3 Thus, 2nc slightly increased (Fig. 2C) as also shown by the greater resolution in the vertical direction with the narrower H/C windows in Fig. 3. Furthermore, as discussed in the Data analysis section above, there is more error in 1D time calculation with the longer tH/C. This leads to the strong wraparound with the wider H/C windows (Fig. 3). To this end, use of longer analysis time (shorter tH/C) improved total nc with the larger number of separated compounds, reduced wraparound and reduced uncertainty in 1tR calculation (see the related discussion in Data analysis).
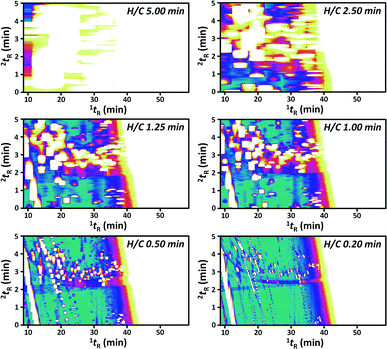 |
| | Fig. 3 Comprehensive H/C analysis results using different H/C windows. | |
3.2 Comparison of analysis performances in comprehensive H/C and GC × GC
As already discussed above, the plots (●) in Fig. 2 showed the performance of comprehensive H/C analysis with different H/C windows. The corresponding performance of the selected GC × GC analysis is also shown by the data (×) in Fig. 2. With the analysis time of 1 h, GC × GC clearly showed greater performance than the comprehensive H/C as shown by the plot of the number of identified peaks in Fig. 2F. This is mainly due to 1 h operation in comprehensive H/C analysis unavoidably using the long tH/C of 5 min which critically suppressed 1D performance (with 1nc of only 11); whilst, 1D separation performance in GC × GC is largely preserved (1nc of 133). However, 1nc was improved significantly with longer analysis time in comprehensive H/C. With the expense of >4 h of analysis time, the H/C performance in all the aspects, except 1nc, became greater than that provided by GC × GC (Fig. 2). Note that in this study, the shortest tH/C was 0.2 min which was still longer than the applied PM and resulted in lower 1nc in the H/C analysis (Fig. 2B). The 1nc could be further improved to be greater than that in GC × GC by use of tH/C < PM.
With the same temperature program, the results obtained using the investigated comprehensive techniques under the selected conditions were compared as shown in Fig. 4, which clearly showed much greater performance in 2D separation with the comprehensive H/C analysis (Fig. 4A) with a larger number of well separated peaks compared to that provided by conventional GC × GC (Fig. 4B). From the experimental results in Fig. 4, compound identifications were performed according to MS match library and 1I comparison with the data provided in Table 1. Since it is a proprietary sample, only the compounds classes are listed in the table.
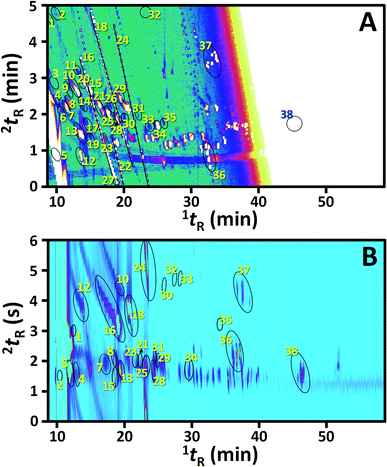 |
| | Fig. 4 Comparison between the selected results in (A) comprehensive H/C and (B) GC × GC analyses used for compound identification in Table 1. | |
Table 1 Volatile compound profile in technical glycol precursor obtained using different methodsa
| No. |
Compound |
GC × GC |
Comprehensive H/C |
ΔI |
| I(expriment) |
Match score |
I(expriment) |
Match score |
| ΔI = ±|I(experiment) − I(literature)|. Compound identification was confirmed by injection of authentic standard. |
| 1 |
Alcohol 1b |
<600 |
940 |
<600 |
922 |
Not available |
| 2 |
Alcohol 2b |
<600 |
879 |
<600 |
941 |
Not available |
| 3 |
Aldehyde 1b |
|
|
<600 |
866 |
Not available |
| 4 |
Aldehyde 2b |
<600 |
831 |
<600 |
841 |
Not available |
| 5 |
Ether 1b |
<600 |
949 |
<600 |
934 |
Not available |
| 6 |
Ester 1 |
|
|
604 |
830 |
±13 |
| 7 |
Aldehyde 3 |
618 |
937 |
621 |
933 |
±12 |
| 8 |
Ketone 1 |
659 |
844 |
616 |
853 |
±25 |
| 9 |
Cyclic ether 1b |
|
|
629 |
748 |
±4 |
| 10 |
Ketone 2 |
657 |
926 |
637 |
773 |
±30 |
| 11 |
Alcohol 4b |
|
|
<600 |
857 |
Not available |
| 12 |
Alcohol 3b |
<600 |
914 |
<600 |
908 |
Not available |
| 13 |
Alkane 1b |
670 |
933 |
667 |
922 |
±17 |
| 14 |
Ketone 3 |
|
|
667 |
819 |
±8 |
| 15 |
Ketone 4b |
657 |
853 |
646 |
890 |
0 |
| 16 |
Alcohol 5b |
661 |
937 |
663 |
933 |
±8 |
| 17 |
Ether 2b |
|
|
680 |
832 |
±30 |
| 18 |
Alcohol 6b |
710 |
935 |
688 |
921 |
±19 |
| 19 |
Oxygenate 1 |
|
|
692 |
828 |
±6 |
| 20 |
Ester 2 |
|
|
696 |
705 |
±1 |
| 21 |
Ketone 5 |
722 |
924 |
719 |
925 |
±3 |
| 22 |
Alcohol 7 |
|
|
754 |
814 |
±13 |
| 23 |
Alkane 2 |
732 |
721 |
729 |
884 |
±4 |
| 24 |
Alcohol 8b |
742 |
964 |
732 |
899 |
±14 |
| 25 |
Aldehyde 4 |
741 |
931 |
741 |
930 |
±2 |
| 26 |
Aldehyde 5 |
|
|
744 |
861 |
±25 |
| 27 |
Alcohol 9 |
|
|
750 |
813 |
±6 |
| 28 |
Ester 3 |
761 |
896 |
763 |
912 |
±1 |
| 29 |
Ketone 6b |
769 |
927 |
763 |
928 |
±5 |
| 30 |
Ether 3b |
778 |
781 |
766 |
845 |
±12 |
| 31 |
Ester 4 |
809 |
915 |
807 |
760 |
±1 |
| 32 |
Alcohol 10 |
833 |
787 |
830 |
926 |
±10 |
| 33 |
Ester 5 |
836 |
882 |
833 |
868 |
±4 |
| 34 |
Ester 6 |
856 |
947 |
852 |
945 |
±1 |
| 35 |
Ester 7 |
873 |
707 |
869 |
906 |
±3 |
| 36 |
Glycol 1b |
996 |
939 |
1006 |
951 |
±25 |
| 37 |
Glycol 2b |
1046 |
877 |
1015 |
912 |
±2 |
| 38 |
Glycol 3b |
1288 |
873 |
1284 |
877 |
Not available |
The numbers of focused compounds that were successfully identified were 27 and 38 compounds in GC × GC and comprehensive H/C, respectively. In addition, higher confidence in the analysis was obtained as illustrated by the improved average MS match scores from 887 ± 35 with GC × GC to 898 ± 24 with comprehensive H/C analysis for the set of compounds identified by both techniques, since greater separation performance was obtained in the later approach.
4 Conclusion
Cryogenic free strategies and the data analysis approach in comprehensive MDGC (GC × GC and comprehensive H/C) were developed with the example application for technical glycol precursor sample analysis. The GC × GC and comprehensive H/C experiments were investigated with the benefit of improved overall separation performance at longer analysis time, based mainly on the improved 2D separation with a longer 2D column in comprehensive H/C). Interestingly, the trend in Fig. 2F is matched with the theoretical trend simulated in the previous study.3 The results clearly showed separation performance in the comprehensive analysis can be improved by use of longer 2D column length and longer analysis time (mainly improving 2nc and 1nc, respectively). A compromise between time and separation performance should thus be made.
Under the selected conditions in this study, conventional GC × GC employing a flow modulator with suitable injection time and 2D column flow completed the analysis in 1 h. The comprehensive H/C was applied with the cyclic strategies allowing 250 H/C times to be performed within 25 h by a DS. The system was sufficiently stable that the overall 2D contour plot combining all the H/C results could be generated. The operation with a narrower H/C window allows sampling of significantly sharp band of analytes from 1D separation prior to 2D separation. Thus, 1tR and 1I calculation can be reliable, and use of cryogenic trapping can be avoided. Compared to GC × GC, such comprehensive H/C approach provided 12 times improved total peak capacity with 2 times of the number of separated compounds and more confidence with MS analysis (higher MS match score). To this end, ones could perform high performance comprehensive analysis by use of a single DS. With the expense of time, this technique is thus simple, useful and applicable for high resolution separation of any samples in the future.
Author contributions
Pannipa Janta: methodology, data curation, investigation, writing – original draft. Duangkamol Pinyo, Yamonporn Yodta and Porames Vasasiri: resources. Meinolf Weidenbach: supervision, project administration, funding acquisition. Xiuhan (Grace) Yang and Matthias Pursch: writing – review & editing, supervision, project administration, funding acquisition. Chadin Kulsing: conceptualization, software, formal analysis, writing – review & editing, visualization, supervision, project administration, funding acquisition.
Conflicts of interest
There are no conflicts to declare.
Acknowledgements
The authors gratefully acknowledge the financial support from the Chulalongkorn University's the 100th Anniversary Chulalongkorn University Fund for Doctoral Scholarship and the 90th Anniversary of Chulalongkorn University, Ratchadaphiseksomphot Endowment Fund. The research facility from the Center for Advanced Analytical Technology, Dow Chemical Thailand Ltd, Map Ta Phut Industrial Estate, Rayong. C. K. acknowledges the Second Century Fund (C2F), Chulalongkorn University.
Notes and references
- Y. Nolvachai, C. Kulsing and P. J. Marriott, TrAC, Trends Anal. Chem., 2017, 96, 124–137 CrossRef CAS.
- S. E. Prebihalo, K. L. Berrier, C. E. Freye, H. D. Bahaghighat, N. R. Moore, D. K. Pinkerton and R. E. Synovec, Anal. Chem., 2018, 90, 505–532 CrossRef CAS.
- C. Kulsing, Y. Nolvachai, P. Rawson, D. J. Evans and P. J. Marriott, Anal. Chem., 2016, 88, 3529–3538 CrossRef CAS.
- C. Meinert and U. J. Meierhenrich, Angew. Chem., Int. Ed., 2012, 51, 10460–10470 CrossRef CAS.
- P. Q. Tranchida, P. Donato, F. Cacciola, M. Beccaria, P. Dugo and L. Mondello, TrAC, Trends Anal. Chem., 2013, 52, 186–205 CrossRef CAS.
- Y. Nolvachai, C. Kulsing and P. J. Marriott, Anal. Chem., 2016, 88, 2125–2131 CrossRef CAS.
- Y. Nolvachai, C. Kulsing and P. J. Marriott, Anal. Chem., 2015, 87, 538–544 CrossRef CAS.
- W. Khummueng, J. Harynuk and P. J. Marriott, Anal. Chem., 2006, 78, 4578–4587 CrossRef CAS.
- M. Adahchour, J. Beens, R. J. J. Vreuls and U. A. T. Brinkman, TrAC, Trends Anal. Chem., 2006, 25, 540–553 CrossRef CAS.
- C. Kulsing, Y. Nolvachai and P. J. Marriott, TrAC, Trends Anal. Chem., 2020, 130, 115995 CrossRef CAS.
- H. D. Waktola, C. Kulsing, Y. Nolvachai and P. J. Marriott, J. Chromatogr. A, 2018, 1549, 77–84 CrossRef CAS.
- C. Kulsing, Y. Nolvachai, Y. F. Wong, M. I. Glouzman and P. J. Marriott, J. Chromatogr. A, 2018, 1546, 97–105 CrossRef CAS.
- B. Mitrevski, R. L. Webster, P. Rawson, D. J. Evans, H.-K. Choi and P. J. Marriott, J. Chromatogr. A, 2012, 1224, 89–96 CrossRef CAS.
- N. Thongdorn, T. Nhujak, P. Janta, A. Rueangthaweep, N. Hinchiranan and C. Kulsing, Anal. Methods, 2020, 12, 5160–5167 RSC.
- M. Jiang, C. Kulsing, Y. Nolvachai and P. J. Marriott, Anal. Chem., 2015, 87, 5753–5761 CrossRef CAS.
- Z. Liu, D. G. Patterson and M. L. Lee, Anal. Chem., 1995, 67, 3840–3845 CrossRef CAS.
- H. D. Bahaghighat, C. E. Freye and R. E. Synovec, TrAC, Trends Anal. Chem., 2019, 113, 379–391 CrossRef CAS.
- C. Duhamel, P. Cardinael, V. Peulon-Agasse, R. Firor, L. Pascaud, G. Semard-Jousset, P. Giusti and V. Livadaris, J. Chromatogr. A, 2015, 1387, 95–103 CrossRef CAS.
- P. Boeker, J. Leppert, B. Mysliwietz and P. S. Lammers, Anal. Chem., 2013, 85, 9021–9030 CrossRef CAS.
- T. J. Trinklein, D. V. Gough, C. G. Warren, G. S. Ochoa and R. E. Synovec, J. Chromatogr. A, 2020, 1609, 460488 CrossRef CAS.
- I. Aloisi, T. Schena, B. Giocastro, M. Zoccali, P. Q. Tranchida, E. B. Caramão and L. Mondello, Anal. Chim. Acta, 2020, 1105, 231–236 CrossRef CAS.
Footnote |
| † Electronic supplementary information (ESI) available: Table S1, investigation of experimental conditions in GC × GC and ESI Microsoft Excel. See DOI: 10.1039/d0ra10495g |
|
| This journal is © The Royal Society of Chemistry 2021 |
Click here to see how this site uses Cookies. View our privacy policy here. 
 Open Access Article
 This Open Access Article is licensed under a Creative Commons Attribution-Non Commercial 3.0 Unported Licence
 *e and
Chadin Kulsing
*e and
Chadin Kulsing