 Open Access Article
Degradation of ammonia gas by Cu2O/{001}TiO2 and its mechanistic analysis
Jiaming Zhu ab,
Yue Jianab,
Dingbiao Longab,
Hao Wangab,
Yaqiong Zengab,
Jigang Lia,
Rong Xiao*a and
Shihua Pu*ab
aChongqing Academy of Animal Sciences, Chongqing, 402460, China. E-mail: XRD610@126.com; x00r@163.com; pu88962@126.com
bScientific Observation and Experiment Station of Livestock Equipment Engineering in Southwest, Ministry of Agriculture, Chongqing, 402460, China
First published on 19th January 2021
Abstract
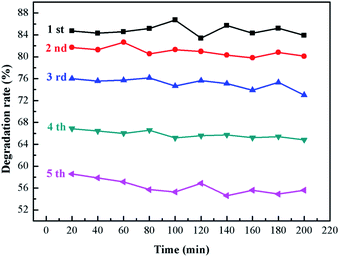
A heterogeneous composite catalyst Cu2O/{001}TiO2 was successfully prepared by the impregnation–reduction method. With ammonia as the target pollutant, the degradation performance and degradation mechanism analysis of the prepared composite catalyst were investigated, providing technology for the application of photocatalysis technology in ammonia treatment reference. The catalysts were characterized by X-ray diffraction (XRD), transmission electron microscopy (TEM), X-ray photoelectron spectroscopy (XPS), scanning electron microscopy (SEM), specific surface area (BET), fluorescence spectrum (PL) and UV-visible absorption (UV-Vis). The results showed: compared with single {001}TiO2, the addition of Cu2O to form a composite catalyst can reduce the recombination of electron–hole pairs, resulting in increased absorption intensity in the visible light range, decreased band gap width, and finally improved the degradation performance. When the composite ratio is 1![[thin space (1/6-em)]](https://www.rsc.org/images/entities/char_2009.gif) :
:![[thin space (1/6-em)]](https://www.rsc.org/images/entities/char_2009.gif) 10, the specific surface area is the largest, which is 72.51 m2 g−1, and the degradation rate of ammonia is also the highest maintained at 85%. After repeated use for 5 times, the degradation rate of ammonia decreases gradually due to the loss of catalyst and photo-corrosion. In the whole reaction process, surface adsorbed water and associated hydroxyl radical participate in the ammonia degradation reaction, and finally form free hydroxyl radical and NO3−. It provides some theoretical support for ammonia gas treatment, which is of great significance to protect the environment.
10, the specific surface area is the largest, which is 72.51 m2 g−1, and the degradation rate of ammonia is also the highest maintained at 85%. After repeated use for 5 times, the degradation rate of ammonia decreases gradually due to the loss of catalyst and photo-corrosion. In the whole reaction process, surface adsorbed water and associated hydroxyl radical participate in the ammonia degradation reaction, and finally form free hydroxyl radical and NO3−. It provides some theoretical support for ammonia gas treatment, which is of great significance to protect the environment.
1. Introduction
Atmospheric ammonia is the sole abundant alkaline gas and contributes substantially to the formation of particulate matter, which affects air quality and has implications for human health and life expectancy.1,2 China emits about 10–15 million tons NH3 to the air each year, almost doubled the sum in the USA and European Union.3 At present, nitrogen deposition per square kilometer of Beijing–Tianjin–Hebei region in China reaches 6.1 tons per year, which is the highest level recorded in developed countries.4 The ammonia from animal husbandry may not only cause global climate change, but can also bring disease in animals and humans, such as paralysis centralis, endobronchitis, and others.5 Reducing NH3 emission can significantly improve China's air quality, especially in North China Plain where haze pollution is severe in winter.6According to 2016 Clean Air Management Report from CAAC (Clean Air Alliance of China), 80% of China ammonia emissions comes from intensive livestock farm and fertilizer application. Therefore the Chinese central government has started to put agricultural NH3 on the reduction list for air quality in the updated Clean Air Act (CAA) given its important contribution to PM2.5 pollution,7 but it is important that solutions are mainly constrained by the implementation of effective technologies in agricultural industry. In the past, livestock farms adopted traditional physical methods of adsorption and ventilation to eliminate the ammonia generated. Although they can decrease the release concentration of ammonia over time, but cannot reduce the total amount of ammonia emissions. The traditional process of ammonia treatment has high cost and short of stability, may aggravate the secondary pollution of the environment.8
Photocatalysis technology is more and more popular due to its low reaction temperature and no secondary pollution in the reaction process. The main principle of photocatalysis technology is based on the oxidation–reduction ability of photocatalyst under light conditions, so as to achieve purification of pollution.9 It has good application effects in many frontier fields such as sewage treatment,10 waste gas treatment,11 energy development,12 self-cleaning material13 and antibacterial14 and other fields.
TiO2 has become the most promising photocatalyst due to its advantages such as good chemical stability, safety, non-toxicity, and strong redox ability.15 However, due to the wide band gap width (3.2 eV) of TiO2, it can only respond to ultraviolet light with high energy, while the ultraviolet content in the solar spectrum is very low, resulting in its low utilization rate. At the same time, the photoelectron–hole composite rate of TiO2 is high, which reduces its activity and seriously hinders its practical application.16 In the photocatalytic reaction system, the activity of TiO2 is related to crystal shape, morphology and size, etc. Recent literatures have shown that crystal surface is also one of the factors affecting its catalytic activity, because the reaction is mainly on the surface of TiO2, the different crystal surfaces has different electron composition and energy band. The anatase TiO2 average surface energy on {001} surface (0.90 J m−2) is much higher than that on {101} surface (0.44 J m−2).17 So the crystal growth process is mainly along {101} faces with low surface energy, anatase TiO2 is mainly composed of {101} crystal faces.18 H. Park et al. found that fluoride ion can not only exchange hydroxyl on the TiO2 surface, but also reduce the surface energy of {001} crystal faces.19 Then, Yang et al. synthesized 47% {001} crystal surface TiO2 with HF, of which the activity was much higher than that of {101} crystal surface.20 Since then, {001}TiO2 has been widely used in environmental governance, sensors, energy development and other fields.21 Among many semiconductors, Cu2O has simple preparation process, low raw material price, environmental-friendly and a good response in the visible light range, it is a green catalyst with great development prospect.22 As a p-type semiconductor, it can be coupled with n-type semiconductor {001}TiO2 to form a heterostructure, and exhibit better performance than a single material. That make it currently widely used in hydrogen production, solar cells, degrade pollutants.23
UV lamps are mostly used in the photocatalytic degradation of ammonia. In this paper, a Cu2O/{001}TiO2 composite photocatalyst was prepared and degraded ammonia with xenon lamp. The activity and degradation mechanism of the prepared catalysts for active catalytic degradation of ammonia were investigated, the photocatalytic degradation of ammonia and the composite mechanism of semiconductor were also studied, which provides a certain theoretical basis for improving air quality.
2. Experimental
2.1 Chemicals
Butyl titanate (AR, Tianjin Fuchen Chemical Reagent Factory), anhydrous ethanol (AR, Tianjin Fuyu Fine Chemical Co., Ltd.), hydrofluoric acid (AR, Sichuan Xilong Chemical Co., Ltd.), sodium hydroxide (AR, Chengdu Kelong Chemical Reagent Factory), anhydrous copper sulfate (AR, Chengdu Cologne Chemical Co., Ltd.), glucose (AR, Chengdu Cologne Chemical Co., Ltd.), P25 (Degussa).2.2 Synthesis of the samples
Anhydrous ethanol (30.4 mL) was slowly added to 35.2 mL butyl titanate and stirred until the solution was well distributed (designated solution A). Then, 30.4 mL absolute ethanol was slowly added to 180 mL ultra-pure water; 12 mL hydrofluoric acid was then added to this solution (designated solution B). Next, the A solution was added to the B solution and was stirred under medium speed at room temperature for 2 h; the TiO2 gel was allowed to sit for 2 days and then moved to a stainless-steel reactor containing a Poly Tetra Fluoro Ethylene (PTFE) inner container at 100 °C for 2 h. After cooling, the precipitates were separated and washed alternately with ultra-pure water and absolute ethanol for three times, drying in a 100 °C drying oven. After completion of a grinding process, the obtained powder was marked as {001}TiO2.8 g anhydrous copper sulfate was dissolved in 100 mL ultrapure water formed as solution A. 6.4 g of sodium hydroxide was dissolved in 20 mL ultrapure water formed as solution B. 12 g glucose was dissolved in 75 mL ultrapure water, which placed the glucose solution at a constant temperature of 34 °C formed as solution C. The solution B added into the solution A form a blue precipitate, which was dropwise added the heated glucose solution; then heated to 70 °C and kept for 15 minutes, and finally appeared a brick red precipitate. Taken a certain amount of brick red precipitate to 100 mL distilled water as well as added 2 g of {001}TiO2, then putted in ultrasonic cleaning machine for 20 min to make it dispersion uniform as mixed solution. After centrifuged the mixed solution, taken the precipitate washed with absolute ethanol and ultrapure water alternatively, which dried and grinded in a blast drying oven at 60 °C to obtain composite catalysts in different proportions, denoted as Cu2O/{001}TiO2 1![[thin space (1/6-em)]](https://www.rsc.org/images/entities/char_2009.gif) :
:![[thin space (1/6-em)]](https://www.rsc.org/images/entities/char_2009.gif) X (as 1
X (as 1![[thin space (1/6-em)]](https://www.rsc.org/images/entities/char_2009.gif) :
:![[thin space (1/6-em)]](https://www.rsc.org/images/entities/char_2009.gif) 1, 1
1, 1![[thin space (1/6-em)]](https://www.rsc.org/images/entities/char_2009.gif) :
:![[thin space (1/6-em)]](https://www.rsc.org/images/entities/char_2009.gif) 5, 1
5, 1![[thin space (1/6-em)]](https://www.rsc.org/images/entities/char_2009.gif) :
:![[thin space (1/6-em)]](https://www.rsc.org/images/entities/char_2009.gif) 10, 1
10, 1![[thin space (1/6-em)]](https://www.rsc.org/images/entities/char_2009.gif) :
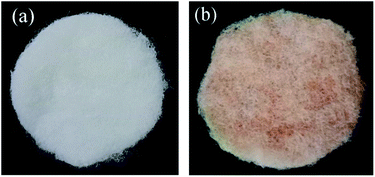
:![[thin space (1/6-em)]](https://www.rsc.org/images/entities/char_2009.gif) 15). The prepared catalyst showed in Fig. 1. The prepared catalyst changes from dark brick red to light brick red with the proportion of {001}TiO2 increases.
15). The prepared catalyst showed in Fig. 1. The prepared catalyst changes from dark brick red to light brick red with the proportion of {001}TiO2 increases.
We used polyester fiber with good light permeability as the catalyst carrier, the cutted PET carrier into the catalyst gel after repeated washing as the loaded carrier, and the cutted PET carrier into ultrapure water as the blank carrier. Then shook the in the room temperature oscillator for 4 h, then dried in 60 °C air drying oven, as shown in Fig. 1.
2.3 Characterization
The X-ray diffractometer (XRD, Germany, Bruker) model D8 Advance was used to test the characteristics of the catalyst crystals at 40 mA and 30 kV, the scanning range was 10–80°, the operating parameters were X-ray tube target = Cu. The transmission electron microscope (TEM, USA, Tecnai G2 F20) was used to test the detailed lattice spacing. Elemental and valence analysis was carried out using An X-ray photoelectron spectroscopy (XPS, USA, Thermo) model EscaLab 250Xi, the binding energy of the surface adsorbing carbon, C 1s (284.6 eV), was used as the internal standard for calibration. The scanning electron microscope (SEM, Japan, JEOL) model JSM-6700 was used to observe the morphology and dispersion of the samples, the operating voltage was 5.0 kV and the magnification was between 1 and 200![[thin space (1/6-em)]](https://www.rsc.org/images/entities/char_2009.gif) 000 times. The TriStar II 3020 series automatic specific surface analyzer (BET, USA, GA) was used to determine the specific surface area and porosity of the catalysts, the catalyst was pretreated at 200 °C and vacuum degassed for 5 hours, and high-purity nitrogen was adsorbed at 77 K. The fluorescence spectrophotometer (PL, Hitachi, Japan) model F-2700 was used to measure the electron–hole recombination, the operating voltage was 250 V, the wavelength was 5 nm, and the excitation wavelength was 300 nm.
000 times. The TriStar II 3020 series automatic specific surface analyzer (BET, USA, GA) was used to determine the specific surface area and porosity of the catalysts, the catalyst was pretreated at 200 °C and vacuum degassed for 5 hours, and high-purity nitrogen was adsorbed at 77 K. The fluorescence spectrophotometer (PL, Hitachi, Japan) model F-2700 was used to measure the electron–hole recombination, the operating voltage was 250 V, the wavelength was 5 nm, and the excitation wavelength was 300 nm.
2.4 Photocatalytic activity measurement
The pipeline after the photocatalytic reaction tube was equipped with a branch pipe as the sample gas outlet, as shown in Fig. 2, using the PGM-7800 ammonia detector manufactured by REA, the two ends of the gas inlet and the gas outlet were tested at an interval of 20 minutes. A 300 W xenon light was used to simulate sunlight for photocatalytic reaction, and the catalytic performance of the catalysts were analyzed and evaluated by measuring the ammonia concentration at the inlet and outlet of the photocatalytic reaction tube.2.5 Degradation of ammonia by different samples
Carriers of blank group, P25, Cu2O, {001}TiO2, 1![[thin space (1/6-em)]](https://www.rsc.org/images/entities/char_2009.gif) :
:![[thin space (1/6-em)]](https://www.rsc.org/images/entities/char_2009.gif) 1, 1
1, 1![[thin space (1/6-em)]](https://www.rsc.org/images/entities/char_2009.gif) :
:![[thin space (1/6-em)]](https://www.rsc.org/images/entities/char_2009.gif) 5, 1
5, 1![[thin space (1/6-em)]](https://www.rsc.org/images/entities/char_2009.gif) :
:![[thin space (1/6-em)]](https://www.rsc.org/images/entities/char_2009.gif) 10 and 1
10 and 1![[thin space (1/6-em)]](https://www.rsc.org/images/entities/char_2009.gif) :
:![[thin space (1/6-em)]](https://www.rsc.org/images/entities/char_2009.gif) 15 were put into the reaction tube, the air flow rate was 0.5 L min−1, the humidity was 75%, and the photocatalytic reaction was carried out after the gas supply system was stable, we conducted three times and calculated the average value for each set of degradation experiments.
15 were put into the reaction tube, the air flow rate was 0.5 L min−1, the humidity was 75%, and the photocatalytic reaction was carried out after the gas supply system was stable, we conducted three times and calculated the average value for each set of degradation experiments.
2.6 The sample stability
Take 1![[thin space (1/6-em)]](https://www.rsc.org/images/entities/char_2009.gif) :
:![[thin space (1/6-em)]](https://www.rsc.org/images/entities/char_2009.gif) 10 sample and put them into the photocatalytic reaction tube respectively to ensure that the amount of the final supported catalyst is 500 mg. The initial concentration of ammonia is 120 ppm, the humidity is 75%, and the air flow is 0.5 L min−1. After the gas supply system is stabilized, the light source used a 300 W long arc xenon lamp to simulate sunlight for the photocatalytic reaction. After the completion of the first photocatalytic degradation, the carrier was taken out and placed in air drying oven at 60 °C for 30 min. The purpose was to remove residual ammonia molecules on the surface, and then the second photocatalytic degradation reaction was conducted, which was repeated for 5 times under the same conditions.
10 sample and put them into the photocatalytic reaction tube respectively to ensure that the amount of the final supported catalyst is 500 mg. The initial concentration of ammonia is 120 ppm, the humidity is 75%, and the air flow is 0.5 L min−1. After the gas supply system is stabilized, the light source used a 300 W long arc xenon lamp to simulate sunlight for the photocatalytic reaction. After the completion of the first photocatalytic degradation, the carrier was taken out and placed in air drying oven at 60 °C for 30 min. The purpose was to remove residual ammonia molecules on the surface, and then the second photocatalytic degradation reaction was conducted, which was repeated for 5 times under the same conditions.
2.7 Ammonia degradation mechanism analysis
The method of photocatalytic ammonia was explored by measuring Fourier transform infrared spectroscopy (FT-IR) at different reaction time points. 1 g of 1![[thin space (1/6-em)]](https://www.rsc.org/images/entities/char_2009.gif) :
:![[thin space (1/6-em)]](https://www.rsc.org/images/entities/char_2009.gif) 10 composite catalyst was paved into the sample tank of the static ammonia degradation device, and 500 ppm high concentration ammonia was introduced into the reaction tube. The high concentration of ammonia was conducive to the enrichment of the products on the surface of the catalyst, under xenon light irradiation, samples were taken at 10, 20 and 30 min of the reaction respectively, and Fourier transform infrared spectroscopy (FT-IR) was used to observe the group changes in the reaction process.
10 composite catalyst was paved into the sample tank of the static ammonia degradation device, and 500 ppm high concentration ammonia was introduced into the reaction tube. The high concentration of ammonia was conducive to the enrichment of the products on the surface of the catalyst, under xenon light irradiation, samples were taken at 10, 20 and 30 min of the reaction respectively, and Fourier transform infrared spectroscopy (FT-IR) was used to observe the group changes in the reaction process.
3. Results and discussion
3.1 XRD analysis
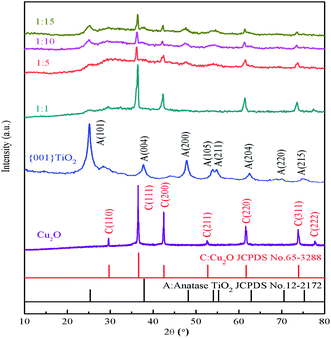
It can be seen from Fig. 3 that the characteristic peaks of the prepared {001} TiO2 catalyst at 2θ = 25.28°, 37.80°, 48.04°, 53.89°, 55.06°, 62.68°, 70.31° and 75.03°, respectively correspond to {101}, {004}, {200}, {105}, {211}, {204}, {220} and {215} planes, which are almost identical with anatase TiO2 (JCPDS no. 21-1272).24 The characteristic peaks of Cu2O at 2θ = 29.63°, 36.50°, 42.40°, 52.58°, 63.52°, 73.70° and 77.57° correspond to {110}, {111}, {200}, {211}, {220}, {311}, {222}, respectively, almost in accordance with the standard card of Cu2O (JCPDS no. 65-3288),25 and there are no peaks of CuO and Cu, indicating that the prepared catalyst is Cu2O with high purity.It can be seen that the main characteristic peak of 1![[thin space (1/6-em)]](https://www.rsc.org/images/entities/char_2009.gif) :
:![[thin space (1/6-em)]](https://www.rsc.org/images/entities/char_2009.gif) 1 was basically consistent with the diffraction peak of Cu2O, and the content of TiO2 was too small to observe. As the composite ratio increases (from 1
1 was basically consistent with the diffraction peak of Cu2O, and the content of TiO2 was too small to observe. As the composite ratio increases (from 1![[thin space (1/6-em)]](https://www.rsc.org/images/entities/char_2009.gif) :
:![[thin space (1/6-em)]](https://www.rsc.org/images/entities/char_2009.gif) 5 to 1
5 to 1![[thin space (1/6-em)]](https://www.rsc.org/images/entities/char_2009.gif) :
:![[thin space (1/6-em)]](https://www.rsc.org/images/entities/char_2009.gif) 15), the main characteristic peaks of TiO2 appeared gradually at 2θ = 25.28° and 48.04°, and the intensity gradually increased. The characteristic peak of both TiO2 and Cu2O can still be observed, this means that TiO2 in the prepared composite catalyst has high activity of {001} crystal surface.
15), the main characteristic peaks of TiO2 appeared gradually at 2θ = 25.28° and 48.04°, and the intensity gradually increased. The characteristic peak of both TiO2 and Cu2O can still be observed, this means that TiO2 in the prepared composite catalyst has high activity of {001} crystal surface.
3.2 TEM analysis
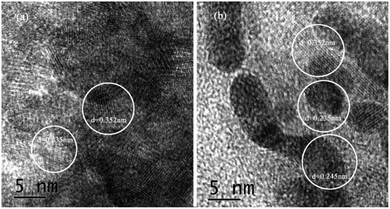
Fig. 4 showed the lattice spacing of {001}TiO2 and 1![[thin space (1/6-em)]](https://www.rsc.org/images/entities/char_2009.gif) :
:![[thin space (1/6-em)]](https://www.rsc.org/images/entities/char_2009.gif) 10, respectively. Fig. 4(a) showed that d = 0.352 nm and d = 0.235 nm, which correspond to the {101} and {001} planes of anatase TiO2, respectively;26 Fig. 4(b) not only contains d = 0.352 nm and d = 0.235 nm, but also contain d = 0.245 nm, corresponding to the {111} surface of Cu2O,27 which meaned that 1
10, respectively. Fig. 4(a) showed that d = 0.352 nm and d = 0.235 nm, which correspond to the {101} and {001} planes of anatase TiO2, respectively;26 Fig. 4(b) not only contains d = 0.352 nm and d = 0.235 nm, but also contain d = 0.245 nm, corresponding to the {111} surface of Cu2O,27 which meaned that 1![[thin space (1/6-em)]](https://www.rsc.org/images/entities/char_2009.gif) :
:![[thin space (1/6-em)]](https://www.rsc.org/images/entities/char_2009.gif) 10 also contains {001} highly active surface, which is consistent with the XRD analysis results.
10 also contains {001} highly active surface, which is consistent with the XRD analysis results.
3.3 XPS analysis
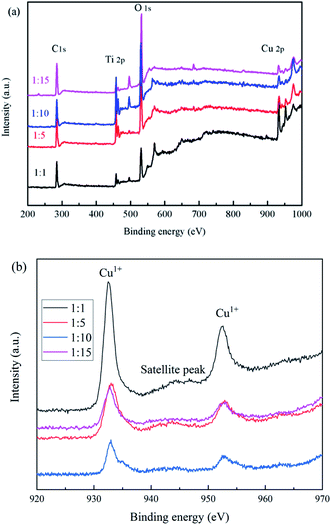
The elemental and valence states of the composite catalysts were analyzed by XPS in Fig. 5. It can be seen that Fig. 5(a) showed that the full spectrum of the catalysts, all catalysts contain C 1s, Ti 2p, O 1s, F 1s, Cu 2p; Fig. 5(b) showed the binding energy of Cu 2p, we found that the prepared catalysts all have characteristic peaks near 932.9 and 952.6 eV, which correspond to Cu1+,28 and the satellite peak was attributed to the shakeup of outer electron in CuO, which indicates only a little CuO in composite samples.293.4 SEM analysis
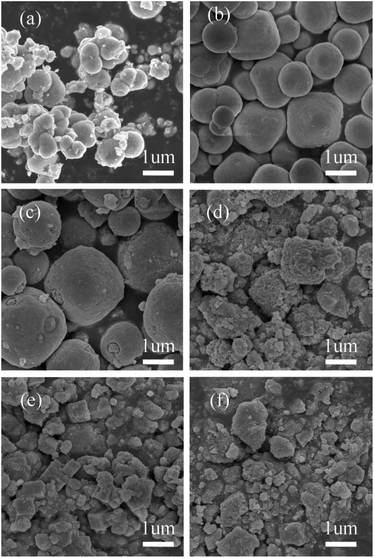
It can be seen from Fig. 6(a) that the prepared {001}TiO2 was extruded spherical with slightly agglomeration phenomenon. Fig. 6(b) can see that the prepared Cu2O was in pyramid shape. Fig. 6(c) can see that when the amount of {001}TiO2 was low, it embedded on the surface of Cu2O. Fig. 6(d) can see the {001}TiO2 densed growth on Cu2O surface when the Cu2O/{001}TiO2 is 1![[thin space (1/6-em)]](https://www.rsc.org/images/entities/char_2009.gif) :
:![[thin space (1/6-em)]](https://www.rsc.org/images/entities/char_2009.gif) 5, Fig. 6(e) can be seen there was no regular shape that the particles of each other are stacked together to form a relatively rich pore structure with the Cu2O/{001}TiO2 is 1
5, Fig. 6(e) can be seen there was no regular shape that the particles of each other are stacked together to form a relatively rich pore structure with the Cu2O/{001}TiO2 is 1![[thin space (1/6-em)]](https://www.rsc.org/images/entities/char_2009.gif) :
:![[thin space (1/6-em)]](https://www.rsc.org/images/entities/char_2009.gif) 10. Fig. 6(f) showed the various particles pile up each other appeared obvious agglomeration when the Cu2O/{001}TiO2 is 1
10. Fig. 6(f) showed the various particles pile up each other appeared obvious agglomeration when the Cu2O/{001}TiO2 is 1![[thin space (1/6-em)]](https://www.rsc.org/images/entities/char_2009.gif) :
:![[thin space (1/6-em)]](https://www.rsc.org/images/entities/char_2009.gif) 15, that may be due to when the amount of {001}TiO2 was excessive, it will be formed a large number of fragments after ultrasonic dispersion and energy absorption, and appeared the agglomeration in the recombination process of the composite.
15, that may be due to when the amount of {001}TiO2 was excessive, it will be formed a large number of fragments after ultrasonic dispersion and energy absorption, and appeared the agglomeration in the recombination process of the composite.
3.5 BET analysis
Brunauer–Emmett–Teller (BET) method was used to calculate the specific surface area of the prepared catalyst, and Barrett–Joyner–Halenda (BJH) method was used to analyze the pore size distribution and pore volume.31 The catalysts in Fig. 7(a) showed typical type IV nitrogen adsorption desorption isotherms. The pore size distribution of the catalysts in Fig. 7(b) showed that the pore size of the prepared catalyst was mainly concentrated in 0–20 nm, indicating that the pore size of the catalyst was mainly mesoporous. Combined with the data in Table 1, the specific surface area of 1![[thin space (1/6-em)]](https://www.rsc.org/images/entities/char_2009.gif) :
:![[thin space (1/6-em)]](https://www.rsc.org/images/entities/char_2009.gif) 10 was the largest, which is beneficial to adsorption of ammonia provides more contact time for catalyst and ammonia.
10 was the largest, which is beneficial to adsorption of ammonia provides more contact time for catalyst and ammonia.
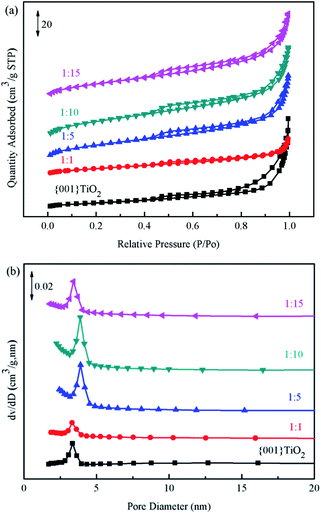 | ||
| Fig. 7 BET spectrum of the samples (a) specific surface area of catalyst, (b) distribution of catalyst pores. | ||
| Samples | Specific surface area (m2 g−1) | Pore volume (cm3 g−1) |
|---|---|---|
| {001}TiO2 | 22.79 | 0.09 |
1![[thin space (1/6-em)]](https://www.rsc.org/images/entities/char_2009.gif) : :![[thin space (1/6-em)]](https://www.rsc.org/images/entities/char_2009.gif) 1 1 |
47.65 | 0.04 |
1![[thin space (1/6-em)]](https://www.rsc.org/images/entities/char_2009.gif) : :![[thin space (1/6-em)]](https://www.rsc.org/images/entities/char_2009.gif) 5 5 |
58.19 | 0.10 |
1![[thin space (1/6-em)]](https://www.rsc.org/images/entities/char_2009.gif) : :![[thin space (1/6-em)]](https://www.rsc.org/images/entities/char_2009.gif) 10 10 |
72.51 | 0.11 |
1![[thin space (1/6-em)]](https://www.rsc.org/images/entities/char_2009.gif) : :![[thin space (1/6-em)]](https://www.rsc.org/images/entities/char_2009.gif) 15 15 |
53.29 | 0.10 |
3.6 PL analysis
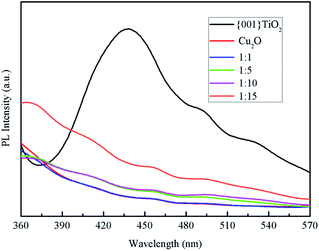
Fluorescence spectroscopy is a characterization of the photogenerated electron–hole recombination of the photocatalyst, the higher the photo-generated electron–hole binding rate, the stronger the fluorescence intensity.30 It can be seen from Fig. 8 that the electron–hole loading rate of pure {001}TiO2 was higher than that of the composited catalysts, indicating that the electron–hole recombination rate of the composited catalyst was significantly reduced, the degradation efficiency of the composite catalyst in the degradation process will be significantly improved.3.7 Optical performance analysis
It can be seen from Fig. 9(a) that the light absorption intensity of the composite catalysts at 350–800 nm was stronger than that of single {001}TiO2, indicating that the composite catalyst had strong catalytic activity mainly in visible light range. Kubelka–Munk method was used to calculate the band gap width, as shown in eqn (1)–(3):32
A = −lg![[thin space (1/6-em)]](https://www.rsc.org/images/entities/char_2009.gif) R R
| (1) |
| F(R) = (1 − R)2/2R | (2) |
| (hvF) ∼ (hv − Eg)2 | (3) |
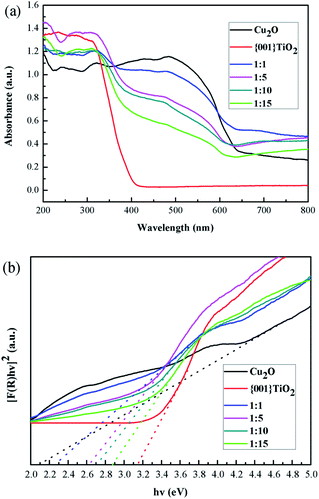 | ||
| Fig. 9 Optical properties (a) UV-visible absorption spectrum of samples, (b) band gap width of the samples. | ||
| Samples | Bandgap (eV) |
|---|---|
| Cu2O | 2.12 |
| {001}TiO2 | 3.14 |
1![[thin space (1/6-em)]](https://www.rsc.org/images/entities/char_2009.gif) : :![[thin space (1/6-em)]](https://www.rsc.org/images/entities/char_2009.gif) 1 1 |
2.26 |
1![[thin space (1/6-em)]](https://www.rsc.org/images/entities/char_2009.gif) : :![[thin space (1/6-em)]](https://www.rsc.org/images/entities/char_2009.gif) 5 5 |
2.62 |
1![[thin space (1/6-em)]](https://www.rsc.org/images/entities/char_2009.gif) : :![[thin space (1/6-em)]](https://www.rsc.org/images/entities/char_2009.gif) 10 10 |
2.70 |
1![[thin space (1/6-em)]](https://www.rsc.org/images/entities/char_2009.gif) : :![[thin space (1/6-em)]](https://www.rsc.org/images/entities/char_2009.gif) 15 15 |
2.88 |
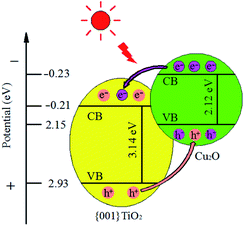
The calculated results showed that the band gap width of the composite catalyst is reduced compared with that of {001}TiO2, indicating that the composite catalyst is more easily excited and has higher catalytic activity.
3.8 Photocatalytic performance test
![[thin space (1/6-em)]](https://www.rsc.org/images/entities/char_2009.gif) :
:![[thin space (1/6-em)]](https://www.rsc.org/images/entities/char_2009.gif) 1, 1
1, 1![[thin space (1/6-em)]](https://www.rsc.org/images/entities/char_2009.gif) :
:![[thin space (1/6-em)]](https://www.rsc.org/images/entities/char_2009.gif) 5, 1
5, 1![[thin space (1/6-em)]](https://www.rsc.org/images/entities/char_2009.gif) :
:![[thin space (1/6-em)]](https://www.rsc.org/images/entities/char_2009.gif) 10 and 1
10 and 1![[thin space (1/6-em)]](https://www.rsc.org/images/entities/char_2009.gif) :
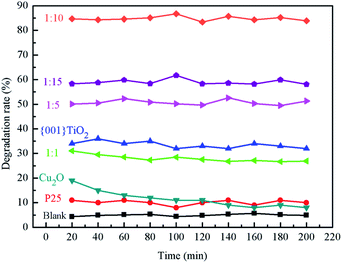
:![[thin space (1/6-em)]](https://www.rsc.org/images/entities/char_2009.gif) 15 were 5%, 10%, 32%, 30%, 51%, 85% and 59%, respectively, and the degradation rate of blank carrier for ammonia gas was about 5%, which indicates that the adsorption effect of carrier on ammonia was not obvious. P25, Cu2O, 1
15 were 5%, 10%, 32%, 30%, 51%, 85% and 59%, respectively, and the degradation rate of blank carrier for ammonia gas was about 5%, which indicates that the adsorption effect of carrier on ammonia was not obvious. P25, Cu2O, 1![[thin space (1/6-em)]](https://www.rsc.org/images/entities/char_2009.gif) :
:![[thin space (1/6-em)]](https://www.rsc.org/images/entities/char_2009.gif) 1 and {001}TiO2 have low degradation rates for ammonia, because P25 and {001}TiO2 have low utilization of sunlight. 1
1 and {001}TiO2 have low degradation rates for ammonia, because P25 and {001}TiO2 have low utilization of sunlight. 1![[thin space (1/6-em)]](https://www.rsc.org/images/entities/char_2009.gif) :
:![[thin space (1/6-em)]](https://www.rsc.org/images/entities/char_2009.gif) 1 was because the Cu2O content in the composite catalyst accounts for leadingly, although Cu2O itself has a strong light absorption, it is difficult to directly oxidize water to produce hydroxyl radicals, which makes it almost only adsorbent to ammonia. When the content of {001}TiO2 in the composite catalyst gradually increased, the degradation performance of the composite catalyst for ammonia gas gradually improved, among which the degradation rate of 1
1 was because the Cu2O content in the composite catalyst accounts for leadingly, although Cu2O itself has a strong light absorption, it is difficult to directly oxidize water to produce hydroxyl radicals, which makes it almost only adsorbent to ammonia. When the content of {001}TiO2 in the composite catalyst gradually increased, the degradation performance of the composite catalyst for ammonia gas gradually improved, among which the degradation rate of 1![[thin space (1/6-em)]](https://www.rsc.org/images/entities/char_2009.gif) :
:![[thin space (1/6-em)]](https://www.rsc.org/images/entities/char_2009.gif) 10 was the highest due to the maximum specific surface area.
10 was the highest due to the maximum specific surface area.
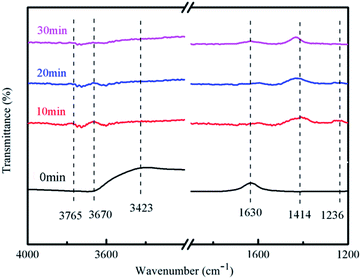
It can be seen from Fig. 12 that the absorption peak at 1236 cm−1 gradually disappeared and the ammonia molecules connected to the Lewis acid site on the catalyst surface also gradually disappeared with the extension of the reaction time. The ammonia gas in the reaction tube was not detected after the reaction for 30 min.
There had no peak at 1414 cm−1 and 3423 cm−1 at 0 min, but peaks were detected at 10, 20, and 30 minutes of reaction, which indicated that the associated hydroxyl radicals on the catalyst surface will be consumed and NO3− was generated along with the reaction.
There had a peak at 1630 cm−1 at 0 min, but no peak was detected at 10, 20, and 30 min, which indicated that the adsorption of water on the surface of the catalyst will also participate in the reaction. This may be due to the strong absorption of light energy when the carriers are separated. Oxidative holes can oxidize water molecules to hydroxyl radicals. There had no peaks in the range of 3670–3675 cm−1 at 0 min, but had peaks at 10 and 20 min of reaction, which indicates that free hydroxyl radicals were generated during the reaction process, and at 30 min there was no peak that because the reaction has been completed. H. M. Wu et al. pointed out that the product distribution during the photocatalytic oxidation of NH3, N2 was found to be the main gaseous product;36 N2O, NO2− and NO3− were registered as the major by-products. In our experiment, we found NO3− generation, because N2O and N2 are gases and cannot be detected, and NO2− will soon be oxidized and cannot be detected.
In general, the adsorption of water on the surface and the associated hydroxyl radicals participated in the reaction of degrading ammonia during the entire reaction process, and finally free hydroxyl radicals and NO3− were formed.
4. Conclusion
In this chapter, a chemical-impregnation method was used to prepare composite catalysts with different ratios of Cu2O/{001}TiO2 to degrade ammonia. The results showed that when the composite ratio was 1![[thin space (1/6-em)]](https://www.rsc.org/images/entities/char_2009.gif) :
:![[thin space (1/6-em)]](https://www.rsc.org/images/entities/char_2009.gif) 10, the catalyst has the largest specific surface area and the highest ammonia removal efficiency. During the whole reaction process, the surface adsorbed water and associated hydroxyl radicals participated in the reaction of degrading ammonia gas, and finally formed free hydroxyl radicals and NO3−.
10, the catalyst has the largest specific surface area and the highest ammonia removal efficiency. During the whole reaction process, the surface adsorbed water and associated hydroxyl radicals participated in the reaction of degrading ammonia gas, and finally formed free hydroxyl radicals and NO3−.
Conflicts of interest
There are no conflicts to declare.Acknowledgements
This work was financially supported by Chongqing Technology Innovation and Application Demonstration Special Social and People's Livelihood Key Research and Development Project (cstc2018jscx-mszdX0045), Special Project for Performance Guidance of Scientific Research Institution in Chongqing (cstc2020jxjl20006), Chongqing Rongchang Agriculture and Animal Husbandry High-Tech Industry Research and Development Project (19248), the Earmarked Fund for Modern Agro-industry Technology Research System (CARS-35), and Scientific Observation and Experiment Station of Livestock Equipment Engineering in Southwest, Ministry of Agriculture. In addition, I would like to thank my wife Yi Hu for her support to my work.References
- J. Lelievel, J. S. Evans and M. Fnais, et al., Nature, 2015, 525, 367–371 CrossRef.
- S. E. Bauer, K. Tsigaridis and R. Miller, Geophys. Res. Lett., 2016, 43, 5394–5400 CrossRef.
- M. V. Damme, L. Clarisse and S. Whitburn, et al., Nature, 2018, 564, 99–103 CrossRef.
- Y. S. Wang, J. k. Zhang and L. L. Wang, Adv. Earth Sci., 2013, 28(03), 353–363 Search PubMed.
- G. Schauberger, M. Piringer and C. Mikovits, et al., Biosyst. Eng., 2018, 175, 106–114 CrossRef.
- Z. Y. Xu, M. G. Liu and M. S. Zhang, et al., Atmos. Chem. Phys., 2019, 19, 5605–5613 CrossRef CAS.
- Y. Y. Wu, B. G. Gu and J. W. Erisman, et al., Environ. Pollut., 2016, 218, 86–94 CrossRef CAS.
- S. H. Pu, D. B. Long and Z. H. Liu, et al., Catalysts, 2018, 8, 189 CrossRef.
- R. G. He, H. J. Liu and H. M. Liu, et al., J. Mater. Sci. Technol., 2020, 17, 145–151 Search PubMed.
- A. H. Kianfar and M. A. Arayesh, J. Environ. Chem. Eng., 2020, 8(1), 103640 CrossRef CAS.
- W. Y. Diao, H. Y. Cai and L. Wang, et al., ChemCatChem, 2020, 12(21), 5420–5429 CrossRef CAS.
- A. V. Hernández, R. A. E. Muñoz and F. J. M. Flores, et al., Mater. Sci. Semicond. Process., 2020, 114, 105082 CrossRef.
- M. Lettieri, D. Colangiuli and M. Masieri, et al., Build. Environ., 2019, 147, 506–516 CrossRef.
- G. Moupiya, M. Moumita and M. Samir, et al., J. Mol. Struct., 2020, 1211, 128076 CrossRef.
- H. Atout, D. Chebli and D. Tichit, et al., Mater. Res. Bull., 2017, 95, 578–587 CrossRef CAS.
- N. R. Khalid, A. Majid and M. Bilal Tahir, et al., Ceram. Int., 2017, 43, 14552–14571 CrossRef CAS.
- A. Busiakiewicz, A. Kisielewska and I. Piwonski, et al., Vacuum, 2019, 163, 248–254 CrossRef CAS.
- Y. L. Sui, L. Wu and S. K. Zhong, et al., Appl. Surf. Sci., 2019, 480, 810–816 CrossRef CAS.
- H. Park and W. Choi, J. Phys. Chem. B, 2004, 108(13), 4086–4093 CrossRef CAS.
- H. G. Yang, C. H. Sun and S. Z. Qiao, et al., Nature, 2008, 453(7195), 638–641 CrossRef CAS.
- B. Wang, L. Deng and L. Sun, et al., Sens. Actuators, B, 2018, 276, 57–64 CrossRef CAS.
- Q. Yang, M. Long and L. Tan, et al., ACS Appl. Mater. Interfaces, 2015, 7, 12719–12730 CrossRef CAS.
- X. M. Liu, L. M. Cao and W. Sun, et al., Res. Chem. Intermed., 2016, 42, 6289–6300 CrossRef CAS.
- J. D. Peng, H. H. Lin and C. T. Lee, et al., RSC Adv., 2016, 6, 14178–14191 RSC.
- X. Wen, M. Long and A. d. Tang, J. Electroanal. Chem., 2017, 785, 33–39 CrossRef CAS.
- K. Lv, Q. J. Xiang and J. G. Yu, Appl. Catal., B, 2011, 104, 275–281 CrossRef CAS.
- C. A. Damato, R. Giovannetti and M. Zannotti, et al., Appl. Surf. Sci., 2018, 441, 575–587 CrossRef CAS.
- Z. Y. Zhang, K. C. Liu and Y. N. Bao, et al., Appl. Catal., B, 2017, 203, 599–606 CrossRef CAS.
- L. Ying, Z. G. Xu and Y. C. Chu, et al., Appl. Catal., B, 2018, 224, 239–248 CrossRef.
- C. L. Yu, K. Yang and Q. Shu, et al., Chin. J. Catal., 2011, 32, 555–565 CrossRef CAS.
- C. T. Hou, B. Hu and J. M. Zhu, Catalysts, 2018, 8, 575 CrossRef.
- B. X. Li and Y. F. Wang, Superlattices Microstruct., 2010, 47, 615–623 CrossRef CAS.
- L. Qiu, D. D. Pang and C. L. Zhang, et al., Appl. Surf. Sci., 2015, 357, 189–196 CrossRef CAS.
- M. A. Debeila, N. J. Coville and M. S. Scurrell, et al., Appl. Catal., A, 2005, 291(1–2), 98–115 CrossRef CAS.
- S. Yamazoe, T. Okumura and Y. Hitomi, et al., J. Phys. Chem. C, 2007, 111(29), 11077–11085 CrossRef CAS.
- H. M. Wu, J. Z. Ma and Y. B. Li, et al., Appl. Catal., B, 2014,(152–153), 82–87 CrossRef.
- L. Yang, Z. G. Miao and K. R. Zhu, et al., Appl. Surf. Sci., 2017, 391, 353–359 CrossRef CAS.
| This journal is © The Royal Society of Chemistry 2021 |

