 Open Access Article
Small functionalized iron oxide nanoparticles for dual brain magnetic resonance imaging and fluorescence imaging†
Ruixue Wei*a,
Yang Liua,
Jinhao Gao b,
V. Wee Yongc and
Mengzhou Xue
 *a
*a
aDepartment of Cerebrovascular Diseases, The Second Affiliated Hospital of Zhengzhou University, 2 Jingba Road, Zhengzhou 450052, Henan 450001, China. E-mail: xuemengzhou@zzu.edu.cn
bState Key Laboratory of Physical Chemistry of Solid Surfaces, The MOE Laboratory of Spectrochemical Analysis & Instrumentation, The Key Laboratory for Chemical Biology of Fujian Province, College of Chemistry and Chemical Engineering, Xiamen University, Xiamen 361005, China
cHotchkiss Brain Institute and Department of Clinical Neurosciences, University of Calgary, Calgary, Alberta, Canada
First published on 6th April 2021
Abstract
The diagnosis of brain diseases is the first key step in effective treatment. In vivo imaging tracers that effectively cross the blood–brain barrier (BBB) and reach areas of brain dysregulation is one focus of accurate diagnosis. Here, our main objective was to develop an iron-based nanoparticle for dual brain magnetic resonance imaging (MRI) and fluorescence imaging studies. Small sized iron oxide nanoparticles (SIONs) were prepared by a solvothermal method. Angiopep-2 was covalently connected to the surface of SIONs to enhance penetration of the BBB. The photosensitizer (chlorin e6, Ce6) was modified on the surface of SIONs to enhance fluorescence imaging to corroborate MRI results. We found that the resultant SIONs@ANG/Ce6/PEG displayed good biocompatibility and excellent MRI and fluorescence detection. Moreover, dual-modal MR/fluorescence imaging demonstrated that SIONs@ANG/Ce6/PEG had high sensitivity and accuracy in imaging of mouse with brain tumors. This work provides a strategy to design dual-modal contrast agents for diagnosis of brain disease.
Introduction
Magnetic resonance imaging (MRI) has been widely used in the diagnosis of brain diseases due to its non-invasive charcteristics and high spatial resolution.1–3 At present, 40% to 50% of MRI examinations have used contrast agents to improve sensitivity,4,5 including in diagnosis of brain tumors. Iron-based nanoparticles play a vital role in the field of MRI because of their nontoxic and excellent biocompatible properties.6–10 Nevertheless, the presence of the blood–brain barrier (BBB) limits the penetration of tracers, which poses a challenge to brain MRI. The BBB is constituted of brain capillary endothelial cells (ECs), extracellular matrix protein-rich basement membranes, pericytes, and the endfeet of astrocytes.11,12 These and the tight junctions (TJs) of endothelial cells severely limit the paracellular diffusion of water-soluble agents. Thus, the BBB is a physiologic barrier that limits the passage of most molecules in order to protect the stability of the brain.13,14 Similarly, the BBB limits the entry into the brain of many contrast agents that could improve the diagnosis and evaluation of brain diseases, including brain tumors.The surface of iron oxide nanoparticles can be functionalized with various targeting ligands to pass through the BBB. In addition, iron oxide nanoparticles play a vital role in the field of brain MRI, due to their excellent magnetic properties and ideal biocompatibility.7,15 Nanoparticles containing brain tumor targeting ligands such as cRGD peptides,16 antibody to EGFRvIII,17 transferrin,18,19 and chlorotoxin (CTX)20 can be targeted to glioma tumors that originate within the central nervous system.21–24 The angiopep family of peptides can also cross the BBB via a low-density lipoprotein receptor-related protein (LRP) mediated pathway.13,25 Among them, angiopep-2 with a molecular weight of 2.4 kDa promotes receptor-mediated transport through LRP1, resulting in higher in vivo and in vitro transcytosis capacity than other targeting ligands.26,27 Angiopep-2 can also target gliomas due to the high expression of LPR1 on the surface of glioma cells. Therefore, angiopep-2 has dual targeting capabilities of traversing the BBB and labeling gliomas, and this has generated great interest of in their potential use.
To improve upon nanoparticle-based delivery into the brain, several strategies for the diagnosis and treatment of brain tumors have been employed.28–31 For instance, the median overall survival time of O6-benzylguanine (BG) modified superparamagnetic iron oxide nanoparticles was extended 3 times over that of the control group.20 Besides, magnetic nanoparticles modified with polyethyleneimine (PEI) were constructed for drug delivery or gene loading and the accumulation in tumor sites by carotid injection was 30 times higher than that of intravenous injection.32 The transferrin modified gold nanoparticles prepared by Davis et al. can promote the transport of nanoparticles across the BBB.18 The Kataoka and his co-workers constructed a self-assembled supramolecular nanocarrier with glucose on its surface.33 This system can target glucose transporter 1, which is highly expressed on brain capillary endothelial cells, and therefore allowing more accumulation in the brain. These studies have demonstrated that nanoparticles coated with targeting ligand can effectively improve the ability of nanoparticles to across the BBB.
Herein, we sought to improve iron-based nanoparticle for brain MR imaging. First, we synthesized small sized iron oxide nanoparticles (SIONs) by solvothermal method. The SIONs serve as T1–T2 dual modal MR contrast agents at low field. In addition, we modified SIONs by BBB targeting ligand and photosensitizer, angiopep-2 and chlorin e6 (Ce6), respectively, and incorporated PEG. Our results show that SIONs@ANG/Ce6/PEG achieves dual-modal imaging suitable for detection and imaging of experimental mice brain tumors.
Results and discussion
Synthesis and characterization of SIONs@ANG/Ce6/PEG
The procedure of synthesizing SIONs@ANG/Ce6/PEG is illustrated in Fig. 1a. Firstly, the SIONs were prepared according to a previously reported solvothermal method.34,35 Subsequently, alendronate sodium was used to modify the SIONs to improve their solubility in water (SIONs@NH2). Lastly, carboxyl-terminated PEG (mPEG2000–COOH), angiopep-2, and chlorin e6 (Ce6) were conjugated to the surface of SIONs@NH2, yielding SIONs@ANG/Ce6/PEG.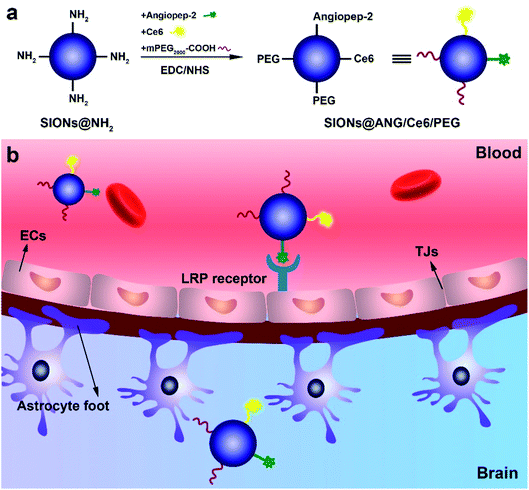 | ||
| Fig. 1 (a) Schematic illustration of the synthesis of SIONs@ANG/Ce6/PEG. (b) Schematic of SIONs@ANG/Ce6/PEG transport across the blood–brain barrier (BBB) due to LRP1 receptor mediated transcytosis. | ||
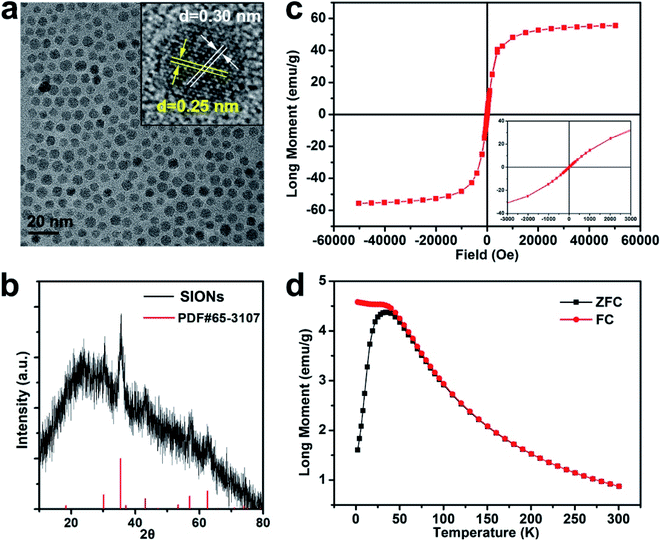
The transmission electron microscope (TEM) image of SIONs revealed their spherical morphology and narrow size distribution (about 4.5 nm in diameter, Fig. 2a). The high-resolution TEM (HRTEM) image revealed that the lattice spacing distance of approximately 0.30 nm and 0.25 nm could be indexed to the {220} and {311} plane of magnetite, respectively (the inset of Fig. 2a). Dynamic light scattering (DLS) analysis showed that the hydrodynamic diameters (HDs) of SIONs@NH2 and SIONs@ANG/Ce6/PEG were about 5.6 nm and 24.3 nm, respectively (Fig. S-1a† in the ESM and Table 1). The zeta potential of SIONs@ANG/Ce6/PEG (−25.7 mV) was slightly higher than that of SIONs@NH2 (−32.8 mV) (Fig. S-1b and c† in the ESM and Table 1), which may be due to the contribution of PEG. The stability of nanomaterials is important for their biomedical applications. We then investigated the stability of SIONs@ANG/Ce6/PEG in serum solution (Fig. S-2 in the ESI†). The HDs of SIONs@ANG/Ce6/PEG were almost unchanged before and after incubated with 10% (v/v) fetal bovine serum (FBS) solution. The result suggested the good stability in FBS solution. The X-ray diffraction (XRD) patterns indicated the typical magnetite structure (JCPDS no. 65-3107, Fig. 2b).
| Sample | HD/nm | PDI | Zeta potential/mV |
|---|---|---|---|
| SIONs@NH2 | 5.6 ± 2.5 | 0.339 | −32.8 |
| SIONs@ANG/Ce6/PEG | 24.3 ± 1.7 | 0.217 | −25.7 |
We also used UV-vis spectrometry and fluorescence spectrum to assess the changes after modification by angiopep-2 and Ce6 (Fig. S-3 in the ESM†). The UV-vis results suggested that angiopep-2 and Ce6 were successfully coordinated on the surface of SIONs. The fluorescence spectrum of SIONs@ANG/Ce6/PEG further indicated the successful anchoring of Ce6 on the surface of SIONs (Fig. S-5 in the ESM†). The modification of SIONs surface was further confirmed by Fourier transform infrared (FT-IR) spectroscopy (Fig. S-6 in ESI†). The peak of 592 cm−1 was attributed to the vibration of Fe–O. The peaks of 2850 cm−1 and 2920 cm−1 belong to stretching vibration of saturated C–H, which supported the presence of C17H31COO– coated on the surface of SIONs. For SIONs@NH2, the strong tightening of P![[double bond, length as m-dash]](https://www.rsc.org/images/entities/char_e001.gif) O and P–O vibration bands around 1044 cm−1 and 1144 cm−1, which is characteristic of the chelation of phosphorus species on a metallic surface, indicating a coordination of phosphonates as chelating groups. The peak of 1631 cm−1 was affiliate to the bending vibration bands of –NH2. In addition, the stretching vibration of saturated C–H disappeared. These results indicated that alendronate was successfully grafted onto the surface of SIONs through the phosphonate groups. For SIONs@ANG/Ce6/PEG, the absorption band at 1642 cm−1 attributed to stretching vibration of –NH. In contrast to the spectrum of SIONs@NH2, the stretching vibration of saturated C–H reappeared, which indicated the conjugation of PEG. The peaks at 3404 cm−1 and 1384 cm−1 showed conjugation of Ce6. These results suggested that the successful functionalization of SIONs by angiopep-2, Ce6, and PEG. Next, we used UV-vis spectrometry to evaluate the amount of angiopep-2 and Ce6 loaded on the surface of SIONs@NH2. After subtracting the absorption background of SIONs@NH2, the loading capacity was evaluated by calibration curve of free Ce6 (Fig. S-4 in the ESI†). The loading capacity of angiopep-2 was estimated by subtracting the unloaded dose from the total dose. Each magnetite nanoparticle could load about 37 angiopep-2 molecules and 52 Ce6 molecules.
O and P–O vibration bands around 1044 cm−1 and 1144 cm−1, which is characteristic of the chelation of phosphorus species on a metallic surface, indicating a coordination of phosphonates as chelating groups. The peak of 1631 cm−1 was affiliate to the bending vibration bands of –NH2. In addition, the stretching vibration of saturated C–H disappeared. These results indicated that alendronate was successfully grafted onto the surface of SIONs through the phosphonate groups. For SIONs@ANG/Ce6/PEG, the absorption band at 1642 cm−1 attributed to stretching vibration of –NH. In contrast to the spectrum of SIONs@NH2, the stretching vibration of saturated C–H reappeared, which indicated the conjugation of PEG. The peaks at 3404 cm−1 and 1384 cm−1 showed conjugation of Ce6. These results suggested that the successful functionalization of SIONs by angiopep-2, Ce6, and PEG. Next, we used UV-vis spectrometry to evaluate the amount of angiopep-2 and Ce6 loaded on the surface of SIONs@NH2. After subtracting the absorption background of SIONs@NH2, the loading capacity was evaluated by calibration curve of free Ce6 (Fig. S-4 in the ESI†). The loading capacity of angiopep-2 was estimated by subtracting the unloaded dose from the total dose. Each magnetite nanoparticle could load about 37 angiopep-2 molecules and 52 Ce6 molecules.
Magnetic properties and relaxivity measurements of SIONs
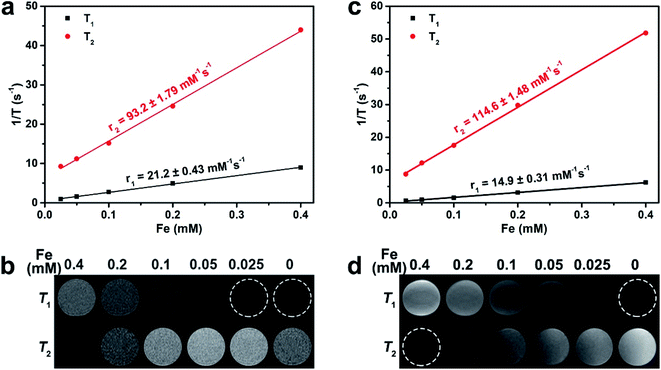
Magnetic behavior of SIONs was measured at a magnetic field of 5 T by using a superconducting quantum interference device (SQUID) at 300 K. The magnetic saturation moments (MS) value of SIONs was 55.3 emu g−1 (Fig. 2c). The field-dependent magnetization curves (M–H) indicated that SIONs exhibit typical superparamagnetic behavior at 300 K (Fig. 2c, and inset). Additionally, standard zero-field cooling (ZFC) and field cooling (FC) measurements for SIONs showed a blocking temperature (TB) of about 50 K, which suggests superparamagnetic characteristics of SIONs at room temperature (Fig. 2d).To evaluate the MR contrast ability of SIONs, the longitudinal relaxivity (r1) and transverse relaxivity (r2) values were measured on a 0.5 T MRI scanner (Fig. 3a and Table 2). The r1 and r2 values as a function of cFe for SIONs were 21.2 ± 0.43 mM−1 s−1 and 93.2 ± 1.79 mM−1 s−1, respectively. r2/r1 ratio is a key reference to predict whether a contrast agent is suitable for T1- or T2-dominated MR imaging.36,37 Generally, a high r2/r1 ratio (>10) will result in a T2 performance dominance, while a low r2/r1 ratio (<5) will result in a T1 performance dominance.3,38 The r2/r1 ratio of SIONs was 4.4, indicating that SIONs can serve as a T1–T2 dual-modal contrast agent. SIONs showed increased signals in T1-weighted phantom images and reduced signals in T2-weighted phantom images at 0.5 T with increased iron concentrations (Fig. 3b and Table 2). We also measured the relaxation performance of SIONs at 1.5 T (Fig. 3c and d), because the relaxation efficiency of magnetic nanomaterials is closely related to the magnetic field strength. The r1 and r2 value were 14.9 ± 0.31 mM−1 s−1 and 114.6 ± 1.48 mM−1 s−1, respectively. The r2/r1 ratio was 7.9, which was higher than the result at 0.5 T. These phenomena further indicated that SIONs may possess the T1–T2 dual-modal MR contrast ability at low magnetic field.
| Magnetic field | Relaxivity | |
|---|---|---|
| 0.5 T | r2 (mM−1 s−1) | 93.2 ± 1.79 |
| r1 (mM−1 s−1) | 21.2 ± 0.43 | |
| r2/r1 | 4.4 | |
| 1.5 T | r2 (mM−1 s−1) | 114.6 ± 1.48 |
| r1 (mM−1 s−1) | 14.9 ± 0.31 | |
| r2/r1 | 7.9 | |
According to SBM theory, longitudinal relaxation is closely related to the direct chemical exchange between water protons and surface paramagnetic ions.39,40 Small-sized nanoparticles have higher surface-area-to-volume ratios than large-sized nanoparticles and then exposed more iron ions, which enhances the chemical exchange and improves their performance in shortening the spin-lattice relaxation. Therefore, small-sized iron-based nanoparticles were more likely to exhibit T1 performance than large-sized nanoparticles due to more paramagnetic ions on the surface. r2 relaxivity of contrast agent can be calculated by using the following formula:41,42  (γ: the magnetic ratio constant, D: the diffusion constant of water protons, L: the thickness of an impermeable surface of magnetic nanoparticles, V*: the effective volume fraction, MS: the saturation magnetization, and r: the effective radius). Generally, γ, D and L are constant. V* is related to the concentration of contrast agent and is also constant in practice. The T2 relaxation performance of the contrast agent mainly depends on MS and r. Therefore, the surface paramagnetic ions and the suitable MS values of SIONs indicated that SIONs may have the T1–T2 dual-modal MR contrast capability under a low magnetic field.
Biocompatibility of SIONs
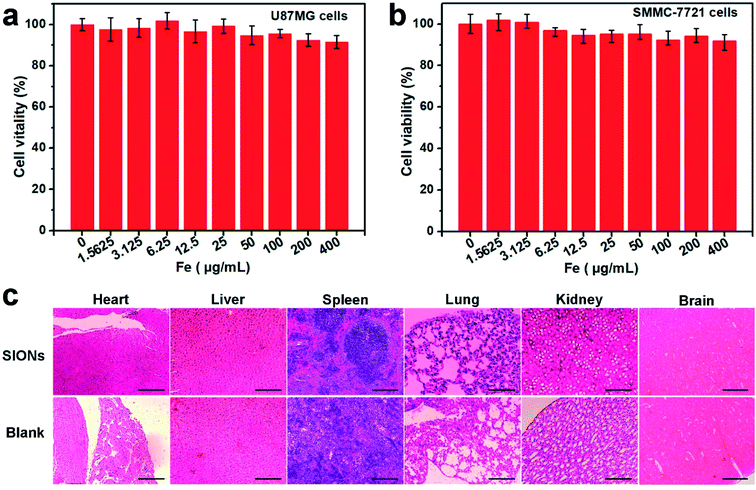
Next, we focused on the biocompatibility of SIONs. The cell cytotoxicity was evaluated with U87MG cells and SMMC-7721 cells by tetrazolium-based colorimetric (MTT) assays (Fig. 4a and b). After 24 h of incubation, cell viability exceeded 90% even at 400 μg [Fe] mL−1. The toxicity of SIONs in vivo was further investigated by histological analysis. After intravenous injection of SIONs at a dose of 20 mg Fe per kg, we collected several organs of nude mice for hematoxylin and eosin (H&E) staining (Fig. 4c). There were no apparent cell necrosis and apoptosis in the sections of organs. To further evaluate red blood cells compatibility under SIONs administration, a standard hemolysis assay was performed as Fig. S-7† in the ESM. The diluted red blood cells were exposed to SIONs at a concentration gradient and no significant hemolysis effect were observed at even 3.6 mM [Fe] till 4 h incubation, which demonstrated ideal blood stability of the SIONs. These results suggest that SIONs exhibit excellent biocompatibility which permit their further biological application.In vivo fluorescence and MR imaging
We further investigated the ability of SIONs@ANG/Ce6/PEG to cross the BBB into brain. Considering the fluorescent property of Ce6, we performed in vivo fluorescence imaging (Fig. 5) of nude mice after intravenous injection of the SIONs@ANG/Ce6/PEG or free Ce6 at the same dose of 2 mg Ce6 per kg body weight, respectively. All animal procedures were performed in accordance with the Guidelines for Care and Use of Laboratory Animals of Zhengzhou University and approved by the Animal Ethics Committee of The Second Affiliated Hospital of Zhengzhou University. After 1.5 h post injection, the increased fluorescence signal of brain indicates that SIONs@ANG/Ce6/PEG can successfully cross BBB. In contrast, the mice injected with free Ce6 showed scarcely visible fluorescence signals in brain, because of the inability of free Ce6 to cross the BBB.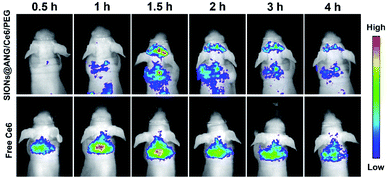 | ||
| Fig. 5 In vivo fluorescence images of nude mice taken at different time points after intravenous injection of SIONs@ANG/Ce6/PEG or free Ce6 at the same dose of 2 mg Ce6 per kg body weight. | ||
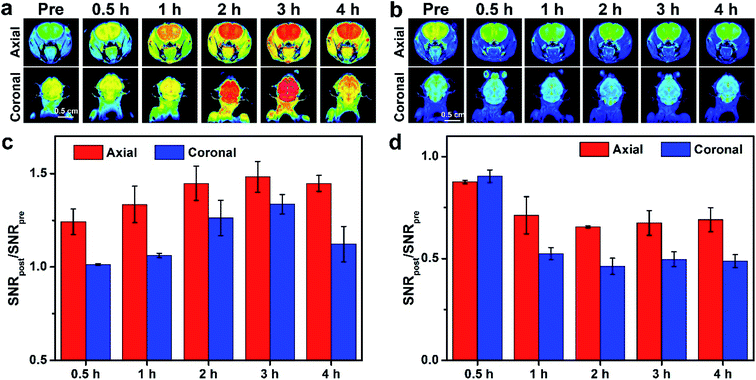
To assess the T1/T2 contrast performance of SIONs@ANG/Ce6/PEG, in vivo MR imaging of the brain of nude mice was performed on a 9.4 T MRI scanner. After tail vein injection of SIONs@ANG/Ce6/PEG, T1-weighted and T2-weighted images were acquired at different time points (Fig. 6a and b). Remarkable T1 signals were observed in brain region at 2 h post injection, and the bright signal in brain lasted for about 4 h post injection. Fig. 5c showed the quantitative analysis of brain after injection of SIONs@ANG/Ce6/PEG. The SNRpost/SNRpre increased after intravenous injection, and reached 1.45 ± 0.10, 1.48 ± 0.08, and 1.44 ± 0.04 at 2, 3, and 4 h post injection for the transverse plane, respectively. The SNRpost/SNRpre values were 1.27 ± 0.09, 1.34 ± 0.05, and 1.12 ± 0.09 at 2, 3, and 4 h post injection for the coronal plane, respectively. T2-weighted imaging also indicated dark signal in brain after 2 h post injection. The SNRpost/SNRpre values at 2, 3, and 4 h after injection were 0.6551 ± 0.01, 0.67 ± 0.06, and 0.69 ± 0.06 for the transverse plane, and 0.46 ± 0.04, 0.49 ± 0.04, and 0.48 ± 0.03 for the coronal plane, respectively. The MRI manifested that SIONs@ANG/Ce6/PEG could cross the BBB and reach the brain region, which was consistent with the result of fluorescence imaging. Thus, SIONs@ANG/Ce6/PEG is a potential candidate for brain MR contrast agents.
In vivo biodistribution analysis
The biodistribution of nanoparticles are crucial in in vivo biomedical applications. We assessed the biodistribution of iron in nude mice after administration of SIONs@NH2 and SIONs@ANG/Ce6/PEG, and measured by inductively coupled plasma mass spectromtry (ICP-MS). We observed higher iron accumulation in the brain after administration of SIONs@ANG/Ce6/PEG than that of SIONs@NH2 (Fig. S-8† in the ESM). The biodistribution of iron further indicated that the targeting properties of the SIONs@ANG/Ce6/PEG due to the conjugation of angiopep-2.Experimental section
Materials
All chemicals were purchased from various vendors and used as received without further purification: alendronate sodium (98%), iron(II) chloride tetrahydrate (98%), and chlorin e6 (Ce6) were purchased from Sigma-Aldrich. Oleic acid (tech 90%) were purchased from Alfa Aesar. Ammonium iron(II) sulfate and ethyl alcohol were purchased from Sinopharm Chemical Reagent. mPEG–COOH (MW = 2000) was purchased from Biomatrik (China). 1-(3-Dimethylaminopropyl)-3-ethylcarbodiimide hydrochloride (EDC) and N-hydroxysuccinimide (NHS) were purchased from Thermo Fisher Scientific.Characterization
Transmission electron microscopy (TEM) and high-resolution TEM (HRTEM) images were captured on a JEM-2100 microscope at an accelerating voltage of 200 kV. Element analysis of Fe in the samples were conducted by inductively coupled plasma atomic emission spectroscopy (ICP-AES). X-ray powder diffraction (XRD) patterns were obtained on a Rigaku UltimaIV X-ray diffractometer, equipped with a Cu Kα radiation source (λ = 0.15418 nm). Field-dependent magnetization curves (M–H curves) were obtained via a superconducting quantum interference device (SQUID). Hydrodynamic diameters of nanoparticles were measured via dynamic light scattering (DLS) on a Malvern Zetasizer nano ZS instrument. MRI measurements and T1/T2 relaxation time measurements were carried out on a 20 MHz NMR120-Analyst NMT Analyzing&Imaging system (Niumag Corporation, Shanghai). In vivo MR images were obtained on a 9.4 T MRI scanner system (Philips Medical System).Synthesis of small sized iron oxide nanoparticles (SIONs)
The synthesis of iron oxide nanoparticles was carried out according to a modification of solvothermal method. In a typical synthesis, 1 g of NaOH, 10 mL of H2O, 10 mL of ethanol, and 10 mL of oleic acid (OA) were mixed together to form a uniform microemulsion. 10 mL 0.5 M of FeCl2·4H2O aqueous solution was then added after stirring for 0.5 h. The resulting solution was stirred for 2 min before transfer into an autoclave and kept at 170 °C for 10 h. After the system cooled to room temperature, ethanol was added to precipitate iron oxide nanoparticles. The black product was then washed three times with ethanol and well-dispersed in hexane.Preparation of NH2 modified SIONs
Forty milligram of alendronate sodium was dissolved in 4 mL of deionized water, and the pH was adjusted to 7.5. Four mL of acetone was then added followed by 2 mL of n-hexane containing 10 mg of IO nanoparticles. The resulting solution was heated to 60 °C under a N2 atmosphere for 2 h. The NH2 modified IO nanoparticles were obtained by centrifugation, re-dispersed in deionized water, and stored at 4 °C. The product was abbreviated as SIONs@NH2.Preparation of SIONs@ANG/Ce6/PEG
Ten mg of EDC and 10 mg NHS were dissolved in 4 mL of DMSO; 1 mg angiopep-2, 1 mg of Ce6, 5 mg of mPEG2000–COOH were added after dissolution. The resulting solution was stirred for 1 h at room temperature to activate the carboxyl group. Then, 4 mL of deionized water containing 10 mg of SIONs@NH2 was added. After stirring for 24 h, SIONs@ANG/Ce6/PEG was collected by ultrafiltration, re-dispersed in PBS (1×, pH 7.4), and stored at 4 °C.Relaxivity measurement and MRI phantom studies of SIONs@NH2
T1 and T2 relaxation time and T1/T2-wighted phantom images of SIONs@NH2 were acquired on a 0.5 T NMI20-Analyst NMR Analyzing and Imaging system. The samples were dispersed in PBS (1×, pH 7.4) with different Fe concentrations at 0.4, 0.2, 0.1, 0.05, 0.025 mM. The r1 and r2 were calculated from the slopes of the best fitted lines of 1/T versus iron. The T1-/T2-weighted phantom images were acquired with the following parameters: TR/TE = 200/2 ms (T1), TR/TE = 2000/40 ms (T2), NS = 2.In vitro cytotoxicity assay
U87MG cells were purchased from the Cell Bank of the Chinese Academy of Sciences (Shanghai, China). Cytotoxicity was assessed via 3-(4,5-dimethylthiazol-2-yl)-2,5-diphenyltetrazolium bromide (MTT) assay. Typically, U87MG cells (n = 5 per group) were seeded into 96-well plates at 5 × 10³ cells per well and incubated for 24 h. The cells were then incubated with SIONs@NH2 for 24 h at different concentrations (0, 1.5625, 3.125, 6.25, 12.5, 25, 50, 100, 200 and 400 μg mL−1 for Fe). After the medium of each well was replaced by 100 μL of fresh media containing MTT (0.5 mg mL−1), the cells were incubated for 4 h. Finally, the medium was removed and 100 μL of DMSO was added to completely dissolve the resulting violet crystals. The absorbance of each well at 492 nm was measured on a Multiskan FC microplate reader. The cell viability at different concentrations was calculated accordingly.In vivo fluorescence imaging study
All animal procedures were performed in accordance with the Guidelines for Care and Use of Laboratory Animals of Zhengzhou University and approved by the Animal Ethics Committee of The Second Affiliated Hospital of Zhengzhou University. In vivo fluorescence imaging was carried out on an IVIS Lumina II. Nude male mice (18–22 g) were intravenously injected with SIONs@ANG/Ce6/PEG and free Ce6 at a dose of 2 mg Ce6 per kg. The mice were imaged by fluorescence imaging system before and at 0.5, 1, 1.5, 2, 3, and 4 h post injection.In vivo MRI study
All animal procedures were performed in accordance with the Guidelines for Care and Use of Laboratory Animals of Zhengzhou University and approved by the Animal Ethics Committee of The Second Affiliated Hospital of Zhengzhou University. MR imaging was performed on a 9.4 T MRI scanner. Male nude mice (body weight: 18–22 g) were used for in vivo MR imaging (n = 3 per group). SIONs@ANG/Ce6/PEG were injected intravenously via the tail vein into nude mice at a dose of 2 mg iron per kg. The T1-/T2-weighted MR images were acquired at different times after administration using FSEMS and FSE sequence, respectively. The parameters were as follows: TR/TE (T1) = 500/14 ms, TR/TE (T2) = 3000/4 ms, thickness = 1.5 mm, data matrix (RO × PE) = 256 × 256. SNR was calculated by the following equation:| SNRbrain = SIbrain/SDnoises |
Biodistribution study
Male nude mice (body weight: 18–22 g) were utilized for performing the biodistribution of SIONs and SIONs@ANG/Ce6/PEG. SIONs and SIONs@ANG/Ce6/PEG were tail vein intravenously injected into mice at dose of 20 mg iron per kg (n = 3 per group). 20 mg of brain, heart, liver, spleen, lung, and kidney were collected at 2 h after injection for biodistribution using inductively coupled plasma mass spectromtry (ICP-MS).Conclusions
In conclusion, we developed iron-based nanoparticles for brain dual-modal MR and fluorescence imaging. Uniform and monodisperse SIONs were synthesized by solvothermal method. Relaxivity measurements and in vitro phantom imaging demonstrate the excellent T1 and T2 contrast performance of SIONs at low magnetic field, which is attributed to the suitable magnetization and surface paramagnetic ions of SIONs. More importantly, the outstanding biocompatibility of SIONs@ANG/Ce6/PEG allows its further biological application. After modification by BBB targeted peptide angiopep-2, SIONs@ANG/Ce6/PEG transports across the in vivo BBB of nude mice. SIONs@ANG/Ce6/PEG can be used for in vivo fluorescence due to the conjugation of Ce6. The targeting performance of SIONs@ANG/Ce6/PEG was manifested by in vivo fluorescence and MR imaging. In summary, we believe that SIONs@ANG/Ce6/PEG hold great potential in brain MR imaging.Conflicts of interest
There are no conflicts to declare.Acknowledgements
The authors acknowledge operating grant support from the National Natural Science Foundation of China (81870942, 81471174 and 81520108011), National Key Research and Development Program of China (2018YFC1312200), Funded by China Postdoctoral Science Foundation (2020TQ0289), and Innovation Scientists and Technicians Troop Constructions Projects of Henan Province of China (for MX).Notes and references
- R. Wei, Z. Cai, B. W. Ren, A. Li, H. Lin, K. Zhang, H. Chen, H. Shan, H. Ai and J. Gao, Chem. Mater., 2018, 30, 7950–7961 CrossRef CAS.
- W. Liu, G. Deng, D. Wang, M. Chen, Z. Zhou, H. Yang and S. Yang, J. Mater. Chem. B, 2020, 8, 3087–3091 RSC.
- R. Wei, T. Zhou, C. Sun, H. Lin, L. Yang, B. W. Ren, Z. Chen and J. Gao, Nanoscale, 2018, 10, 18398–18406 RSC.
- J. H. Lee, Y. M. Huh, Y. W. Jun, J. W. Seo, J. T. Jang, H. T. Song, S. Kim, E. J. Cho, H. G. Yoon, J. S. Suh and J. Cheon, Nat. Med., 2007, 13, 95–99 CrossRef CAS PubMed.
- M. C. Cassidy, H. R. Chan, B. D. Ross, P. K. Bhattacharya and C. M. Marcus, Nat. Nanotechnol., 2013, 8, 363–368 CrossRef CAS PubMed.
- B. Zhou, H. Shan, D. Li, Z. B. Jiang, J. S. Qian, K. S. Zhu, M. S. Huang and X. C. Meng, Magn. Reson. Imag., 2010, 28, 394–399 CrossRef PubMed.
- L. Yang, Z. Zhou, J. Song and X. Chen, Chem. Soc. Rev., 2019, 48, 5140–5176 RSC.
- C. Jiang, G. Wang, R. Hein, N. Liu, X. Luo and J. J. Davis, Chem. Rev., 2020, 120, 3852–3889 CrossRef CAS PubMed.
- D. Anderson, T. Anderson and F. Fahmi, Phys. Status Solidi A, 2019, 216, 1801008 CrossRef.
- H. Fatima and K.-S. Kim, Adv. Powder Technol., 2018, 29, 2678–2685 CrossRef CAS.
- W. Tang, W. Fan, J. Lau, L. Deng, Z. Shen and X. Chen, Chem. Soc. Rev., 2019, 48, 2967–3014 RSC.
- J. B. Xie, Z. Y. Shen, Y. Anraku, K. Kataoka and X. Y. Chen, Biomaterials, 2019, 224, 119491 CrossRef CAS PubMed.
- X. X. Shi, W. M. Miao, D. W. Pang, J. S. Wu, Q. S. Tong, J. X. Li, J. Q. Luo, W. Y. Li, J. Z. Du and J. Wang, Biomater. Sci., 2020, 8, 1290–1297 RSC.
- W. M. Pardridge, Drug Discov. Today, 2001, 6, 381–383 CrossRef PubMed.
- R. Wei, Y. Xu and M. Xue, J. Mater. Chem. B, 2021, 9, 1965–1979 RSC.
- S. Richard, M. Boucher, Y. Lalatonne, S. Meriaux and L. Motte, Biochim. Biophys. Acta Gen. Subj., 2017, 1861, 1515–1520 CrossRef CAS PubMed.
- C. G. Hadjipanayis, R. Machaidze, M. Kaluzova, L. Wang, A. J. Schuette, H. Chen, X. Wu and H. Mao, Cancer Res., 2010, 70, 6303–6312 CrossRef CAS PubMed.
- A. J. Clark and M. E. Davis, Proc. Natl. Acad. Sci. U. S. A., 2015, 112, 12486–12491 CrossRef CAS PubMed.
- S. Ruan, L. Qin, W. Xiao, C. Hu, Y. Zhou, R. Wang, X. Sun, W. Yu, Q. He and H. Gao, Adv. Funct. Mater., 2018, 28, 1802227 CrossRef.
- Z. R. Stephen, F. M. Kievit, O. Veiseh, P. A. Chiarelli, C. Fang, K. Wang, S. J. Hatzinger, R. G. Ellenbogen, J. R. Silber and M. Zhang, ACS Nano, 2014, 8, 10383–10395 CrossRef CAS PubMed.
- P. Zhao, Y. Wang, X. Kang, A. Wu, W. Yin, Y. Tang, J. Wang, M. Zhang, Y. Duan and Y. Huang, Chem. Sci., 2018, 9, 2674–2689 RSC.
- D. Furtado, M. Bjornmalm, S. Ayton, A. I. Bush, K. Kempe and F. Caruso, Adv. Mater., 2018, 30, 1801362 CrossRef PubMed.
- S. M. Carvalho, A. G. Leonel, A. A. P. Mansur, I. C. Carvalho, K. Krambrock and H. S. Mansur, Biomater. Sci., 2019, 7, 2102–2122 RSC.
- Y. Yin, J. Wang, M. Yang, R. Du, G. Pontrelli, S. McGinty, G. Wang, T. Yin and Y. Wang, Nanoscale, 2020, 12, 2946–2960 RSC.
- H. Xin, X. Sha, X. Jiang, L. Chen, K. Law, J. Gu, Y. Chen, X. Wang and X. Fang, Biomaterials, 2012, 33, 1673–1681 CrossRef CAS PubMed.
- K. Shao, R. Huang, J. Li, L. Han, L. Ye, J. Lou and C. Jiang, J. Contr. Release, 2010, 147, 118–126 CrossRef CAS PubMed.
- M. Demeule, J.-C. Currie, Y. Bertrand, C. Che, T. Nguyen, A. Regina, R. Gabathuler, J.-P. Castaigne and R. Beliveau, J. Neurochem., 2008, 106, 1534–1544 CrossRef CAS PubMed.
- J. Xie, D. Gonzalez-Carter, T. A. Tockary, N. Nakamura, Y. Xue, M. Nakakido, H. Akiba, A. Dirisala, X. Liu, K. Toh, T. Yang, Z. Wang, S. Fukushima, J. Li, S. Quader, K. Tsumoto, T. Yokota, Y. Anraku and K. Kataoka, ACS Nano, 2020, 14, 6729–6742 CrossRef CAS PubMed.
- H. S. Min, H. J. Kim, M. Naito, S. Ogura, K. Toh, K. Hayashi, B. S. Kim, S. Fukushima, Y. Anraku, K. Miyata and K. Kataoka, Angew. Chem., Int. Ed., 2020, 59, 8173–8180 CrossRef CAS PubMed.
- Y. Wang, K. Wang, J. Zhao, X. Liu, J. Bu, X. Yan and R. Huang, J. Am. Chem. Soc., 2013, 135, 4799–4804 CrossRef CAS PubMed.
- I. U. Ali and X. Chen, ACS Nano, 2015, 9, 9470–9474 CrossRef CAS PubMed.
- B. Chertok, A. E. David and V. C. Yang, Biomaterials, 2010, 31, 6317–6324 CrossRef CAS PubMed.
- Y. Anraku, H. Kuwahara, Y. Fukusato, A. Mizoguchi, T. Ishii, K. Nitta, Y. Matsumoto, K. Toh, K. Miyata, S. Uchida, K. Nishina, K. Osada, K. Itaka, N. Nishiyama, H. Mizusawa, T. Yamasoba, T. Yokota and K. Kataoka, Nat. Commun., 2017, 8, 1001 CrossRef CAS PubMed.
- X. Wang, J. Zhuang, Q. Peng and Y. D. Li, Nature, 2005, 437, 121–124 CrossRef CAS PubMed.
- C. Li, R. Wei, Y. Xu, A. Sun and L. Wei, Nano Res., 2015, 7, 536–543 CrossRef.
- P. Caravan, J. J. Elliso, T. J. McMurry and R. B. Lauffer, Chem. Rev., 1999, 99, 2293–2352 CrossRef CAS PubMed.
- M. Lei, C. Fu, X. Cheng, B. Fu, N. Wu, Q. Zhang, A. Fu, J. Cheng, J. Gao and Z. Zhao, Adv. Funct. Mater., 2017, 27, 1700978 CrossRef.
- L. Yang, L. Ma, J. Xin, A. Li, C. Sun, R. Wei, B. W. Ren, Z. Chen, H. Lin and J. Gao, Chem. Mater., 2017, 29, 3038–3047 CrossRef CAS.
- I. Solomon, Phys. Rev., 1955, 99, 559–565 CrossRef CAS.
- N. Bloembergen and L. O. Morgan, J. Chem. Phys., 1961, 34, 842–850 CrossRef CAS.
- S. Tong, S. Hou, Z. Zheng, J. Zhou and G. Bao, Nano Lett., 2010, 10, 4607–4613 CrossRef CAS PubMed.
- Z. Zhao, Z. Zhou, J. Bao, Z. Wang, J. Hu, X. Chi, K. Ni, R. Wang, X. Chen, Z. Chen and J. Gao, Nat. Commun., 2013, 4, 2266 CrossRef PubMed.
Footnote |
| † Electronic supplementary information (ESI) available: Hydrodynamic diameter and zeta potential of SIONs@NH2 and SIONs@ANG/Ce6/PEG; fluorescence spectrum and UV-vis spectra of SIONs@ANG/Ce6/PEG. See DOI: 10.1039/d0ra10392f |
| This journal is © The Royal Society of Chemistry 2021 |

