 Open Access Article
The effects of Fe-doping on MnO2: phase transitions, defect structures and its influence on electrical properties
E. Hastuti ab,
A. Subhan
 c,
P. Amonpattaratkitd,
M. Zainuria and
S. Suasmoro
 *a
*a
aInstitute of Technology ‘Sepuluh Nopember’ Surabaya, Kampus ITS Sukolilo, Surabaya 60111, Indonesia. E-mail: suasm@its.ac.id; Fax: +62315943351; Tel: +6282245157676
bUniversitas Islam Negeri ‘Maulana Malik Ibrahim’ Malang, Indonesia
cResearch Center for Physics, Indonesian Institute for Science (LIPI), Serpong, Indonesia
dSynchroton Light Research Institute (Public Organisation), 111 University Avenue, Muang, Nakhon Ratchasima 30000, Thailand
First published on 17th February 2021
Abstract
The composition of Mn1−xFexO2 (x = 0–0.15) was synthesized by a hydrothermal method at 140 °C for 5 hours of reaction time. Investigations were carried out including XRD, FTIR, Raman spectroscopy, FESEM, and TEM for crystallographic phase analysis. Furthermore, XPS and XAS were used to analyze the oxidation states of Mn and dopant Fe in the octahedron sites. For electrical characterizations, an impedance analyzer was used to explore the conductivity and dielectric properties. It was discovered that the undoped MnO2 possessed an α-MnO2 structure performing (2 × 2) tunnel permitting K+ insertion and had a nanorod morphology. The Fe ion that was doped into MnO2 caused a phase transformation from α-MnO2 to Ramsdellite R-MnO2 after x = 0.15 was reached and the tunnel dimension changed to (2 × 1). Furthermore, this caused increased micro-strain and oxygen vacancies. An oxidation state analysis of Mn and substituted Fe in the octahedron sites found mixed 3+ and 4+ states. Electrical characterization revealed that the conductivity of Fe-doped MnO2 is potentially electron influenced by the oxidation state of the cations in the octahedron sites, the micro-strain, the dislocation density, and the movement of K+ ions in the tunnel.
1. Introduction
In recent years, manganese dioxide (MnO2) materials have attracted the attention of researchers due to its application in electrochemical energy storage electrodes, and also due to its novel chemical and physical properties as a result of its excellent structural flexibility.1 MnO2-Based electrodes store electric charge using a pseudocapacitive mechanism.2 The theoretical capacitance of manganese oxide can be up to 1300 F g−1,3 but the electrochemical reversibility of the redox transition of manganese dioxide is usually low in applications, and pure manganese dioxide has a poor capacitive response.3 Despite this, manganese oxide is seen as a potentially useful material for pseudocapacitors because of its low cost, abundance in the earth, and environmental friendliness.4With respect to the structure, manganese dioxide exhibits polymorphism with some crystal structures based on various linkages of basic [MnO6] octahedral units, comprising α-MnO2, β-MnO2, γ-MnO2, δ-MnO2, λ-MnO2, ε-MnO2, and R-MnO2, respectively.5 The different structures can be described by the size of the tunnel, which is determined by the number of octahedral subunits (n × m), where n and m stand for the dimensions of the tunnels in the two directions perpendicular to the chains of the edge-sharing octahedral MnO6.6 Among these, the nanostructure α-MnO2 shows the highest charge storage capacity, due to the occurrence of an edge-sharing MnO6 octahedral, leading to the formation of 1D (2 × 2) and (1 × 1) tunnels extended in a direction parallel to the c-axis of the tetragonal unit cell via linking at the corners.7,8 The (2 × 2) tunnels are stabilized by cations (K+, Li+, and Na+) and the (1 × 1) tunnels are unfilled.9
In order to enhance the properties, up until now, various synthesis methods have been developed, namely sol–gel,10 co-precipitation,11 electrodeposition,12 and hydrothermal reaction.13 These various methods are able to reduce the crystal size, enlarge the surface area for the enhancement of the ion diffusion rate8 and finally improve the supercapacitive performance of MnO2. Out of these methods of preparation, it appears that the hydrothermal method is the simplest and most inexpensive. Hydrothermal synthesis is challenging for producing diverse polymorphism in metal oxide crystalline systems that proceed at a low temperature.14 Furthermore, the Mn oxidation state was reported as an additional important factor in determining and optimizing the electrochemical properties. The charge storage mechanism arises from alternating between the Mn3+ and Mn4+ oxidation states at or near the surface of the MnO2 nanostructures, and this can lead to a slight distortion in the octahedral MnO6 structure, due to a Jahn–Teller effect.15 The electrochemical properties can be improved by doping with metal ions, such as V, Ru, Ag, Co, Ni, Sn, Cu2+, Co2+, Ni2+,16–21 and Fe.17,22,23 Among these ions, Fe can substitute for Mn or occupy the tunnels of MnO2 (ref. 24) and is highly beneficial for balancing the stabilization of the tunnel structures with a suitable amount of Fe-doped into MnO2. Wang25 reported that Fe-doped MnO2 nanostructures of different phases depend on the percentage of Fe (α-MnO2/R-MnO2/ε-MnO2) and that they obtained good rate capability of capacitance retention and high energy density. Fe can be considered as a transition metal that possesses multivalences of 2+, 3+ and, recently reported, 4+ in an octahedron environment.26 When the metal substitutes Mn in the octahedron site, it then create defects  ,
,  and FexMn, and
  for neutralization, and these will affect the electrical properties. Moreover, it decreases the average crystallite size, indicates the appearance of lattice strain, and disrupts chemical bonding, yielding a modification to the 3d configuration of either 3d4 Mn3+ or 3d5 Mn2+.
Considering the above-mentioned possible defects, it is intriguing to carry out further exploration of its presence in the sample. In this study, the lattice strain, oxidation state, and local structure were investigated. The study will focus on the structural evolution and defect structures as a result of the dopant quantity, and then the influence on the electrical properties. For this purpose, an MnO2 electrode material will be synthesized through a hydrothermal method with various concentrations of Fe2O3 dopant.
2. Experimental
2.1. Materials preparation
Undoped and Fe-doped (0.05–0.15 mole%) MnO2 samples were prepared by a hydrothermal method.For the synthesis of undoped MnO2, 3.32 mmol potassium permanganate (KMnO4) was dissolved in water (60 mL) at room temperature, and then concentrated HCl was added (37%, 2 mL). The mixture was stirred vigorously for several minutes and then transferred into a Teflon-lined stainless-steel autoclave (capacity of 100 mL). The autoclave was sealed and was maintained at 140 °C for 5 hours, before being cooled down to room temperature. To synthesize the Fe-doped samples, FeCl3·6H2O was used as a dopant reagent in the above solution and the method was carried out in a similar way. The precipitates were isolated by filtration and were washed with water and ethanol several times to remove possible impurities. The sample was then dried in an oven at 80 °C for 3 hours.
2.2. Characterization
The phases and crystalline structures of the samples were analyzed through X-ray diffraction (XRD), utilizing Cu Kα radiation operating at 30 mA and 40 kV. The phases were identified by employing Match! Software, while the structures of the samples were deduced using Rietveld's refinement with the Rietica software. Further analysis was carried out using Fourier Transform Infrared spectroscopy (FTIR) and Raman spectroscopy with a 785 nm wavelength laser.The X-ray absorption near edge structure (XANES) and extended X-ray absorption fine structure (EXAFS) of the Mn–K edge and Fe–K edge were recorded at the BL-8 beamline of the Synchrotron Light Research Institute (SLRI). All spectra were collected at room temperature in transmission mode. The monochromator energy was calibrated with Mn and Fe foil. The obtained data were processed using ATHENA and ARTEMIS software. X-ray photoelectron spectroscopy (XPS) data were obtained with an Axis Ultra DLD system equipped with an Al monochromatic.
The microstructures and morphologies of the as-prepared samples were characterized by scanning electron microscopy (FESEM/SEM), attached to an energy-dispersive X-ray analysis (EDAX) analyzer, in order to measure the sample compositions. The crystal structure details were further characterized by transmission electron microscopy (TEM) and high-resolution transmission electron microscopy (HRTEM). Selected area electron diffraction (SAED) patterns were recorded and analyzed using Crystbox software to obtain d-spacing.27
The electrical analysis was performed on a powder uniaxially pressed at ≈0.4 MPa with a diameter of 13 mm. The pellets were sandwiched between two copper electrodes under spring-loaded pressure to ensure an ohmic contact. The setup was measured with an (ac) Solartron impedance analyzer in the frequency range of 0.1 Hz–32 MHz and at a voltage of 1 V.
3. Results and discussion
3.1. Synthesis of α-MnO2
Fig. 1 shows the XRD patterns of the synthesized powder at different temperatures and soaking times during the hydrothermal processes. At 100 °C for 1 hour, the pattern displays a δ-MnO2 structure. However, the amorphous phase is notable. Furthermore, the increased temperature of the reaction to 140 °C to the peaks in the δ-MnO2 phase is remarkable, although the yield only reaches 60%. With an increase in the reaction time of the hydrothermal reaction to 3 hours, the phase transformed from δ-MnO2 to α-MnO2 and, correspondingly, the yield increased to 97%. Furthermore, with a longer reaction time of up to 7 hours, the yield succeeds at being asymptotic up to 100% (Fig. 1b), while the α-MnO2 phase is preserved.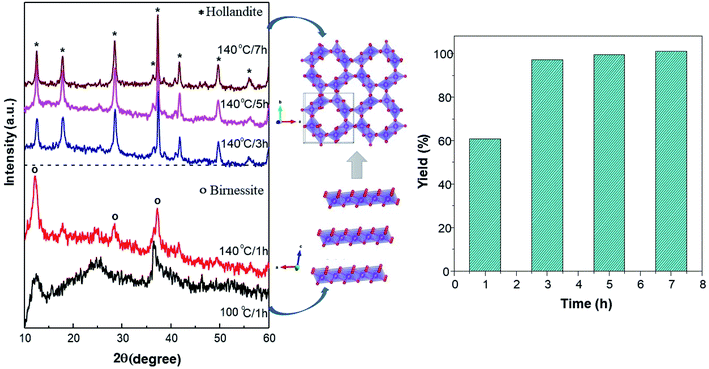 | ||
| Fig. 1 Synthesis of MnO2 through a hydrothermal method. (a) The XRD patterns of MnO2 and possible crystal growth during synthesis at different temperatures and reaction time. (b) Reaction yields. | ||
With the prolongation of the reaction time at 140 °C, there is structural transformation and growth. With the extension of the reaction time, the crystallinity gradually increases, and a phase transformation from δ to α-MnO2 must have taken place in the formation of α-MnO2. Studies on structural growth28 initially show that δ-MnO2 has a layered structure form that tends to curl with the driving force of increased temperature and pressure, continuing to develop and then transform to the α-MnO2 phase, as indicated in Fig. 1a.
3.2. Microstructure and structural analysis
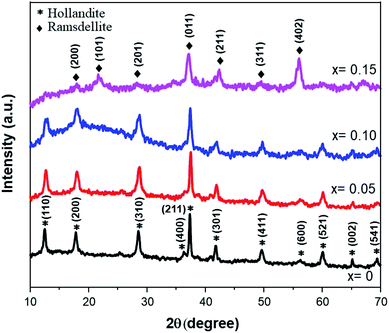
After considering the previous study, the following synthesis was carried out at 140 °C for 5 hours of soaking time. Fig. 2 shows the XRD patterns of the Fe-doped MnO2 samples, Mn1−xFexO2−δ (x = 0–0.15). The patterns are similar for x = 0 up to x = 0.10 and can be assigned as α-MnO2 using the Match 2 software. This presents a hollandite-type structure (tetragonal, space group I4/m) that was similarly reported by Kondrashef (1951). No additional peaks that can be assigned to the compounds of the doped materials appear in the samples, indicating that the doped materials are well incorporated into the structure and, considering the ionic radius of Fe3+ (73 pm) and assuming that the high spin and low spin forms of Fe3+ co-exist, its radius is quite similar to that of Mn4+ (67 pm).When x was increased to 0.15, two important peaks were observed at 2θ ≈ 22° and 2θ ≈ 56°, while the peaks at 2θ ≈ 12° and 2θ ≈ 60° disappeared. These peaks correspond to the Ramsdellite-type structure (R-MnO2) having orthorhombic symmetry and a Pnma space group. Therefore, a phase transformation process from α to R-MnO2 occurred. A deeper analysis to quantify the lattice parameter Rietveld Refinement was carried out and the results are presented in Table 1. Lattice parameter data show that the b lattice changed from the initial 9.8338 ÅÅ for x = 0.10 to 4.4708 Å for x = 0.15, and this is confirmation of the transformation of α to R-MnO2.
| Sample | Reliability factor | Lattice parameters | Crystal symmetry | |||||
|---|---|---|---|---|---|---|---|---|
| Rwp | RB | Rexp | GOF | a | b | c | ||
| x = 0 | 6.77 | 1.89 | 5.69 | 1.41 | 9.8614(6) | 9.8614(6) | 2.8686(4) | I4/m |
| x = 0.05 | 5.83 | 1.48 | 4.93 | 1.39 | 9.8326(2) | 9.8326(2) | 2.8632(9) | I4/m |
| x = 0.10 | 6.16 | 1.20 | 5.46 | 1.27 | 9.8338(5) | 9.8338(5) | 2.8705(9) | I4/m |
| x = 0.15 | 5.45 | 2.72 | 4.68 | 1.35 | 9.6716(3) | 4.4708(9) | 2.8095(2) | Pnma |
Additionally, it was shown that for the Fe-doped samples, the intensities of the diffraction peaks were reduced, accompanied by a broadening of the observed peaks. This confirms that the substitution of Fe ions for the Mn ions at the octahedron site could degrade the crystallinity of MnO2. Accordingly, some amount of strain along with the vacancy defects is generated. The crystallite sizes (D) and micro-strain (ε) of all the samples were estimated using MAUD software.29 The goodness of fit was determined by the reliability parameter Rwp and is shown in Table 2. Meanwhile the dislocation density (δ) represents the amount of defects present in the samples, and this is defined as the length of dislocation lines per unit volume of the crystal and was calculated using the equation,30
 | (1) |
| Sample | D (nm) | ε (×10−3) | δ (lines per nm2) × 10−4 | Rwp (%) |
|---|---|---|---|---|
| x = 0 | 49.06 | 2.66 | 4.15 | 7.079 |
| x = 0.05 | 23.05 | 4.39 | 18.82 | 6.257 |
| x = 0.10 | 16.18 | 4.92 | 35.43 | 6.653 |
| x = 0.15 | 5.47 | 0.25 | 334.21 | 5.657 |
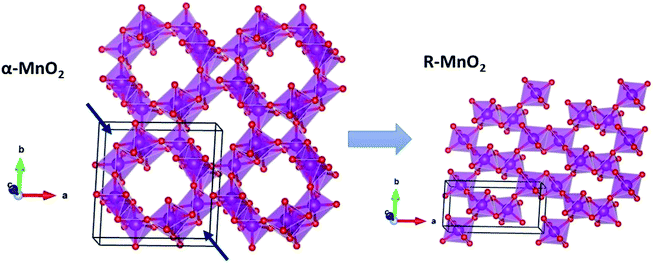
It is clear from Table 2 that there is a decrease in crystallite size and an increase in the lattice micro-strain and dislocation density in the α-MnO2 phase (x = 0–0.10). This indicates that Fe substituted Mn inside octahedral MnO6 leads to more defects in the samples. The high lattice strain values cause a phase change in MnO2, as indicated by the significant drop in micro-strain, ε, and a significant increase in the dislocation density, δ. Furthermore, by considering the Fe3+ radius is larger than that of Mn4+, and the instability of the local charge when 3+ of Fe substitutes 4+ of Mn  , which is possibly accommodated by the oxygen vacancy
  , after 0.15Fe is inserted into the Mn site, then the octahedron chains are broken from the (2 × 2) to (2 × 1) tunnels, and this is illustrated in Fig. 3 and was visualized with the VESTA software.31 There are possible effects when Fe3+ dissolves in MnO2, causing a decrease in the crystalline size, and these include an increase in the size of the octahedron and oxygen vacancy
  creation following the defect reaction. This can be represented using Kroger–Vink notation:
 | (2) |
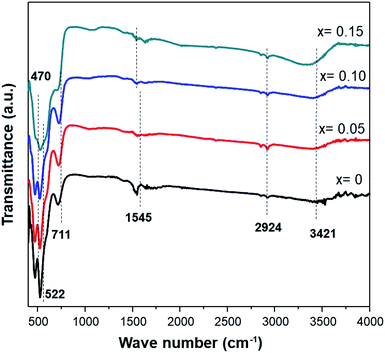
The infrared characterization interactions among the ions/molecules of the surfaces with the nanostructures cause alterations in the vibrational frequencies compared to isolated molecules or pure nanostructures. Fig. 4 shows the FTIR spectra of MnO2 and Fe-doped samples. The high-frequency modes around 466 and 522 cm−1 represent the stretching vibration of Mn–O. Meanwhile, the mode at 711 cm−1 can be ascribed to the Mn–O–Mn stretching vibration, further supporting the formation of octahedral MnO6. The displacement of oxygen anions relative to the Mn cations along the direction of the octahedral chain produces peaks at 522 cm−1. Furthermore, an increase in Fe-doping in the sample affects the transmittance intensities of 466, 522, and 711 cm−1 being reduced.
Peaks at ≈1545 cm−1 are attributed to the vibrations of Mn–O–H bonds.32 A decrease in the intensity at this frequency for the doped sample indicates that oxygen vacancies are present in the Fe-doped sample. Moreover, a broad band at 3400–3500 cm−1 is assigned to the stretching vibration of O–H. These hydroxyl groups originate from water adsorbed onto the surface of the MnO2 samples. The presence of more water adsorbed in a sample with Fe-doping indicates that an amount of water is slightly accumulated in the tunnel of Fe-doped MnO2.23 Additionally, small peaks at 2851 cm−1 and 2921 cm−1 are attributed to C–H stretching and bending vibrations of ethanol,33 which was present after the washing process (Table 3).
| FT-IR peaks (cm−1) | Vibrational mode | |||
|---|---|---|---|---|
| x = 0 | x = 0.05 | x = 0.10 | x = 0.15 | |
| 470.65 | 466.79 | 468.72 | — | Stretching vibration Mn–O |
| 522.73 | 520.8 | 518.87 | 524.66 | Stretching vibration Mn–O |
| 711.76 | 713.69 | 721.40 | 702.11 | Stretching vibration Mn–O–Mn |
| 1545.03 | 1537.32 | 1545.03 | 1529.6 | Vibrations of O–H combined with Mn |
| 2924.18 | 2920.32 | 2922.25 | 2922.25 | Stretching vibration C–H |
| 3421.83 | 3367.82 | 3396.76 | 3304.17 | O–H stretching vibration of surface water |
The vibrational lattice features of the RS spectroscopy data provide a reliable description of different local structural as well as crystalline disorders or defects of the MnO2 related compound.30 Considering the XRD analysis, α-MnO2 has a body-centered tetragonal structure with space group I4/m, and the RS spectroscopy factor group analysis indicates that MnO2 will be assigned as 15 spectroscopic modes of 6Ag + 6Bg + 3Eg. However, it might be difficult to observe these Raman-active modes in the polycrystalline samples due to the low polarizabilities of some of these modes and the overlap of incompletely resolved modes.34 In these samples, the Raman scattering is characterized by three sharp peaks at about 181, 574, and 634 cm−1, as well as six weak bands recorded at 295, 385, 494, 762, 819, and 858 cm−1 that be indexed to α-MnO2, as designated in Fig. 4a. Two Raman bands at 181 and 385 cm−1 are assigned to Eg symmetry, while those at 494 and 674 cm−1 are assigned to Bg symmetry, and three bands at the high-frequency regions of 574, 634, and 762 cm−1 are ascribed to symmetrical Mn–O vibrations and are assigned to Ag symmetry. Considering the crystalline structure of α-MnO2 (Fig. 2), the basic MnO6 octahedron shared edges and corners build a (2 × 2) tunnel space. Hence, important vibrational interactions are expected to arise, along with interactions perpendicular to the O–Mn–O–Mn–O chains.
Fig. 5 depicts the Raman absorption spectroscopy data, where a low-frequency Raman band at 181 cm−1 is assigned to an external vibration that is derived from the translational motion of the MnO6 octahedral structure, which is concerned with the existence of tunnel ions.2 The weak peaks at 295, 385, 494, 762, 819, and 858 cm−1 reveal the phonon density of states rather than the Raman-allowed zone center phonons, and this is due to the confinement of phonons by crystal defects and local lattice distortions in the as-prepared MnO2 nanowires.35 A band at 634 cm−1 can be attributed to the symmetric stretching of O–Mn–O vibrations, perpendicular to the direction of the MnO6 octahedral double chains. Meanwhile, the peak at 574 cm−1 corresponds to the vibrations of the O–Mn–O–Mn chains in the octahedral planes. Therefore, the Raman band observed in this range is attributed to the displacement of the oxygen atoms relative to the manganese atoms along the octahedral chains.
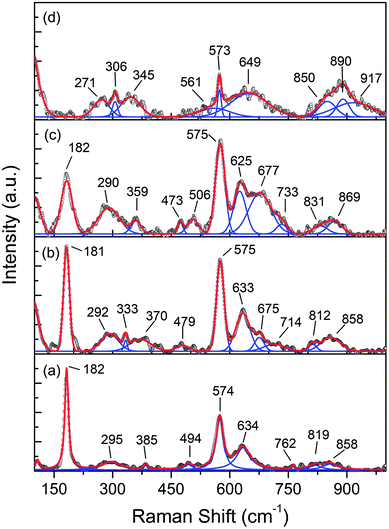 | ||
| Fig. 5 Raman spectra of Fe-doped MnO2 samples, Mn1−xFexO2. (a) x = 0; (b) x = 0.05; (c) x = 0.10; and (d) x = 0.15. | ||
Doping Fe into MnO2 causes variation in the intensity peaks of the Raman bands due to the confinement of phonons by crystal defects and local lattice distortions. From Fig. 5(b and c), it can be observed that with Fe-doping (x = 0.05 and x = 0.10), the Raman peak around 630 cm−1 strengthens. This indicates that some lattice rearrangements have occurred without a structural phase transition. An increase in intensity around 574 cm−1 signifies an increase in the distortions associated with oxygen displacement and the number of oxygen vacancies with doping.
The greater Fe-doped sample (x = 0.15), displayed in Fig. 4d, shows a significant change in the Raman peak, which explains the phase change from α-MnO2 to R-MnO2 as presented by the XRD results. Ramsdellite MnO2 indicates 18 Raman modes of activity such as 6A1g + 3B1g + 6B2g + 3B3g.36 The Raman spectrum of the x = 0.15 sample displays two main sharp peaks at 573 and 649 cm−1 and two weak peaks recorded at 271 and 345 cm−1. The two sharp peaks are assigned to an A1g spectroscopic and indicative well-developed orthorhombic structure with an interstitial space consisting of (1 × 2) channels.37 In addition, the peak at 181 cm−1 disappears, and this indicates the reduction of cations in the tunnel.
The Raman bands at 800–900 cm−1 initially have a very low intensity for x = 0, and this increases for a higher x value, in particular for x = 0.15. Considering that the oxidation state of the Fe dopant is smaller than Mn, the oxygen vacancy formation due to the dopants increases parallel to the Fe-doped content. Therefore, the Raman bands at 800–900 cm−1 can be attributed to oxygen vacancies and the increase in its intensity relates to vacancy concentration.38 Moreover, the presence of an Fe–O vibration in Fe-doped MnO2, as shown in Fig. 5(b–d), was identified as a mixture of α and γ phases of Fe2O3 and magnetite (Fe3O4). The band at 333 cm−1 can be attributed to Eg modes of α-Fe2O3, while γ-Fe2O3 is shown at around 359 (Eg), 370 (Eg), 506 (T2g), and 714 (A1g) cm−1.39 Some of the Fe3O4 peaks are assigned to symmetry Eg ≈ 306 cm−1, T2g ≈ 479, ≈561 cm−1, and A1g ≈ 675 cm−1.
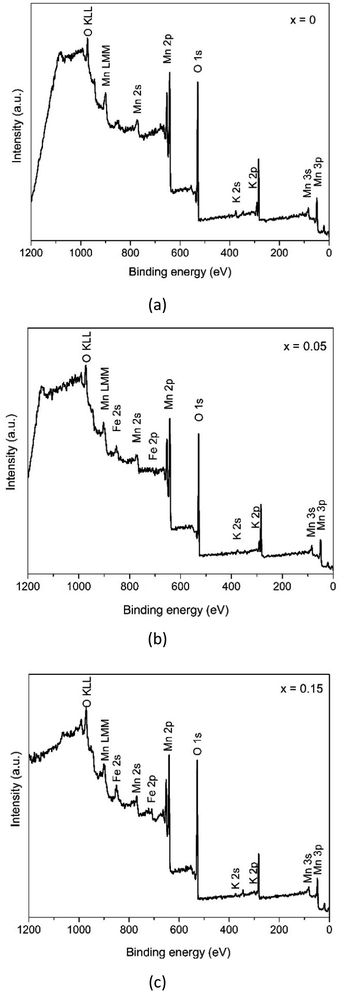
In order to deeply explore the information concerning the chemical state and composition of the samples, X-ray photoelectron spectroscopy (XPS) was carried out. The XPS survey spectra in Fig. 6 reveals that the samples consist of Mn and O elements with a slight number of K cations and Fe elements. Furthermore, each sample shows carbon as a contaminant.
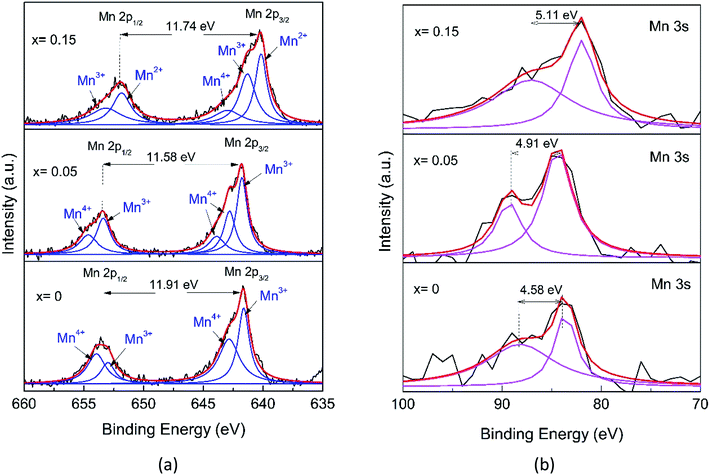
The detailed analysis of the XPS spectra of the Mn1−xFexO2 samples is given in Fig. 7 and 8. In the Mn 2p spectrum (Fig. 7a), two spin–orbit doublets of Mn 2p3/2 and Mn 2p1/2 are detected. For x = 0, at 641.69 and 653.60 eV with a binding energy gap of 11.91 eV, the spectrum indicates the existence of MnO2. Meanwhile, the binding energies for x = 0.05 are 641.66 eV (Mn 2p3/2) and 653.45 eV (Mn 2p1/2) with a binding energy gap of 11.58 eV, so they are close to those of the MnO2 sample. In contrast, for x = 0.15, the peak positions for Mn 2p3/2 (640.25 eV) and Mn 2p1/2 (652.03 eV) with a binding energy gap of 11.74 eV, are shifted to lower binding energies compared to those for MnO2. Jain (2019)40 reported that the binding energy shifts to a lower value related to the decreasing oxidation state of Mn in the oxide (MnO2 > Mn2O3 > Mn3O4). Therefore, the shift to lower energy for the x = 0.15 sample was interpreted as evidence for a mixed Mn2+/3+ state.41
Following a deconvolution process using the Lorentzian function, four peaks located at 641.63, 642.85, 652.99, and 653.96 eV were obtained for the MnO2 2p spectra, while those for the other samples are depicted in Table 4. These peaks were assigned to the Mn3+ (2p3/2), Mn4+ (2p3/2), Mn3+ (2p1/2), and Mn4+ (2p1/2) species, respectively. The presence of two chemical environments for Mn4+ could be ascribed to the bulk MnO6 octahedron (O–Mn–O) and the surface environment that could present the O–Mn–OH structure. An amount of Mn3+ could also be present, probably due to the cations inside the tunnel, which can induce the reduction of Mn4+ to Mn3+ to maintain charge neutrality and the oxygen vacancies that could also contribute to Mn3+ formation.42 With greater Fe-ion doping (0.15), the special shapes of the peak of Mn 2p represent the existence of Mn in a mixture of various valence states, including Mn2+, Mn3+, and Mn4+. The components located at 642.97 and 653.17 eV are ascribed to Mn4+. The components located at 641.31 and 651.84 eV are attributed to Mn3+ and a minor component of Mn2+ at 640.17 eV.
| Samples | Mn 2p | Mn 3s | |||
|---|---|---|---|---|---|
| Species | Peak (eV) | Area (%) | ΔE3s | AOS | |
| x = 0 | 2p3/2 (Mn3+) | 641.629 | 44.11 | 4.58 | 3.86 |
| 2p1/2 (Mn3+) | 652.99 | ||||
| 2p3/2 (Mn4+) | 642.854 | 55.89 | |||
| 2p1/2 (Mn4+) | 653.958 | ||||
| x = 0.05 | 2p3/2 (Mn3+) | 641.776 | 53.54 | 4.91 | 3.43 |
| 2p1/2 (Mn3+) | 653.380 | ||||
| 2p3/2 (Mn4+) | 642.811 | 46.46 | |||
| 2p3/2 (Mn4+) | 643.886 | ||||
| 2p1/2 (Mn4+) | 654.635 | ||||
| x = 0.15 | 2p3/2 (Mn2+) | 640.174 | 26.35 | 5.11 | 3.18 |
| 2p3/2 (Mn3+) | 641.312 | 44.49 | |||
| 2p1/2 (Mn3+) | 651.844 | ||||
| 2p3/2 (Mn4+) | 642.971 | 29.16 | |||
| 2p1/2 (Mn4+) | 653.171 | ||||
However, due to the overlap in binding energy values, the complex multiplet splitting, the satellite-loss features, and the asymmetry of the spectra,43 it is difficult to determine the valence of Mn from the Mn 2p peaks alone. Further analysis of the Mn 3s doublet splitting (ΔE3s) offers a detailed understanding of the Mn chemical state (Fig. 7b). The Mn 3s peak splitting is caused by the electron exchange in the 3s–3d orbitals of Mn upon photoelectron ejection, which is more sensitive to the oxidation state of manganese than that of Mn 2p.44 For convenience, the estimation of the AOS (average oxidation state) for Mn from ΔE3s was calculated using the following equation,41
| AOSMn = 9.67 − 1.27ΔE3s | (3) |
The AOS numbers of Mn are listed in Table 4. These decrease with x, showing more influence of the Mn3+ characteristics and the values are consistent with the Mn 2p analysis, indicating the existent of Mn2+ for x = 0.15. Interestingly, there are no extra peaks in the XRD pattern of α-MnO2 (Fig. 2), indicating that the oxidation state of Mn is 4+. However, the XPS data of the Mn 2p spectra for α-MnO2 (Fig. 7a) show a distinct presence of Mn3+, but the existence of Mn3+ may not be due to the presence of Mn2O3. These observations indicate that Mn3+ is possibly localized on the surface of α-MnO2 without the formation of lower oxides.40 Or, Mn3+ is compensated by the oxygen vacancy. Furthermore, by increasing the amount of Fe-doping (x = 0.15), the structure transforms to Ramsdellite from the initial α-MnO2. This indicates a structural distortion in the Ramsdellite structure, and this is caused by an interaction of Jahn–Teller distortion of the octahedrally coordinated Mn3+O6.15
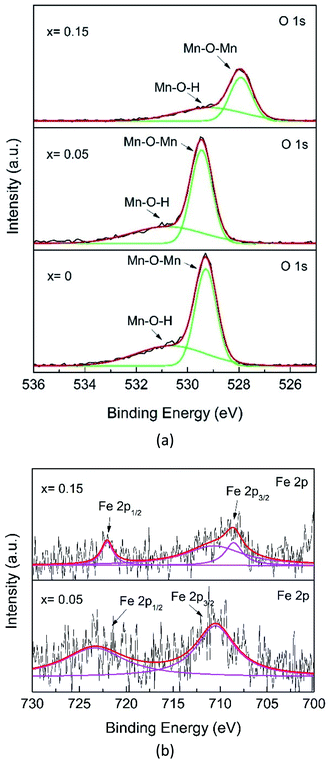
Fig. 8a shows the O 1s core-level XPS spectrum. The O 1s XPS spectra for x = 0 and x = 0.05 are deconvoluted into three peaks, which can be assigned to Mn–O–Mn (∼529.28 eV), Mn–O–H (∼530.55 eV), related to the oxygens from bulk MnO6, and surface Mn–O–H, respectively, in agreement with the presence of two Mn chemical environments.42 However, the major O 1s peak for x = 0.15 shifts to a lower level and decreases in intensity, indicating a change in the Mn–O coordination configuration, probably due to the formation of the Fe–O–Mn bond.
Further analysis of the Fe 2p spectra of the x = 0.05 samples, despite the data being scattered (Fig. 8b), shows broad peaks. The characteristic Fe spin–orbit peaks of the x = 0.05 sample 2p1/2 is located at 723.36 eV, indicating the existence of a mixture of Fe2+ and Fe3+, while Fe 2p3/2 is located at 710.49 eV for Fe4+. However, for x = 0.15, the Fe 2p1/2 spectrum exhibits lower binding energies, located at 722.04 eV and 2p3/2 is located at 708.58 eV, and this can be interpreted as a mixture of Fe2+ and Fe3+, while the peak at 710.66 eV was for Fe4+.45 Recalling the XRD pattern (Fig. 2), no compound containing Fe species could be observed, indicating that Fe has substituted with Mn. As mentioned before, the Fe element present in the XPS spectrum also reveals that Fe-doping plays a key role in phase transformation.
In order to determine the electronic and structural properties of the MnO2 and Fe-doped samples, X-ray absorption fine structure (XAFS), as well as X-ray absorption near edge structure (XANES) and extended X-ray absorption fine structure (EXAFS) spectroscopies were performed. XANES can provide information on the electronic structure of Mn present in the different oxides, especially for the short-range order. The Mn K-edge XANES spectra of the prepared samples are presented in Fig. 9a, and the reference compositions of MnO2, Mn2O3, and MnO2 are also included.
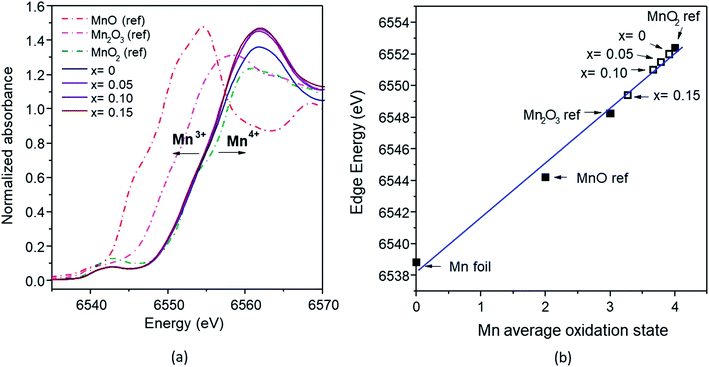 | ||
| Fig. 9 (a) Mn K-edge XANES spectra of the MnOx reference and Mn1−xFexO2 samples; (b) average oxidation states of Mn for the reference and samples derived from the K-edge energies. | ||
It can be seen that the shapes of all the samples and the peak positions are similar to each other. The absorption edges are slightly shifted towards lower energy with increasing Fe-doped concentration, and this can be attributed to the chemical shift effect. The absorption edge shift to lower energy with increasing Fe-dopant could be used to obtain an average oxidation state of absorbent through the first derivatives of the edge curves. The absorption edge energies of Mn1−xFexO2 are determined to be 6552 eV, 6551.5 eV, 6551 eV and 6549.4 eV for x = 0, 0.05, 0.10 and 0.15, respectively. The Mn K-edge absorption energies of the reference materials were 6544.21 eV (MnO), 6548.25 eV (Mn2O3), and 6552.4 eV (MnO2). The absorption edges of all the samples were lower than those of the MnO2 (Mn4+) reference. Increasing the x value leads to the gradual shift of the absorption edge towards Mn2O3 (Mn3+). This is an indication that the Mn absorber possesses a mixture of oxidation states, namely 3+ and 4+. The average oxidation state (AOS) of Mn was determined by establishing a linear relationship between the Mn K-edge energy and the Mn oxidation state (Fig. 9b).
According to the Fe K-edge XANES spectra (Fig. 10a), the absorption energy (E0) of the Fe-doped samples with x = 0.05–0.15 observed a slight shift to higher energy, compared with the Fe2O3 standard. The absorption energy of x = 0 was 7123.79 eV, and this gradually shifted to that of the Fe2O3 standard (7123 eV) at higher x values (0.10 and 0.15), with values of 7123.48 eV and 7123.25 eV. This shift indicates that the average oxidation state of Fe is between 3+ and 4+ (Fig. 10b). The mixed oxidation states of the Mn and Fe results confirms the XPS analysis results described previously.
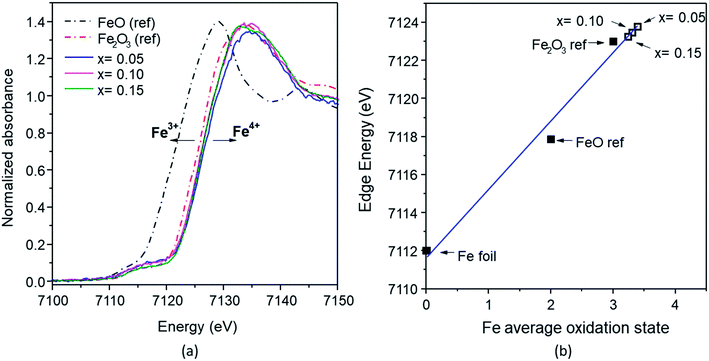 | ||
| Fig. 10 (a) Fe K-edges XANES spectra of the FeOx reference and Mn1−xFexO2 samples; (b) average oxidation states of Fe for the reference and samples derived from the K-edge energies. | ||
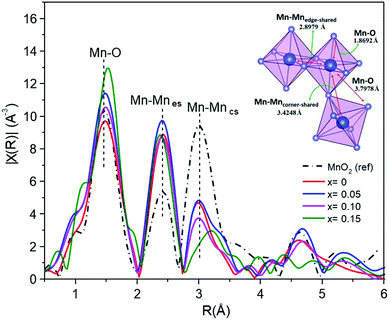
EXAFS studies the local structure information. Fig. 11 shows the curve-fitting Fourier transform (FT) into R-space. The fitting process meant that the interatomic distances (d) and the Debye–Waller factors (σ) were left as free parameters, and the coordination number (CN) was fixed. The results of the curve fitting are summarized in Table 5. The α-MnO2 reference exhibits a first shell Mn–O interaction distance of around 1.8692 Å, and the second and third shells associated with the characteristic Mn–Mnes (es = edge-shared) and Mn–Mncs (cs = corner shared) distances were around 2.8979 Å and 3.4248 Å, respectively. It was observed that the interatomic distances of Fe-doped MnO2 were slightly different to those of the MnO2 standards.
| Sample | Shell | R (Å) | σ2 | R-Factor (%) |
|---|---|---|---|---|
| MnO2 (ref) | Mn–O | 1.8692 | 0.00344 | 1.997 |
| Mn–Mn | 2.8979 | 0.00801 | ||
| Mn–Mn | 3.4248 | 0.00001 | ||
| Mn–O | 3.7978 | 0.01564 | ||
| x = 0 | Mn–O | 1.8815 | 0.00430 | 2.325 |
| Mn–Mn | 2.8750 | 0.00403 | ||
| Mn–Mn | 3.4365 | 0.00531 | ||
| Mn–O | 3.0907 | 0.04445 | ||
| x = 0.05 | Mn–O | 1.8797 | 0.00270 | 2.038 |
| Mn–Mn | 2.8737 | 0.00329 | ||
| Mn–Mn | 3.4348 | 0.04918 | ||
| Mn–O | 3.1028 | 0.00455 | ||
| x = 0.10 | Mn–O | 1.8884 | 0.00342 | 2.121 |
| Mn–Mn | 2.8853 | 0.00418 | ||
| Mn–Mn | 3.4426 | 0.00591 | ||
| Mn–O | 3.5274 | 0.01559 | ||
| x = 0.15 | Mn–O | 1.8949 | 0.00005 | 2.575 |
| Mn–Mn | 2.9600 | 0.00111 | ||
| Mn–Mn | 2.8966 | 0.00756 | ||
| Mn–O | 3.5777 | 0.01993 |
The distance of the Mn–O bond shifts toward larger R values in line with the doping percentage. The Mn–O distribution peak intensity exhibited a small increase with increasing Fe content (x > 0), suggesting that the Fe neighboring structure of Mn–O had changed in its Mn oxidation state from 3+ to 4+.21 However, the opposite occurred for the undoped MnO2 sample.
The interatomic distances of the Mn–Mnes octahedra initially showed smaller and shorter values for the x = 0–0.10 samples, and increased values for x = 0.15. The increasing peak intensity for the doped sample, in the Mn–Mnes shell, is probably due to the higher mean coordination number of Mn at the second cationic coordination shell.6 However, the opposite trend is observed for the Mn–Mncs octahedra. The intensity of the FT peaks significantly decreased for higher Fe content, revealing that the increased structural distortion is due to the insertion of K in the tunnel, Fe substitution into the α-MnO2 structure and an increased amount of Mn3+ ions, as indicated by the XPS and XANES analysis, showing active Jahn–Teller distortion. Furthermore, there is a significant broadening and reduction of the peak intensity and notably different FT peak features of the high Fe-doped (x = 0.15) sample for Mn–Mncs. This difference is likely due to the severe Jahn–Teller distortion in the corner-shared MnO6 octahedra, and the breakage of the tunnel structure becomes (2 × 1).46
On the other hand, the Mn–Mncs bond length increases slightly with the concentration of Fe. The lengthening of the Mn–Mncs bond can occur because of the reduction of Mn4+ to Mn3+. As the ionic radius of the manganese cation increases (Mn4+ → Mn3+) and the Jahn–Teller effect becomes active, Mn3+ can distort the structure and lengthen the Mn–Mncs bond.47 This fact is similarly consistent with the mean oxidation state of Mn, which is lower than 4+, as determined by XPS and XANES in Mn1−xFexO2.
The morphologies and microstructures of MnO2 with different doping Fe3+ concentrations were examined using scanning electron microscopy (SEM). One-dimensional MnO2 nanorods were typically synthesized in the Mn1−xFexO2 samples with x = 0–0.10, as shown in Fig. 12a–c. However, α-MnO2 (Fig. 12a and b) shows a rod-like morphology with an average diameter of about 70 nm and a length of about 2 μm. The rods are uniform throughout their entire length.
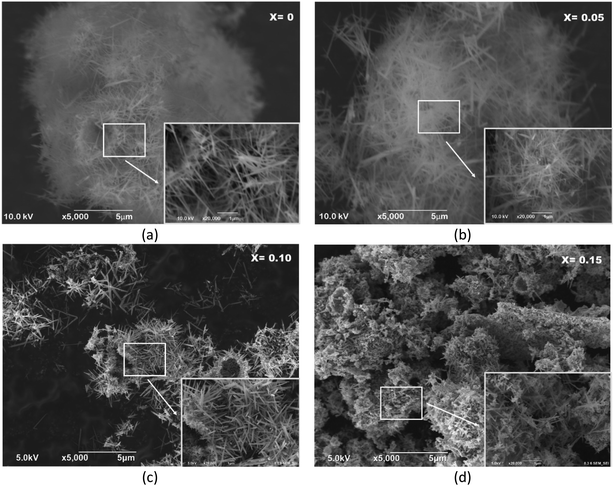 | ||
Fig. 12 SEM images of Mn1−xFexO2, (a) x = 0; (b) x = 0.05; (c) x = 0.10; and (d) x = 0.15 showing the morphology of the nanorods; inset: the magnification of 20![[thin space (1/6-em)]](https://www.rsc.org/images/entities/char_2009.gif) 000×. 000×. | ||
This rod-like morphology implies anisotropic growth of the nanocrystals. The length of the aligned nanowires decreased with increasing Fe3+ concentration. MnO2 combined with very short nanorods were shown in the sample with x = 0.10 Fe content (Fig. 12c). The morphology of the sample of MnO2 doped with Fe (x = 0.15), which is characteristic of R-MnO2, is shown in Fig. 12d. It can be seen that the formation of clusters with plate-like and rod-like nanosized crystallites, which both belong to MnO2, may be due to the growth of newly formed MnO2 colloids during early formation. The amount of these plate-like crystallites is low.
Table 6 provides the EDS analysis of MnO2, and reveals that the sample is composed of O, Mn, and K. The presence of K ions (about 2%) indicates that K+ could simultaneously occupy the structure channels (2 × 2) and stabilize the hollandite structure type. By incorporating K+ ions into the tunnel, a state of charge neutrality is maintained in the structure by reducing Mn4+ to Mn3+.48 This confirms the structural distortion in the Mn1−xFexO2 sample with x = 0. Moreover, small amounts of Fe element are confirmed in the EDS table. Increasing the x values of Fe-doping causes a reduced number of K+ ions. This is consistent with the phase change from α-MnO2 (2 × 2) to R-MnO2 (2 × 1). The evidence of successful Fe-doping could be verified through XPS.
| Element | Atomic (%) | |||
|---|---|---|---|---|
| x = 0 | x = 0.05 | x = 0.10 | x = 0.15 | |
| O–K | 77.22 | 76.86 | 64.73 | 66.60 |
| Mn–K | 20.63 | 19.86 | 29.90 | 28.05 |
| K–K | 2.15 | 1.93 | 2.38 | 1.25 |
| Fe–K | — | 1.35 | 2.95 | 4.10 |
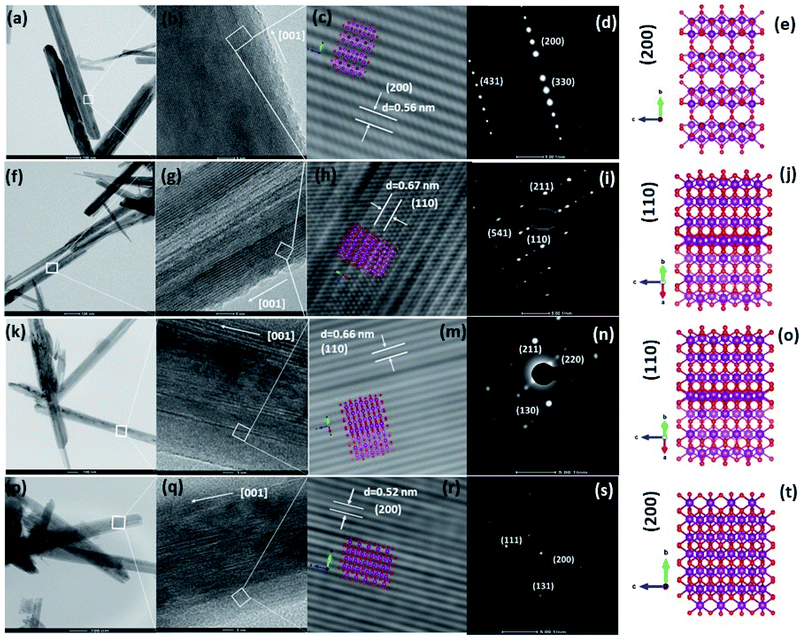
To obtain deep insight into the morphology features and crystal structures of the Fe-doped MnO2 samples, Mn1−xFexO2, TEM, HRTEM, and SAED characterizations were used for analysis. The morphologies of all the samples, displayed in Fig. 13(a, f and k), clearly show the shape of the MnO2 nanorods, and this corresponds to the SEM morphology shown in Fig. 12. The TEM image of α-MnO2, with x = 0, (Fig. 13a), shows the presence of nanorods with a diameter of 20–80 nm. Fig. 13(b) indicates the single crystalline characteristic of the α-MnO2 nanorod, as affirmed by comparing with the SAED pattern in Fig. 13(d), which can be indexed to (200), (110), and (411). The growth direction of the nanotubes is at [001]. Fig. 13(c) shows the lattice fringe with d-spacing of 0.56 nm, corresponding to the d value of the (200) plane of α-MnO2, and this relates well with the XRD data shown in Fig. 2(a). The illustration of the crystal plane (200) is shown in Fig. 13(e).
The addition of Fe (x = 0.05–0.10) affects the morphology of the Mn1−xFexO2 samples. The average thickness of the nanorods varies from 50 to 100 nm. The HRTEM images in Fig. 13(g and l) clearly show the disordered orientation of the sample. Correspondingly, the exposed plane of the nanorods in the Fe-doped samples (x = 0.05–0.10) and its lattice are shown in Fig. 13(g and h)–(l and m) for x = 0.05 and 0.10, respectively. The d value of the lattice fringes (≈0.67 nm) relates to the (110) plane of α-MnO2 and indicates that the growth direction of the nanorod is at [001]. This plane is consistent with the SAED data in Fig. 13(i and n). Fig. 13(p) shows the different morphology of the x = 0.15 sample. The average length of the nanorods is reduced, while the thickness is around 70 nm. This morphology is related to the R-MnO2 phase and is shown in the FESEM image in Fig. 12(d). The schematic model of the R-MnO2 nanorods in Fig. 13(r) shows that the interplanar distance of the (200) crystal planes is enlarged from d-spacing to 0.52 nm. The SAED pattern (Fig. 13(s)) shows the lattice fringe matches with the (111), (200), and (131) crystal planes that confirm the diffraction pattern of orthorhombic R-MnO2.
3.3. Electrical characterization/analysis
The electrical properties of the Mn1−xFexO2 samples were investigated using a complex impedance technique. This technique is principally used for characterizing electrical properties, including the determination of ionic conductivity, capacitance, permittivity, and the dielectric constant. The plots of imaginary impedance (Z′′) versus real impedance (Z′) (Nyquist plot) for different Fe-doped samples (x = 0–0.15) are shown in Fig. 14. The addition of Fe-doping causes an increase in the radius of the semicircles. One small semicircle was seen for x = 0–0.05, suggesting that the electrical processes in the material arise due to the contribution from grain material. Furthermore, the inductance response observed at high frequency relates to the wiring system. When x = 0.10–0.15, there are two overlapping semicircles, corresponding to the grain (semicircle at high frequencies) and grain boundaries (low-frequency semicircles).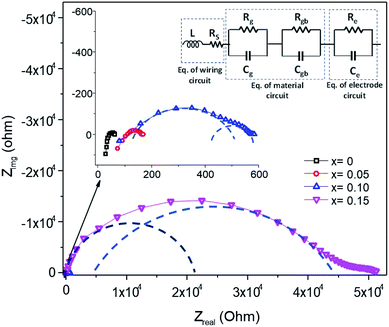 | ||
| Fig. 14 Impedance spectra of Mn1−xFexO2, and the equivalence electrical circuit model is indicated. The dashed line guides a single RC loop response. | ||
The impedance data has been linked to the equivalent circuits (inset in Fig. 14), which consist of the inductance from wires (L), the wire shunt resistance (Rs), and the inside series combination of grain and grain boundaries. The first consists of a parallel combination of resistance (Rg) and the capacitance (Cg) of grains, and the second consists of a parallel combination of resistance (Rgb) and the capacitance (Cgb) of the grain boundary. Finally, the electrode equivalence circuit parallel to Re and Ce arises at a low frequency. In this circuit model, the wiring system provides equal responsibility for all samples. When the material is conductive, the wiring response is excellent, disappearing when the material becomes resistive. From this figure, the DC grain conductivity (σg in S cm−1) of the samples can be deduced, and these are 4 × 10⁻², 1.67 × 10⁻², 3.2 × 10⁻³, and 4.5 × 10⁻⁵ for x = 0, 0.05, 0.10, and 0.15, respectively, as shown in Fig. 15a. It is well-known that the conductivity can be determined by elementary charges and defect mobility. The decrease in the conductivity is related to the number of defects  in the Fe-doped sample, due to the low mobility. However, the sharp drop in σg for x = 0.15 is attributed to a further combination of the phase transformation from initial α-MnO2 to R-MnO2. Furthermore, in the low x samples, the conductivity displayed higher values, since the large tunnel (2 × 2) facilitates the movement of K+ ions in the α-MnO2 structure.
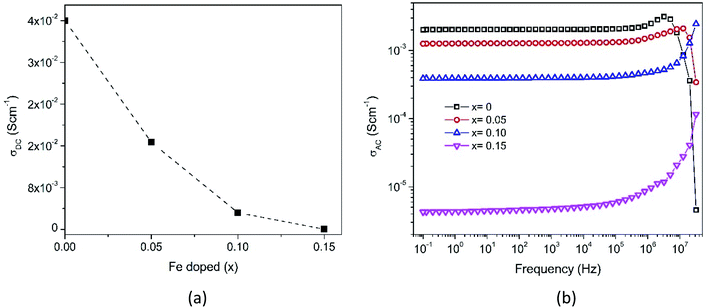 | ||
| Fig. 15 Frequency-dependent (a) DC grain conductivity and (b) AC conductivity spectra of Mn1−xFexO2. | ||
In the XRD analysis, it has been explained that the addition of Fe-doping causes an increase in lattice strains, dislocations, and oxygen vacancies. This defect causes the diffusion process to be obstructed, and thus explains the conductivity reductions (x = 0.05–0.10). Furthermore, considering the XPS and XANES analyses described earlier, the mixed oxidation states of Fe and Mn were 3+/4+. The AC conductivity was related to the hopping of electrons between Fe4+ and Fe3+, and the hopping rate increases with an increase of applied frequency. The substitution of Fe3+ at the Mn-site reduces the Mn4+ concentration due to electron exchange. In addition, the electron hopping energy between Fe3+ is larger than that between Mn4+.49 By increasing the replacement of Mn by Fe ions in the octahedral structure, the number of Mn ions is decreased, thereby defeating the electron exchange. Hence, the electrical conductivity is seen to decrease with an increase in Fe content.
The AC conductivity (σAC) can be calculated from the real and the imaginary parts of the impedance data, using the equation:50
 | (4) |
In order to elucidate the applicable parameter capacitance C, since it is related proportionally to the permittivity through the basic relation, C = εA/d, the following analysis was carried out on permittivity. The dielectric constant (εr) was measured as a function of the frequency at different Fe-doped concentrations, as shown in Fig. 16a, while the corresponding dielectric losses (tan![[thin space (1/6-em)]](https://www.rsc.org/images/entities/char_2009.gif) δ) are depicted in Fig. 16c. It was observed that the dielectric constant of all the samples decreases with increasing frequency, and then it maintains an almost constant value in the high-frequency region. As is generally described through the Clausius–Mosotti equation, the permittivity of ceramic materials involves interfacial polarization pi, dipole polarization pd, atomic polarization pa, and electronic polarization pe. These polarizations affect the permittivity at low frequencies for pi, up to the optical frequency range for pa, respectively. The higher value of εr at a low frequency can be explained based on the interfacial/space charge polarization due to the inhomogeneous dielectric structure. The polarization decreases with an increase in frequency and reaches a constant value. This can be attributed to the fact that the material comprises multiple defects
δ) are depicted in Fig. 16c. It was observed that the dielectric constant of all the samples decreases with increasing frequency, and then it maintains an almost constant value in the high-frequency region. As is generally described through the Clausius–Mosotti equation, the permittivity of ceramic materials involves interfacial polarization pi, dipole polarization pd, atomic polarization pa, and electronic polarization pe. These polarizations affect the permittivity at low frequencies for pi, up to the optical frequency range for pa, respectively. The higher value of εr at a low frequency can be explained based on the interfacial/space charge polarization due to the inhomogeneous dielectric structure. The polarization decreases with an increase in frequency and reaches a constant value. This can be attributed to the fact that the material comprises multiple defects  inducing inhomogeneous defect dipole creation beyond a certain external field frequency, and so the hopping dipoles cannot follow the frequency of the external electric field. At x = 0, the contribution of the space charge effect on polarization increases. The amount of doping causes the interfacial polarization to decrease gradually due to dipole polarization, pd, created by the existing defect, as described earlier in the doped samples. In addition, a significant disruption in the permittivity for x = 0.15 is associated with a combination of dipole defects and phase transformation to R-MnO2 from the initial α-MnO2. The areal capacitance as a function of frequency can be deduced from C/A = εrε0/d and is presented in Fig. 16b.
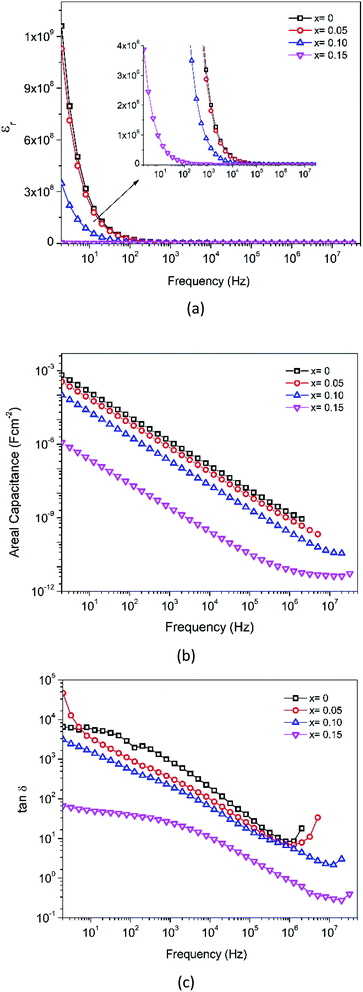 | ||
| Fig. 16 (a) Dielectric constant, (b) dissipation factor and (c) areal capacitance as functions of frequency. | ||
The dielectric loss, or tan δ, represents the energy dissipation in the dielectric system. The loss tangent decreases continuously with increasing frequency, and the absence of Debye characteristics signifies a diffuse transition between the interfacial dipole and dipole polarization. The dispersion in tan δ is seen in the lower frequency region. A maximum value of tan δ can be observed only when the hopping frequency is equal to that of the externally applied electric field.
4. Conclusions
In summary, Fe-doped MnO2 was successfully prepared using a hydrothermal method. Substituting longer radius Fe ions for Mn ions in the octahedral site causes increasing micro-strain, dislocation density, and oxygen vacancies that cause tunnel destruction, resulting in a phase transformation from the α-MnO2 performing tunnel (2 × 2) to R-MnO2 with a (2 × 1) tunnel. The oxidation state of the cations in the octahedron sites, Mn as well as Fe, possess a mixed oxidation state of 3+ and 4+. This creates the defects and
and  , as well as the formation of Jahn–Teller distortion of Mn4+ to Mn3+, which affects the electrical properties of Fe-doped MnO2. MnO2 without doping results in highly conductive samples. The addition of Fe-doping produces the formation of a defect and a reduced oxidation state, resulting in a material with lower conductivity and a lower dielectric constant.
Author contributions
E. Hastuti (conceptualization, data curation, formal analysis, investigation, methodology, resources, software, visualization, writing – original draft, writing – review & editing); A. Subhan (data curation, formal analysis, methodology, resources); P. Amonpattaratkit (data curation, formal analysis, methodology, resources); M. Zainuri (conceptualization, supervision, validation, writing – review & editing); S. Suasmoro (conceptualization, formal analysis, funding acquisition, methodology, project administration, resources, supervision, validation, visualization, writing – original draft, writing – review & editing).Conflicts of interest
There are no conflicts to declare.Acknowledgements
This research is supported by the Indonesian Ministry of Research and Higher Education through the Doctorate Dissertation program. The authors would like to thank the Research Center for Physics, Indonesian Institute for Science (LIPI) for microscopy analysis, and the SUT-NANOTEC-SLRI joint research facility for synchrotron utilization, Thailand, for XAS beam time.References
- X. Zheng, L. Yu, B. Lan, G. Cheng, T. Lin, B. He, W. Ye, M. Sun and F. Ye, J. Power Sources, 2017, 362, 332–341 CrossRef CAS.
- S. Cheng, L. Yang, D. Chen, X. Ji, Z. Jiang, D. Ding and M. Liu, Nano Energy, 2014, 9, 161–167 CrossRef CAS.
- A. González, E. Goikolea, J. A. Barrena and R. Mysyk, Renewable Sustainable Energy Rev., 2016, 58, 1189–1206 CrossRef.
- M. Jayalakshmi and K. Balasubramanian, Int. J. Electrochem. Sci., 2008, 3, 22 Search PubMed.
- C. Julien and A. Mauger, Nanomaterials, 2017, 7, 396 CrossRef.
- S. J. A. Figueroa, F. G. Requejo, E. J. Lede, L. Lamaita, M. A. Peluso and J. E. Sambeth, Catal. Today, 2005, 107–108, 849–855 CrossRef CAS.
- C. Sun, Y. Zhang, S. Song and D. Xue, J. Appl. Crystallogr., 2013, 46, 1128–1135 CrossRef CAS.
- G. Wang, G. Shao, J. Du, Y. Zhang and Z. Ma, Mater. Chem. Phys., 2013, 138, 108–113 CrossRef CAS.
- H. Yuan, L. Deng, Y. Qi, N. Kobayashi and M. Hasatani, Int. J. Electrochem. Sci., 2015, 10, 14 Search PubMed.
- A. I. Ivanets, T. F. Kuznetsova and V. G. Prozorovich, Russ. J. Phys. Chem. A, 2015, 89, 481–486 CrossRef CAS.
- R. Poonguzhali, N. Shanmugam, R. Gobi, A. Senthilkumar, G. Viruthagiri and N. Kannadasan, J. Power Sources, 2015, 293, 790–798 CrossRef CAS.
- T. M. Benedetti, V. R. Gonçales, D. F. S. Petri, S. I. C. de Torresi and R. M. Torresi, J. Braz. Chem. Soc., 2010, 21, 1704–1709 CrossRef CAS.
- S. B. Tarwate, S. S. Wahule, K. P. Gattu, A. V. Ghule and R. Sharma, AIP Conf. Proc., 2018, 1953, 030052 CrossRef.
- S. Birgisson, D. Saha and B. B. Iversen, Cryst. Growth Des., 2018, 18, 827–838 CrossRef CAS.
- T. Kohler and T. Armbruster, J. Solid State Chem., 1997, 133, 486–500 CrossRef CAS.
- M. H. Alfaruqi, S. Islam, V. Mathew, J. Song, S. Kim, D. P. Tung, J. Jo, S. Kim, J. P. Baboo, Z. Xiu and J. Kim, Appl. Surf. Sci., 2017, 404, 435–442 CrossRef CAS.
- J. Yang, J. Wang, S. Ma, B. Ke, L. Yu, W. Zeng, Y. Li and J. Wang, Phys. E, 2019, 109, 191–197 CrossRef CAS.
- T. Wang, H. C. Chen, F. Yu, X. S. Zhao and H. Wang, Energy Storage Materials, 2019, 16, 545–573 CrossRef.
- J. Dong, Z. Hou, Q. Zhao and Q. Yang, E3S Web Conf., 2019, 79, 03002 CrossRef CAS.
- A. M. A. Hashem, H. A. Mohamed, A. Bahloul, A. E. Eid and C. M. Julien, Ionics, 2008, 14, 7–14 CrossRef CAS.
- J. U. Choi, C. S. Yoon, Q. Zhang, P. Kaghazchi, Y. H. Jung, K.-S. Lee, D.-C. Ahn, Y.-K. Sun and S.-T. Myung, J. Mater. Chem. A, 2019, 7, 202–211 RSC.
- P. Gao, P. Metz, T. Hey, Y. Gong, D. Liu, D. D. Edwards, J. Y. Howe, R. Huang and S. T. Misture, Nat. Commun., 2017, 8, 14559 CrossRef CAS.
- A. Khan, A. M. Toufiq, F. Tariq, Y. Khan, R. Hussain, N. Akhtar and S. ur Rahman, Mater. Res. Express, 2019, 6, 065043 CrossRef CAS.
- Z. Li, A. Gu, Z. Lou, J. Sun, Q. Zhou and K. Y. Chan, J. Mater. Sci., 2017, 52, 4852–4865 CrossRef CAS.
- Z. Wang, F. Wang, Y. Li, J. Hu, Y. Lu and M. Xu, Nanoscale, 2016, 8, 7309–7317 RSC.
- F. Fitriana, M. Zainuri, M. A. Baqiya, M. Kato, P. Kidkhunthod and S. Suasmoro, Bull. Mater. Sci., 2020, 43, 152 CrossRef CAS.
- M. Klinger, J. Appl. Crystallogr., 2017, 50, 1226–1234 CrossRef CAS.
- S. Rong, P. Zhang, F. Liu and Y. Yang, ACS Catal., 2018, 8, 3435–3446 CrossRef CAS.
- L. Lutterotti, Acta Crystallogr., Sect. A: Found. Crystallogr., 2000, 56, s54 Search PubMed.
- D. Mondal, B. K. Paul, S. Das, D. Bhattacharya, D. Ghoshal, P. Nandy, K. Das and S. Das, Langmuir, 2018, 34, 12702–12712 CrossRef CAS.
- K. Momma and F. Izumi, J. Appl. Crystallogr., 2011, 44, 1272–1276 CrossRef CAS.
- D. P. Dubal, W. B. Kim and C. D. Lokhande, J. Phys. Chem. Solids, 2012, 73, 18–24 CrossRef CAS.
- N. Rajamanickam, P. Ganesan, S. Rajashabala and K. Ramachandran, 2014, 5.
- T. Gao, M. Glerup, F. Krumeich, R. Nesper, H. Fjellvåg and P. Norby, J. Phys. Chem. C, 2008, 112, 13134–13140 CrossRef CAS.
- A. M. Toufiq, F. Wang and H. U. Shah, Phys. Status Solidi C, 2017, 3 Search PubMed.
- J. E. Post, D. A. McKeown and P. J. Heaney, Am. Mineral., 2020, 105, 1175–1190 CrossRef.
- C. Julien and M. Massot, Phys. Chem. Chem. Phys., 2002, 4, 4226–4235 RSC.
- R. Selvamani, G. Singh, V. Sathe, V. S. Tiwari and P. K. Gupta, J. Phys.: Condens. Matter, 2011, 23, 055901 CrossRef.
- M. A. G. Soler and F. Qu, in Raman Spectroscopy for Nanomaterials Characterization, ed. C. S. S. R. Kumar, Springer, Berlin, Heidelberg, 2012, pp. 379–416 Search PubMed.
- N. Jain and A. Roy, Phase & Morphology Engineered Surface Reducibility of MnO2 Nano-heterostructures: Implications on Catalytic Activity Towards CO Oxidation, 2019 Search PubMed.
- E. Beyreuther, S. Grafström, L. M. Eng, C. Thiele and K. Dörr, Phys. Rev. B, 2006, 73, 155425 CrossRef.
- N. Vilas Bôas, J. B. Souza Junior, L. C. Varanda, S. A. S. Machado and M. L. Calegaro, Appl. Catal., B, 2019, 258, 118014 CrossRef.
- R. A. Davoglio, G. Cabello, J. F. Marco and S. R. Biaggio, Electrochim. Acta, 2018, 261, 428–435 CrossRef CAS.
- G. Yan, Y. Lian, Y. Gu, C. Yang, H. Sun, Q. Mu, Q. Li, W. Zhu, X. Zheng, M. Chen, J. Zhu, Z. Deng and Y. Peng, ACS Catal., 2018, 8, 10137–10147 CrossRef CAS.
- M. A. Farid, H. Zhang, X. Lin, A. Yang, S. Yang, F. Liao and J. Lin, 2012, 7.
- R. Zhang, X. Yu, K.-W. Nam, C. Ling, T. S. Arthur, W. Song, A. M. Knapp, S. N. Ehrlich, X.-Q. Yang and M. Matsui, Electrochem. Commun., 2012, 23, 110–113 CrossRef CAS.
- H.-E. Nieminen, V. Miikkulainen, D. Settipani, L. Simonelli, P. Hönicke, C. Zech, Y. Kayser, B. Beckhoff, A.-P. Honkanen, M. J. Heikkilä, K. Mizohata, K. Meinander, O. M. E. Ylivaara, S. Huotari and M. Ritala, J. Phys. Chem. C, 2019, 123, 15802–15814 CrossRef CAS.
- R. E. John, A. Chandran, J. George, A. Jose, G. Jose, J. Jose, N. V. Unnikrishnan, M. Thomas and K. C. George, Phys. Chem. Chem. Phys., 2017, 19, 28756–28771 RSC.
- Y. Xie, Y. Jin and L. Xiang, Crystals, 2017, 7, 221 CrossRef.
- A. Rahal, S. M. Borchani, K. Guidara and M. Megdiche, R. Soc. Open Sci., 2018, 5, 171472 CrossRef CAS.
- S. I. Shah, S. Zulfiqar, T. Khan, R. Khan, S. A. Khan, S. A. Khattak and G. Khan, J. Mater. Sci.: Mater. Electron., 2019, 30, 19199–19205 CrossRef CAS.
- R. E. John, A. Chandran, M. Samuel, M. Thomas and K. C. George, Phys. E, 2020, 116, 113720 CrossRef CAS.
| This journal is © The Royal Society of Chemistry 2021 |

