
 Open Access Article
 This Open Access Article is licensed under a Creative Commons Attribution-Non Commercial 3.0 Unported Licence
Facile synthetic route to exfoliate high quality and super-large lateral size graphene-based sheets and their applications in SERS and CO2 gas sensing†
Ningthoujam Somorjit Singh a,
Franco Mayanglambama,
Harshal B. Nemadeab and
P. K. Giri*ac
a,
Franco Mayanglambama,
Harshal B. Nemadeab and
P. K. Giri*ac
aCentre for Nanotechnology, Indian Institute of Technology Guwahati, Guwahati-781039, India. E-mail: giri@iitg.ac.in
bDepartment of Electronics and Electrical Engineering, Indian Institute of Technology Guwahati, Guwahati-781039, India
cDepartment of Physics, Indian Institute of Technology Guwahati, Guwahati-781039, India
First published on 3rd March 2021
Abstract
A combination of low-cost synthetic route and simplified exfoliation technique to develop high-quality graphene-based sheets with very large lateral dimensions, which are viable to scale up, remains a challenging problem. Herein, super-large graphene oxide (GO) sheets with lateral size up to 104 μm with a surface area of 6831 μm2 have been developed based on a simple approach using mild heating conditions, and subsequent deoxygenation yields reduced graphene oxide (rGO) sheets. With the decrease in number of layers (<10, <5, bi-layer and mono-layer) in GO, the Raman intensity ratio, ID/IG value increases systematically from 0.73 to 0.97. The efficacy of reducing oxygen-containing functional groups from GO to rGO is confirmed from Fourier transform infrared spectroscopy, X-ray photoelectron spectroscopy, UV-visible absorption spectroscopy, photoluminescence, and thermogravimetric analysis. Current–voltage measurements revealed substantial improvement of current by three orders of magnitude upon reduction of GO to rGO, which is consistent with the significant decrease in charge transfer resistance in rGO, as revealed from the electrochemical impedance spectra. The large-area GO and rGO sheets when applied in surface-enhanced Raman scattering (SERS) exhibited a large enhancement factor of 104 and high detection capability down to a concentration of 10 nM for Rhodamine B. Furthermore, the rGO incorporated hybrid rGO–SnO2 demonstrated ∼50% improvement in sensitivity for CO2 gas sensing as compared to the commercial SnO2 based gas sensor. The higher sensitivity in the rGO case is ascribed to its high surface area, as revealed from the BET analysis. Therefore, the present simplified and economical approach of large-area graphene oxide could potentially open up a new strategy for industrial-scale production in the future.
1. Introduction
Following the discovery of graphene,1 derivatives of graphene are intensely appealing to numerous research domains owing to their distinctive behaviors, such as tunable electrical conductivity,2–5 excellent mechanical properties,6–8 high corrosion resistance,9–11 extremely efficient electrocatalytic activity12,13 and so forth.10 These unique properties depend on the lateral dimension and thickness of the synthesized graphene sheets.14 Besides, the limitation for mass production lies in the complexities involved, related to the requirement of high-cost equipment for bottom-up synthesis protocol, rigorous exothermic reactions, and also several steps associated with the top-down synthesis method despite having the better potential for scale-up for the latter process than the former synthesis route. Furthermore, the need for extreme care during exfoliation for the top-down synthesis protocol to obtain high quality and large lateral size graphene-based sheets is of significant concern to implement in wide-scale electronic applications, in particular its sensing applications.Exfoliation from chemically synthesized graphene oxide is cost-effective and most of the functional properties can be tailored from the degree of oxidation–reduction processes. Several top-down exfoliation techniques have been reported emphasizing on the lateral size of graphene sheets, their functional property, practicality to scale up and their viable applications. There are also reports on electrochemical exfoliation,3,15–20 ultrasonic exfoliation,5,21–29 microwave-assisted exfoliation,30–32 and a few studies on shear-mechanical exfoliation,33–35 hydrothermal4 and thermal techniques,36 and freezing–thawing based37 exfoliation, etc. Table 1 collates various exfoliation techniques for graphene-based sheets, nature of solvent used, the resulting lateral size and their applications.
| Exfoliation method | Nature of solvent | Lateral size | Applications | Reference |
|---|---|---|---|---|
| a Aq.: aqueous carbonate, NMP: N-methyl-2-pyrrolidone, PC: propylene, AS: ammonium sulfate, PTCA: perylene tetracarboxylate, SL: sodium laurate, CHP: 1-cyclohexyl-2-pyrrolidinone, DMSO: dimethyl sulfoxide, THP: tetrahydropyran, DMF: dimethylformamide, DDAC: dodecylamine hydrochloride, DDBAC: dodecyl dimethyl benzyl ammonium chloride. | ||||
| Electrochemical | DMF | 30 μm | Flexible electronics | 15 |
| Electrochemical | Aqueous salt | 20 μm | Flexible electronics | 16 |
| Electrochemical | Water | 1–5 μm | SERS | 17 |
| Electrochemical | Aq. salt | 44 μm | Flexible supercapacitor | 2 |
| Electrochemical | Water | 740 nm | Flexible electronics | 3 |
| Electrochemical | NMP | 10–30 μm | Supercapacitor electrodes | 18 |
| Electrochemical | PC | 50 μm | — | 19 |
| Electrochemical | Aq. AS | >30 μm | — | 20 |
| Ultrasonic | Imidazole | 10 μm | Supercapacitor | 22 |
| Ultrasonic | Pyridine | <1 μm | Mechanical | 8 |
| Ultrasonic | Water | >30 μm | Highly conductive film | 38 |
| Ultrasonic | Aq. salt | Up to 30 μm | Thin film devices | 24 |
| Ultrasonic | Aq. PTCA | 10–12 μm | Conductive wire | 25 |
| Ultrasonic | Aq. salt | 5–10 μm | Electrochemical sensors | 5 |
| Ultrasonic | Aq. salt | Tens of microns | Li-battery electrode | 27 |
| Ultrasonic | Water/SL/DDAC/DDBAC | 100 nm to 1 μm | — | 29 |
| Ultrasonic | Aq. salt | 100 s of nm to several μm | Ultracapacitor | 28 |
| Microwave | Water | 30 μm | — | 30 |
| Microwave | CHP/DMF/NMP/ionic liquid | 2–7 μm | 3D printing | 31 |
| Shear force | Water | 106 μm | — | 33 |
| Shear force | Water | 50 μm | Energy storage | 34 |
| Shear force | — | 1 μm | Mechanical | 35 |
| Freeze–thaw | Anhy. THF/DMSO | 4 μm | Electronics and energy storage | 37 |
| Hydrothermal | Aq. glucose | 20–100 μm | Photodetector | 4 |
| Present study | Water | 104 μm | SERS, gas sensor | — |
Although several techniques have been reported to exfoliate graphene derivatives into few layers of large lateral size, the hydrothermal method has shown to be promising technique exhibiting its relative cost-effectiveness, producing excellent yield with controllable and large lateral size with outstanding electrical properties. However, this method requires additional autoclave equipment and the exfoliation processes at high temperature up to 220 °C. Therefore, there is a further demand for a simpler and more cost-effective approach to exfoliate very large lateral dimension graphene-based sheets, exhibiting high electrical and sensing performances.
Herein, we demonstrate a facile and simple technique at minimal cost (about 10 times lower than the commonly used ultrasonic technique) to exfoliate graphene oxide (GO) based on mild temperature hydrothermal at ambient condition up to 80 °C, which is 3 times lower than the conventional hydrothermal method, eliminating the need of high temperature used in high-pressure hydrothermal method. Subsequently, reduced graphene oxide (rGO) was synthesized by chemical reduction/deoxygenation. The morphology and lateral dimensions of the GO and rGO were investigated by optical microscope, field emission scanning electron microscopy (FESEM) and atomic force microscopy (AFM). The structural quality and characteristics of GO and rGO were further analyzed using Raman spectroscopy, X-ray diffraction (XRD), X-ray photoelectron spectroscopy (XPS), FT-IR, UV-vis absorption spectroscopy, photoluminescence (PL), thermo gravimetric analysis (TGA) and Brunauer–Emmett–Teller (BET) analysis. The electronic and electrochemical behaviors were investigated from current–voltage (I–V) characterization and electrochemical impedance spectra. The sensing application of large-area GO and rGO was also explored using Rhodamine B at low concentrations to test surface-enhanced Raman spectroscopy effect. Furthermore, CO2 gas sensing capability was investigated with rGO–SnO2 composite.
2. Experimental details
2.1. Synthesis of graphene oxide and exfoliation
4 g of potassium permanganate (KMnO4) and 0.5 g of graphite flakes (supplied by Asbury Carbon) were taken in a borosilicate conical flask. 100 mL of sulphuric acid (98% conc. H2SO4) was added to the mixture, followed by 0.5 g of sodium nitrate (NaNO3). The synthesis steps are illustrated in the schematic representation in Fig. S1 (ESI†). The solution was stirred occasionally for 14 h, and then it was diluted with 100 mL of de-ionized water. 4 mL of 30% hydrogen peroxide (H2O2) was added and stirred mildly. The solution was further diluted with de-ionized water and made up to 2 L. The precipitate was allowed to settle overnight. The supernatant liquid was discarded, and fresh de-ionized water was added again and diluted to make up to 2 L. pH was about 1.8. The solution was allowed to settle overnight as before and then the supernatant liquid was discarded. About 400 mL of the sediment solution was left at the bottom. The sediment solution was taken out for centrifugation (Legend X1R Centrifuge, Thermo Scientific) at 9000 rpm for 30 min using 30 mL centrifuge tubes. The supernatant liquid was discarded, and de-ionized water was added to the tubes (pH was 3.6). The solution was washed several times to attain neutral pH using de-ionized water and filtered using vacuum filtration (grade 1, Whatman filter paper). The as-obtained graphitic oxide was vacuum dried at 35 °C for 48 h. All Chemicals (KMnO4, H2SO4, NaNO3, and H2O2) were procured from Merck.The synthesized GO flakes were exfoliated using two different techniques; (a) mild heating condition and (b) ultrasonication. For mild heating exfoliation, 3 mg of synthesized GO was added into a 250 mL beaker containing 100 mL of de-ionized water (Milli-Q) and heated at a constant temperature of 80 °C for two hours at atmospheric pressure using a hot plate (Anitech). Notably, the separation of smaller flakes was visible. The snapshots for the exfoliation stages are shown in Fig. S2 (ESI†). It was cooled down to room temperature. The solution was centrifuged, subsequently, at 9000 rpm for 15 min, 3000 rpm for 15 min, and 300 rpm for 45 min. Each step is followed by discarding the supernatant liquid and refilling it with de-ionized water. However, after the last step (300 rpm), the supernatant liquid was used for further characterization and analyses. For comparison, ultrasonic exfoliation was performed using 3 mg of synthesized GO in a 100 mL beaker containing 50 mL de-ionized water. The solution was sonicated using a conventional water-bath sonicator (LMUC 2, Labman) for 15 min at a power of 50 W. After uniform dispersion of GO flakes, it was centrifuged, subsequently, at 9000 rpm for 15 min, 3000 rpm for 15 min, and 300 rpm for 45 min. Similarly, each step is followed by discarding the supernatant liquid and refilling it with de-ionized water. The supernatant liquid was used for further characterization and studies. The graphene oxide sheets exfoliated using ultrasonication technique and mild heating-based method are named as UGO and GO, respectively.
2.2. Synthesis of reduced graphene oxide
The exfoliated GO was reduced to eliminate the defects and oxygen-containing functional groups partially. The reduction process was performed by the chemical reduction process. The reduced GO is named as rGO. The exfoliated GO solution was drop cast onto SiO2 substrate and dried in a hot air oven (ICON instrument) at 85 °C for 5 h. The dried substrate was immersed inside a 250 mL beaker containing 10 μL of hydrazine monohydrate in 100 mL de-ionized water, heating at 95 °C for three hours using a hot plate (Anitech). The rGO material onto SiO2 substrate was taken out and dried for further characterization.2.3. Characterization techniques
The lateral dimension of UGO, GO, and rGO sheets were observed using an optical microscope (Leica DM 2500M) in reflection mode. Microstructural features were studied using field emission scanning electron microscope (FESEM, JEOL, JSM-7610F). High magnification morphology of GO and rGO was examined using a field emission transmission electron microscopy (FETEM, JEOL JEM-2100F), operated at an accelerating voltage of 200 kV. The thickness and dimension of the sheets were further examined by AFM (Bruker, Innova series) in tapping mode. The crystalline nature and the interlayer spacing of graphite, GO and rGO were studied from X-ray diffraction (XRD), Rigaku RINT 2500 TTRAX-III, using CuKα radiation. The functional groups present on the basal plane and edge of GO and rGO were analyzed by Raman spectrometer (Horiba Jobin, LabRam HR). Before the measurement, the samples drop-cast onto a Si substrate were focused using 100× optical microscope with a spatial resolution of ∼1 μm, and 532 nm laser was used to excite the sample. Fourier transform infrared (FTIR) spectroscopy (Perkin Elmer, Spectrum BX) was used to analyze the functional groups of GO and rGO. Sample preparation involved mixing of graphene-based materials and KBr powder, and thin circular pellets were made by using the KBr pellet machine. Thermogravimetric analysis was performed using HITACHI STA7200, Thermal analyzer with a heating rate of 5 °C min−1. X-ray photoelectron spectroscopy (XPS) analysis was performed using XPS microprobe (PHI X-tool, ULVAC-PHI INC.) with Al Kα as X-ray source at 20 kV and 54 W. Commercial UV-visible spectrophotometer (Shimadzu, UV3101PC) was used to obtain the UV-visible absorption spectra. Photoluminescence measurement was conducted using a commercial fluorimeter (Fluromax-4, Horiba) with a xenon lamp source. GO and rGO samples were excited at 360 nm wavelength. The surface area and pore volume of graphene-based material was studied using BET (Brunauer–Emmett–Teller) method using Micromeritics, TriStar II instrument at 77 K. The specific surface area and pore volume were calculated from the N2 adsorption/desorption isotherm data. Prior to the experiment, the graphene-based material was heated at 50 °C for 24 h in an oven.The I–V measurements were performed using a home-made set-up with a source meter (Keithley 2400, Germany) and the data were retrieved using KickStart Instrument control software (version 1.9.8). Electrochemical impedance spectra were obtained using a Gamry potentiostat instrument (Model: Reference 600+) in a three-electrode system (Ag/AgCl as a reference, a platinum wire as counter and graphene-based materials drop-cast onto a platinum disk of 3 mm diameter as a working electrode). 0.5 M H2SO4 was used as the electrolyte. For drop-casting, the graphene-based ink was prepared using 5 mg of GO/rGO and mixed with 87 μL of Nafion, 261 μL of ethanol, and 652 μL of de-ionized water. The frequency range was between 0.1 Hz and 106 Hz with a sinusoidal ac amplitude of 10 mV.
Chemical sensing application of UGO, GO, and rGO was studied using various concentrations of Rhodamine B (RhB, 10−4 M, 10−5 M, 10−6 M, 10−7 M, and 10−8 M). Comparative study onto different substrates such as UGO, GO, rGO, and bare SiO2 was conducted to test the surface-enhanced Raman scattering (SERS) effect for RhB detection using the above Raman spectrometer. CO2 gas sensing application is also explored using the large-area rGO, incorporated with SnO2. The maximum exposer limit for CO2 gas concentration in a toxic atmosphere is up to 5000 ppm. Therefore, the CO2 concentration for the present experiment was chosen from 250 ppm up to 5000 ppm. For simplicity and ease of fabrication and to measure the effect of rGO in CO2 gas sensor, the SnO2 thin film was deposited on the hollow-cylindrical shape Al2O3 substrate. Highly diluted 20 μL of rGO solution was drop-cast on the SnO2 thin film and then dried at 85 °C overnight in an oven. The working voltage for the heating coil for the substrate holder was 5 V.
3. Results and discussion
3.1. Morphological and microstructural analyses
The typical surface-rippling and wrinkle-shaped structure of the graphene sheet is clearly seen in the optical image (Fig. 1a). Fig. S3 (ESI†) shows optical images for exfoliated flakes of UGO obtained from conventional ultrasonication (Fig. S3a†), GO from mild condition process (Fig. S3c†), and chemically reduced GO (rGO) (Fig. S3e†) and their corresponding statistical lateral size distribution, as represented in Fig. S3b, d and f,† respectively. For the samples prepared by ultrasonication (Fig. S3a†), GO sheets appear smaller in lateral size, and some are broken further into several smaller pieces. Asymmetric distribution with a mixture of bigger and smaller flakes, exhibiting irregular shapes, appears staking and overlapping on each other. The distribution of lateral size, as shown in Fig. S3b,† indicates that the majority of the lateral dimension is 4–5 μm. In the case of GO prepared by mild heating condition (Fig. S3c†), the lateral size of the few layers of sheets is remarkably larger than that of sheets obtained from the ultrasonic process. The maximum size obtained is ∼104 μm, which is the largest lateral size of GO reported till date, to our knowledge, using such kind of a facile and simplified mild condition exfoliation route. However, smaller sheets of thicker with many stacked layers, illustrated by darker shades, overlapping the large dimensional flake are also seen. The corresponding statistical distribution of flakes size evaluated from 54 number of flakes using an optical microscope is presented (Fig. S3d†). The majority of the flakes are in the range of 40–50 μm. The statistics indicates that the flakes are well separated and distinguishable enabling the size measurement of the lateral dimension by end to end demarcation. Fig. S3e† exhibits the flakes for rGO and their lateral size. A very large lateral size in the range 100–110 μm is obtained, as seen at the bottom portion of the optical image. However, the smaller flakes appear relatively thicker, as depicted by the darker patches. The majority of the lateral dimensions are in the range 40–50 μm (Fig. S3f†). Some of the layers are found to be folded and stacked in all the images.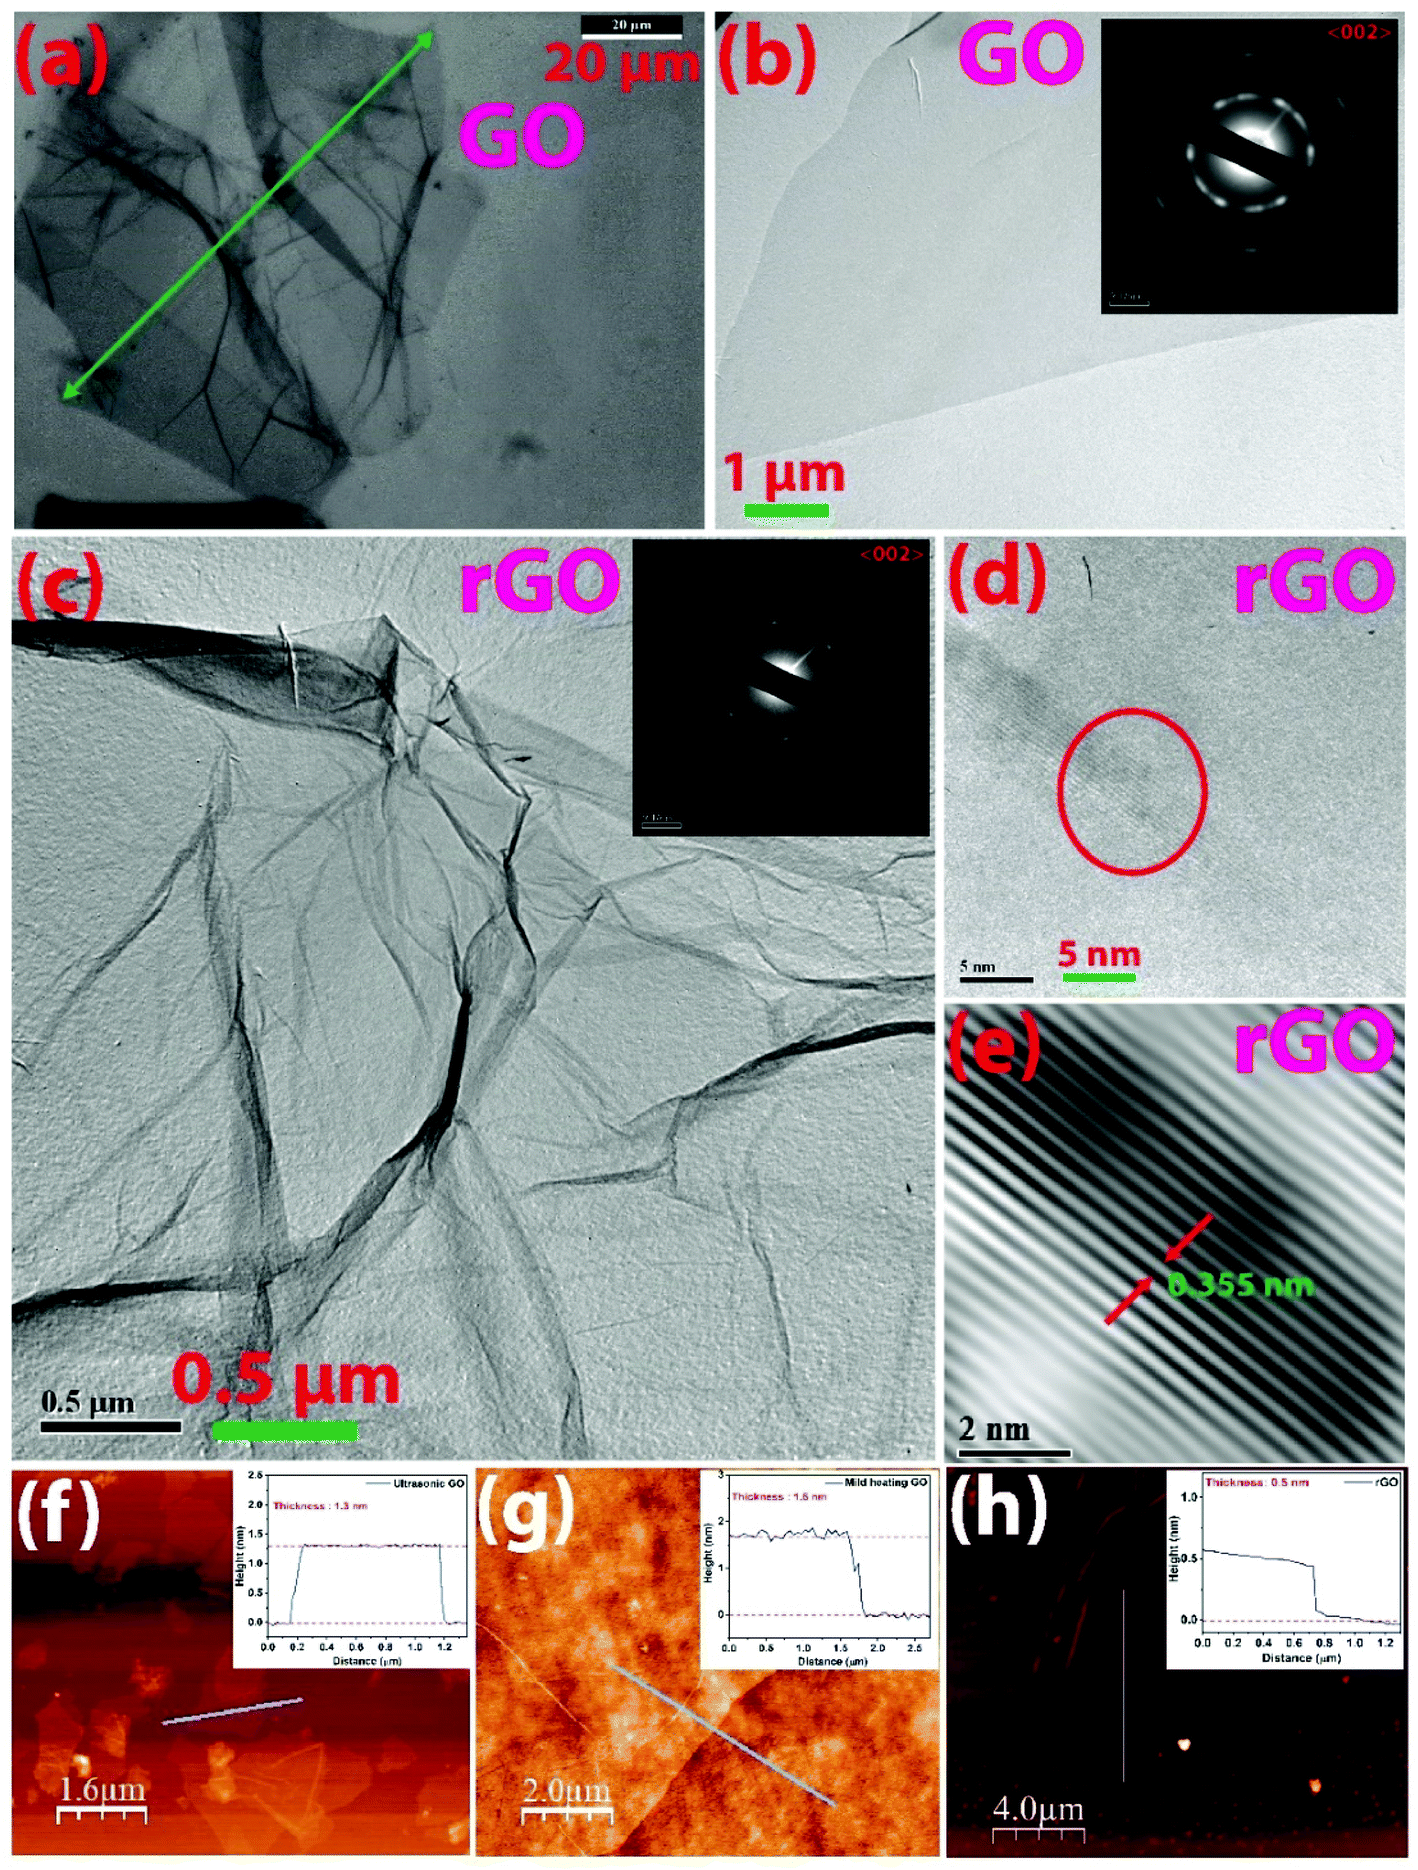 | ||
| Fig. 1 Higher magnification images of GO and rGO showing the nano-/micro features and diffraction of graphene-based sheets; (a) optical image showing the dimension of the GO sheet; (b) TEM image for large-area GO sheet with SAED pattern (inset); (c) TEM image for rGO sheet with SAED pattern (inset); (d) HRTEM nanographs showing interlayer spacing of rGO; (e) magnified pattern for the interlayer spacing of rGO; AFM images and the height profiles (inset) indicating the thickness of the sheet for (f) UGO, (g) GO and (h) rGO. | ||
The exfoliation of the GO is studied at different operating temperatures; room temperature (RT, 25 °C), 40 °C, 50 °C, 60 °C, 70 °C, and 80 °C. The optical images of the exfoliated GO sheets are shown in Fig. S4† (ESI†). GO flakes are seen to be exfoliated at all the temperatures, and the optimum temperature for GO exfoliation is 80 °C. At 80 °C, large number of GO flakes are exfoliated and the super large size of the GO sheets are obtained. If the operating temperature increases beyond 80 °C, it is expected that the evaporation of the solvent will occur with more kinetic energy, leading to the break down of the GO sheets. For the ultrasonic technique, the exfoliation for different sonication times (5 minutes, 15 minutes, 30 minutes, 60 minutes, and 180 minutes) is analyzed, as shown in Fig. S5 (ESI†). The optical microscopic analysis reveals that it is difficult to control the size and thickness of the UGO flakes using the ultrasonication technique. For 5 minutes of exfoliation of UGO using ultrasonication, most of the graphite oxide flakes are not exfoliated. After 15 and 30 minutes, the GO flakes break down into smaller pieces and they exist mostly with multi layered GO flakes. After 60 and 180 minutes of ultrasonication, the UGO sheets are almost broken down.
A closer observation in TEM from the portion of large lateral size GO sheet shows that the sheet has high optical transparency, suggesting the thin graphitic nanostructure (Fig. 1b). The selected area electron diffraction (SAED) pattern in Fig. 1b (inset) shows bright diffraction spots, which indicate the crystalline structure of GO having (002) plane. However, the blurry/less sharp spots suggest the presence of functional groups. The wrinkled nano feature is also preserved in the few layers of rGO as observed in TEM images (Fig. 1c). SAED pattern shows polycrystalline nature for rGO having (0 0 2) plane (Fig. 1c (inset)). However, in the case of rGO, the well-defined bright and sharp six-fold spots are the hexagonal honeycomb framework of the graphene skeleton, indicating the restoration of the sp2 character of carbon structure after the removal of oxygen-containing functional groups during the reduction process. The crystallinity is confirmed from the distinct lines from diffraction with an interlayer spacing of 0.355 nm (Fig. 1d and e). The FESEM images of the large-area GO and rGO sheets are shown in Fig. S6a and b,† respectively. The elemental composition of the GO and rGO sheets are obtained by using EDX technique (Fig. S6c and d†). The oxygen composition of rGO is 7.1%, which is reduced from 34.4% in GO, corroborating with the information from the XPS analysis discussed later. The high content of the oxygen and carbon elements confirms the proper GO.
To study the thickness of GO and rGO layers, selected flakes drop-cast onto SiO2 substrate were scanned in AFM and the cross-sectional height profile is shown in Fig. 1f–h. The thickness of the ultrasonically exfoliated (UGO) sheet is shown to be 1.3 nm from the height profile analysis (Fig. 1f). For mild temperature exfoliated GO, the thickness is found to be 1.6 nm (Fig. 1g). Ideally, ∼0.34 nm should be the thickness of a single carbon layer in graphene. However, slightly thicker layer for GO as compared to that of van der Waal's thickness of ∼0.34 nm is due to the presence of surface oxygen functional groups and displacement of sp3 hybridized carbons below and above the planar graphene framework.37 Single-layer characteristics of graphene oxide with thicknesses of 1 nm,37 1.10 nm,4 1.20 nm,33 and 0.75 nm (ref. 34) were reported. The variation of the reported thickness values is due to the instrumental offset error, substrate effect, and physisorption of unwanted impurities. Reports by Gee et al. and Tang et al.16,17 have indicated that the thickness value of ∼2.2 nm is the characteristics of a two-layer graphene sheet. Therefore, in this study, mono-layer GO can be confirmed both from mild heating (thickness of 1.6 nm) and ultrasonication (thickness of 1.3 nm) techniques. Various dimensions of flakes having a single layer or few layers of GO are distributed without significant lateral agglomeration. Lower magnification AFM micrographs scanned over the large surface area of 100 × 100 μm2 is shown in Fig. S7 (ESI†). In the case of UGO (Fig. S7a†), multiple numbers of UGO flakes are present in the area of 100 × 100 μm2, but mild heating-based GO (Fig. S7b†) and reduced rGO (Fig. S7c†) exhibit single sheet in the area of 100 × 100 μm2. Interestingly, the thickness of rGO (0.5 nm) is much lower than the GO sheet (shown in the thickness profile corresponding to Fig. 1h), depicting the absence of/minimized oxygen-containing functional group on the basal plane. The mono-layer rGO is also confirmed from the AFM analysis.
The mechanism for the mild temperature exfoliation is presented in Fig. 2. It is proposed that the water molecules gain kinetic energy owing to the gradual heat supply, which facilitates to enter and adsorb or intercalate between the layers of GO. The entrance of the intercalating molecules could orient towards the electrostatic interaction with the opposite charge of the oxygen attached as a functional group onto basal GO plane and edge sites, thereby weakening the π–π interlinkage between the layers which eventually decrease the van der Waal forces between the layers. On attaining sufficient heat energy, the intercalated molecules forming hydrogen bonding with the oxygen-containing functional group enhances susceptibility to exfoliate large lateral size sheets due to reduced van der Waal force between the two layers of GO as compared to graphite. Besides, exfoliated GO could also augment further exfoliation for other thicker flakes as evidenced from physical observation during the process wherein fragmented thinner flakes rise on gaining kinetic energy and subsequently strike other thicker flakes. This GO mediated-exfoliation occurs mechanically, arising from temperature-assisted momentum. Chong et al.33 reported on the GO-assisted mechanical exfoliation of graphite using the hydrothermal method. However, we adopted the ambient pressure mild heating condition without using high-temperature and high-pressure autoclave reaction. Hence, the present simplified exfoliation technique could be a combination of mild temperature heating, augmenting the intercalation between GO layers, and the fragmented GO-mediated mild mechanical exfoliation.
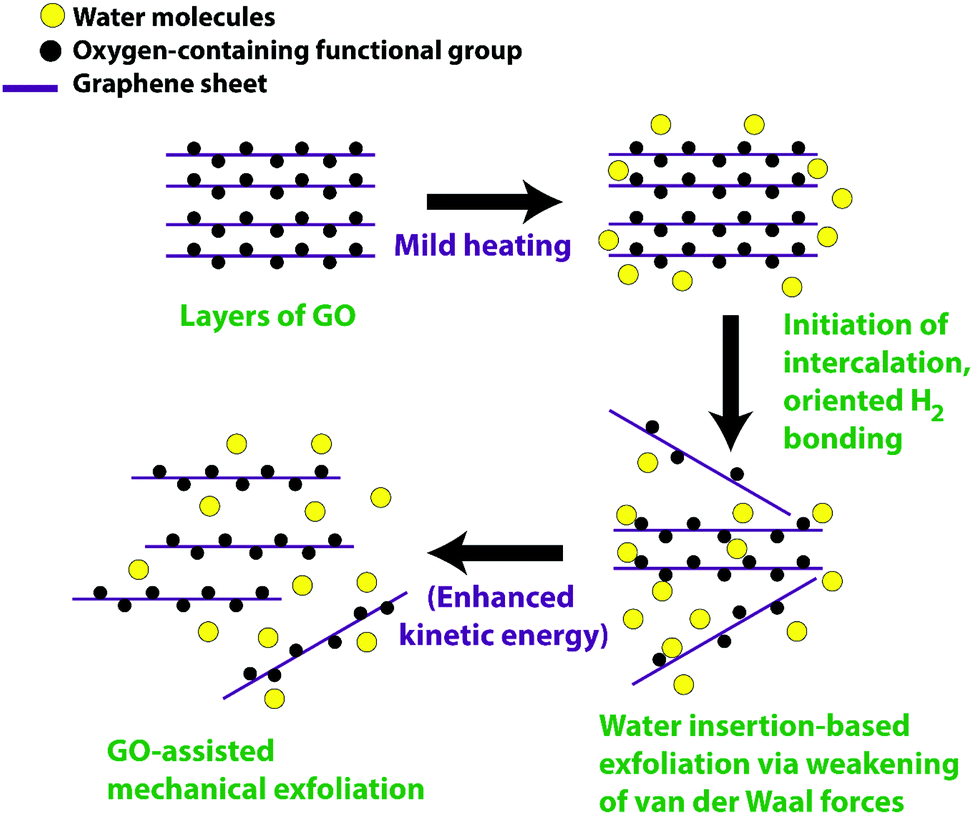 | ||
| Fig. 2 Proposed mechanism for the mild heating and mechanical-assisted exfoliation of graphene oxide. | ||
3.2. Structural and chemical features of GO and rGO
Fig. 3a shows the XRD pattern for graphite flakes, GO and rGO. The sharp peak located at 2θ = 26.7° corresponds to graphite, with layers stacking upon one another. The interlayer spacing, calculated using Bragg's law (nλ = 2d![[thin space (1/6-em)]](https://www.rsc.org/images/entities/char_2009.gif) sinθ) is 0.33 nm. The observed peak is from the reflection of the basal plane (0 0 2) which is the characteristics of π–π stacking of the graphite layers.38 The broad peak at 2θ = 11.3° corresponds to GO with an increased interlayer spacing of 0.782 nm. The shift of 2θ value towards the lower side and the change in interlayer spacing to higher numbers indicate the presence of intercalated oxygen-containing functional groups on the upper and lower sides of the graphene oxide sheet, thereby expanding the interlayer spacing. The new shifted XRD pattern infers that the long-range periodicity and orderliness are modified along the c-axis18 due to distorted intrinsic structure and defects created during the oxidation. Furthermore, the peak becomes broader owing to the decrease in crystallite size, according to the Scherrer equation, which defines that the crystallite size is the reciprocal of the full width at half maximum. Hence, it indicates that the sheet size of GO is decreased as compared to that of graphite. For rGO, there is a upshift in the peak from 2θ = 11.3° to 2θ = 23.5°, and the corresponding interlayer spacing is 0.35 nm. The decrease in the d value indicates the proper reduction of the oxygen-containing group. During the reduction process, as the oxygen-containing group is reduced, the interlayer spacing is reduced, as expected. It is worthy to note that although the peak position in rGO changes towards a higher 2θ, the broadness of the peak does not change significantly as compared to GO, suggesting that the sheet sizes do not vary substantially. However, the restoration of sp2 carbon skeleton occurs in rGO.
sinθ) is 0.33 nm. The observed peak is from the reflection of the basal plane (0 0 2) which is the characteristics of π–π stacking of the graphite layers.38 The broad peak at 2θ = 11.3° corresponds to GO with an increased interlayer spacing of 0.782 nm. The shift of 2θ value towards the lower side and the change in interlayer spacing to higher numbers indicate the presence of intercalated oxygen-containing functional groups on the upper and lower sides of the graphene oxide sheet, thereby expanding the interlayer spacing. The new shifted XRD pattern infers that the long-range periodicity and orderliness are modified along the c-axis18 due to distorted intrinsic structure and defects created during the oxidation. Furthermore, the peak becomes broader owing to the decrease in crystallite size, according to the Scherrer equation, which defines that the crystallite size is the reciprocal of the full width at half maximum. Hence, it indicates that the sheet size of GO is decreased as compared to that of graphite. For rGO, there is a upshift in the peak from 2θ = 11.3° to 2θ = 23.5°, and the corresponding interlayer spacing is 0.35 nm. The decrease in the d value indicates the proper reduction of the oxygen-containing group. During the reduction process, as the oxygen-containing group is reduced, the interlayer spacing is reduced, as expected. It is worthy to note that although the peak position in rGO changes towards a higher 2θ, the broadness of the peak does not change significantly as compared to GO, suggesting that the sheet sizes do not vary substantially. However, the restoration of sp2 carbon skeleton occurs in rGO.
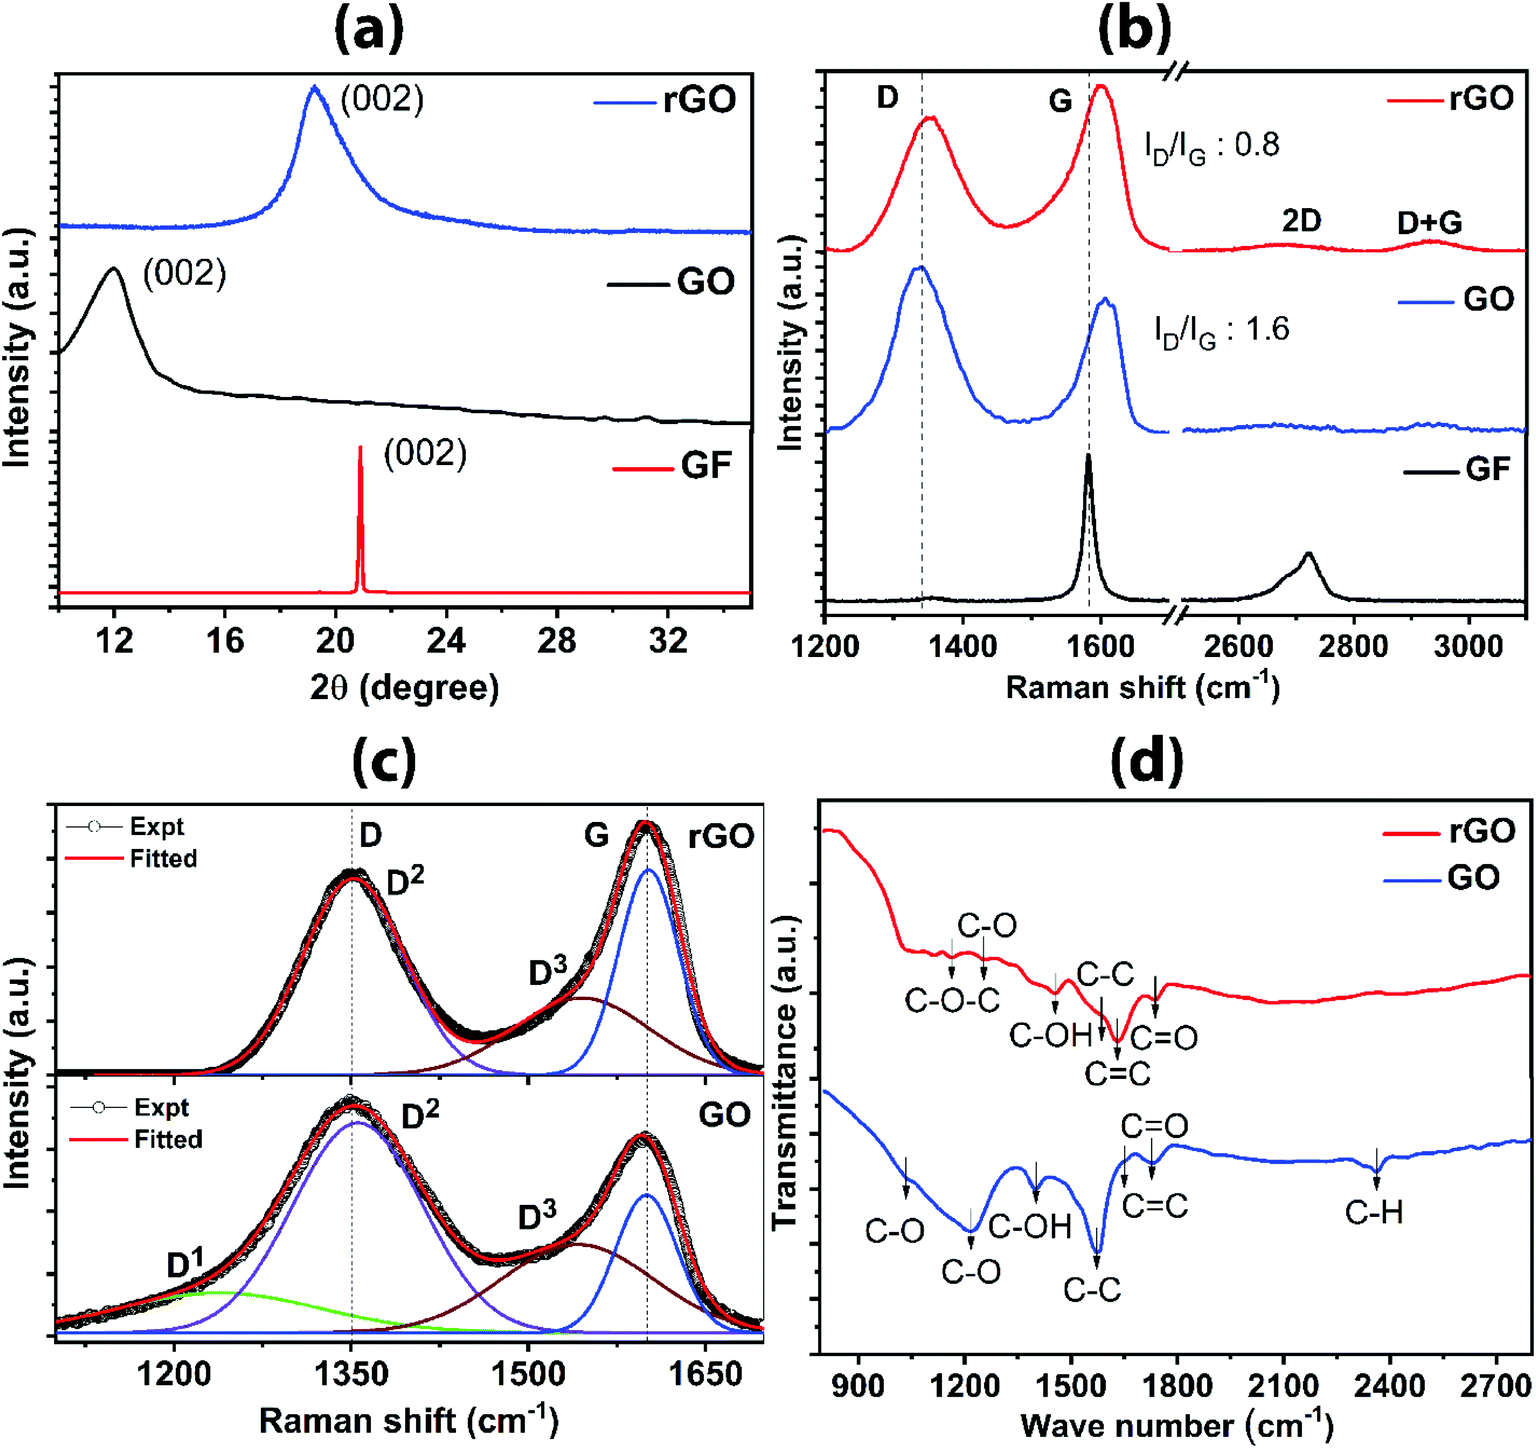 | ||
| Fig. 3 Characteristics of GO and rGO from various analyses; (a) XRD pattern; (b) Raman spectra indicating the typical D and G bands and their intensity ratio; Gaussian and Lorentzian fitting for (c) GO and rGO; (d) FTIR absorption spectra for different samples showing different bonds. | ||
Raman spectra revealing the functional group, defects and bonding characteristics for graphite, GO and rGO are shown in Fig. 3b. A sharp peak at 1582 cm−1 corresponds to the lattice framework of sp2 honeycomb carbons in graphite. The evolution of another prominent peak occurs at lower wavenumber for GO in addition to the original peak, comprising of two peaks (D-band at 1358 cm−1 and G-band at 1607 cm−1). D-band arises from breathing modes of six-atom ring activated by structural defects/disorder or interruption in the symmetric sp2 carbon bonds. The increase in intensity for D-band in GO as compared to graphite is attributed to oxidation-induced distortion of continuous sp2 plane. G-band is due to the in-plane lattice vibration of sp2 carbon atoms, particularly arising from E2g phonon at the Brillouin zone center.39 The intensity ratio (ID/IG) is a measure for the degree of defects in graphene materials;40 ID/IG = 1.6 is calculated from the GO spectrum, indicating the presence of defects on the basal carbon framework. There is a slight shift of G-band towards the higher side owing to the stress formed by bonding with the functional group during the oxidation process. The evolution of disorder-induced Raman spectra of carbons along an amorphization trajectory can be classified into three stages: (1) graphite to nanocrystalline graphite; (2) nanocrystalline graphite to low sp3 amorphous carbon; (3) low sp3 amorphous carbon to high sp3 (tetrahedral) amorphous carbon.39,41 In the present study for GO and rGO, stage 1 and stage 2 are more relevant. In stage 1 and stage 2 (a) appearance of D-band occurs, consequently, ID/IG increases; (b) D-band and G-band broaden; (c) emergence of oxygen-terminated nanocrystalline carbon band within D-band and amorphous sp2 carbon merged with G-band as represented in fitted spectra in Fig. 3c. Detailed analysis of bands by fitting the Raman spectra for GO sample shows D1 band at 1238 cm−1 corresponds to oxygen-terminated nanocrystalline diamond. D2 band at 1355 cm−1 relates to the symmetric breakdown of structure. D3 band at 1541 cm−1 correlates with amorphous sp2 carbon and G-band at ∼1603 cm−1 is attributed to sp2 bonded carbon atoms. In the case of rGO, the absence of D1 is an indication for the elimination of the oxygen group, which eventually restores the ordered hybridized sp2 carbon framework (Fig. 3c). In Fig. 3b, D-band occurs at 1352 cm−1 and G-band appears at 1601 cm−1. Reduction of the D peak intensity in rGO as compared to GO indicates the reduction/removal of oxygen-containing functional groups or healing of structural defects during exfoliation. Furthermore, a slight shifting of G-band towards the lower frequency side occurs due to the emergence of graphitic sp2 order. The quantitative confirmation of the degree of oxygen removal comes from the decrease in the value of ID/IG (0.8 for rGO), as compared to GO. The Raman scattering mapping for rGO is shown in Fig. S8 (ESI†). The Raman scattering was measured on the large surface area of rGO sheet (50 × 50 μm2) (Fig. S8a†). The cumulative Raman scattering signals (Fig. S8b†) for rGO sheet were obtained from the D and G bands. The uniform distribution of the intensity of Raman signals (D and G) were acquired. The intensity of the D band is in the range from 5500 to 7500 counts, and the intensity of G band is in the range from 7000 to 9000 counts. Using the Raman mapping measurement, rGO sheets of high quality and super large lateral size are confirmed.
Identification of various in-plane and edge oxygen functional groups in GO and rGO are further confirmed from the FTIR analysis. Fig. 3d represents the FTIR spectra of GO and rGO. Most of the peaks are concentrated in the range from 1000 to 2000 cm−1, which reveals the characteristic absorption bands of GO and rGO formation. The bands associated with the various oxygen functional groups and sp2 carbons can be distinguished from the FTIR spectrum. In the case of GO, a weak shoulder at 1035 cm−1 correlates with carbon–oxygen (alkoxyl); distinctive band appeared at 1226 cm−1 corresponds to the carbon–oxygen vibration, 1403 cm−1 band is assigned to the –OH in-plane bends (deformation), 1564 cm−1 band corresponds to the sp3 C–C stretching, low-intensity band at 1593 cm−1 corresponds to the sp2 C![[double bond, length as m-dash]](https://www.rsc.org/images/entities/char_e001.gif) C and 1753 cm−1 band is due to the presence of carbonyl group. Carbon–hydrogen bond character is shown in the band centered at 2363 cm−1. In the case of rGO, the significant reduction of the band between 1000 cm−1 and 1500 cm−1, as compared to GO spectra, suggests the removal of weakly bonded carbon–oxygen groups, which indicate the effectiveness of nullifying the defects. Shoulder correlated to alkoxyl at 1035 cm−1 is absent and a significant band corresponding to carbon–oxygen vibration at 1226 cm−1 is missing. However, there are weakly absorbed bands at 1108 cm−1 due to C–O stretching; the band at 1160 cm−1 is attributed to C–O–C stretching; the band at 1453 cm−1 is due to C–OH; 1564 cm−1 band corresponds to the sp3 C–C stretching and the clear band at 1634 cm−1 corresponds to CC stretching and the weak band of the carbonyl group is found at 1743 cm−1. Thus, the weak bands in rGO as compared to GO indicate the removal of defects induced by the oxygen functional groups, which corroborate with the results from XRD and Raman analyses.
C and 1753 cm−1 band is due to the presence of carbonyl group. Carbon–hydrogen bond character is shown in the band centered at 2363 cm−1. In the case of rGO, the significant reduction of the band between 1000 cm−1 and 1500 cm−1, as compared to GO spectra, suggests the removal of weakly bonded carbon–oxygen groups, which indicate the effectiveness of nullifying the defects. Shoulder correlated to alkoxyl at 1035 cm−1 is absent and a significant band corresponding to carbon–oxygen vibration at 1226 cm−1 is missing. However, there are weakly absorbed bands at 1108 cm−1 due to C–O stretching; the band at 1160 cm−1 is attributed to C–O–C stretching; the band at 1453 cm−1 is due to C–OH; 1564 cm−1 band corresponds to the sp3 C–C stretching and the clear band at 1634 cm−1 corresponds to CC stretching and the weak band of the carbonyl group is found at 1743 cm−1. Thus, the weak bands in rGO as compared to GO indicate the removal of defects induced by the oxygen functional groups, which corroborate with the results from XRD and Raman analyses.
Bonding characteristics are further supplemented by XPS analysis, as shown in Fig. 4. The bonding elements are predominantly carbon and oxygen as indicated by two pronounced peaks exclusively from C 1 s and O 1 s (Fig. 4a and b). The raw data mainly consists of two peaks; the carbon basal plane and the oxygen-containing functional groups. However, the deconvoluted spectra contain several peaks corresponding to CC, C–O, CO and O–CO. For GO (Fig. 4a (inset)), the peak centered at 283.8 eV is assigned to CC. The second peak (raw data) centered at ∼286.5 eV, containing C–O (epoxy and hydroxyl groups), CO and O–CO bond characteristics, has high intensity (precisely, C–O → 286.3 eV, CO → 288 eV, and O–CO → 288.9 eV). In contrast, in the case of rGO (Fig. 4b (inset)), a sharp decrease in the second peak, correlated to combined peaks for C–O and CO at 286.3 eV and 288.3 eV, respectively, infers the reduced state of rGO by removing the significant oxygen-containing functional groups attached to the carbon framework. Besides, the peak for O–CO is suppressed in rGO, indicating the removal of the labile carboxylic group completely during the reduction process. Furthermore, sp2 character for carbon in rGO is revealed from the peak corresponding to CC at 284.5 eV, which confirms the efficacy of the reduction. The C/O ratio for rGO is 3.66, which is much larger than that of GO (0.417) as calculated from peak relative maxima of C 1s and O 1s, suggesting the minimal oxygen content on the reduced state of rGO, which agrees with the comparative analysis for the presence of oxygen-containing functional groups by the other techniques.
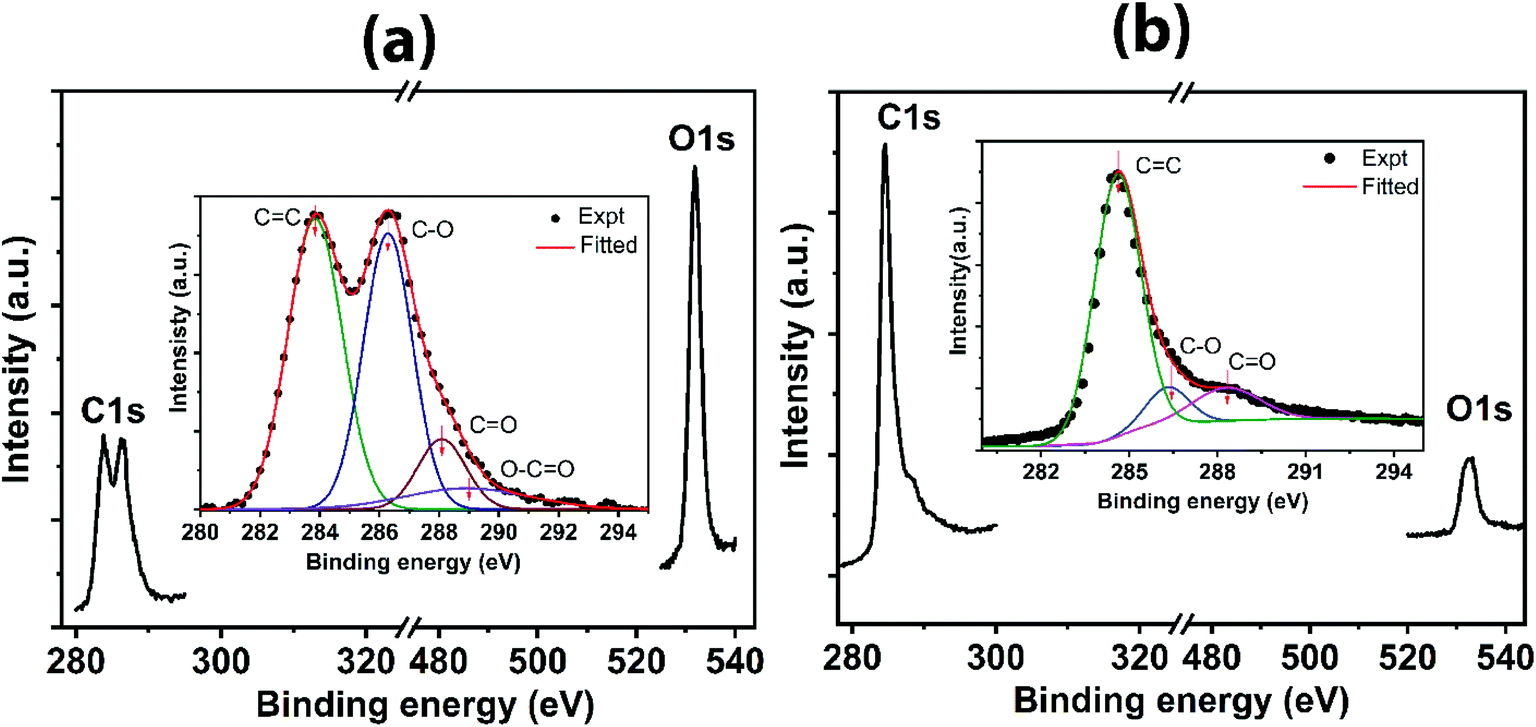 | ||
| Fig. 4 XPS spectra indicating (a) C 1s and O 1s for GO with deconvoluted C 1s spectra for GO (inset), and (b) C 1s and O 1s for rGO with deconvoluted C 1s spectra for rGO (inset). | ||
The UV-visible absorption spectra for GO and rGO are shown in Fig. 5a. For GO, a strong absorption peak at 230 nm can be assigned to π → π* transition or π-plasmon resonance common for extended sp2 conjugated carbon sheet (CC present within the aromatic sp2 hybridized carbon framework).25 A slight hump-like shoulder is also seen at 303 nm, which corresponds to n → π* from oxygen-containing functional groups. The presence of oxygen-containing functional groups is evident from the absorption spectra of GO. The redshift of the peak at 260 nm for rGO shows restoration of sp2 character predominantly from π → π* transition of CC without the presence of oxygen-containing absorption peak, as compared to GO spectrum, suggesting the deoxygenated rGO. The low energy transition corroborates with the previous results, indicating the reduction of defects, thereby decreasing the energy bandgap.
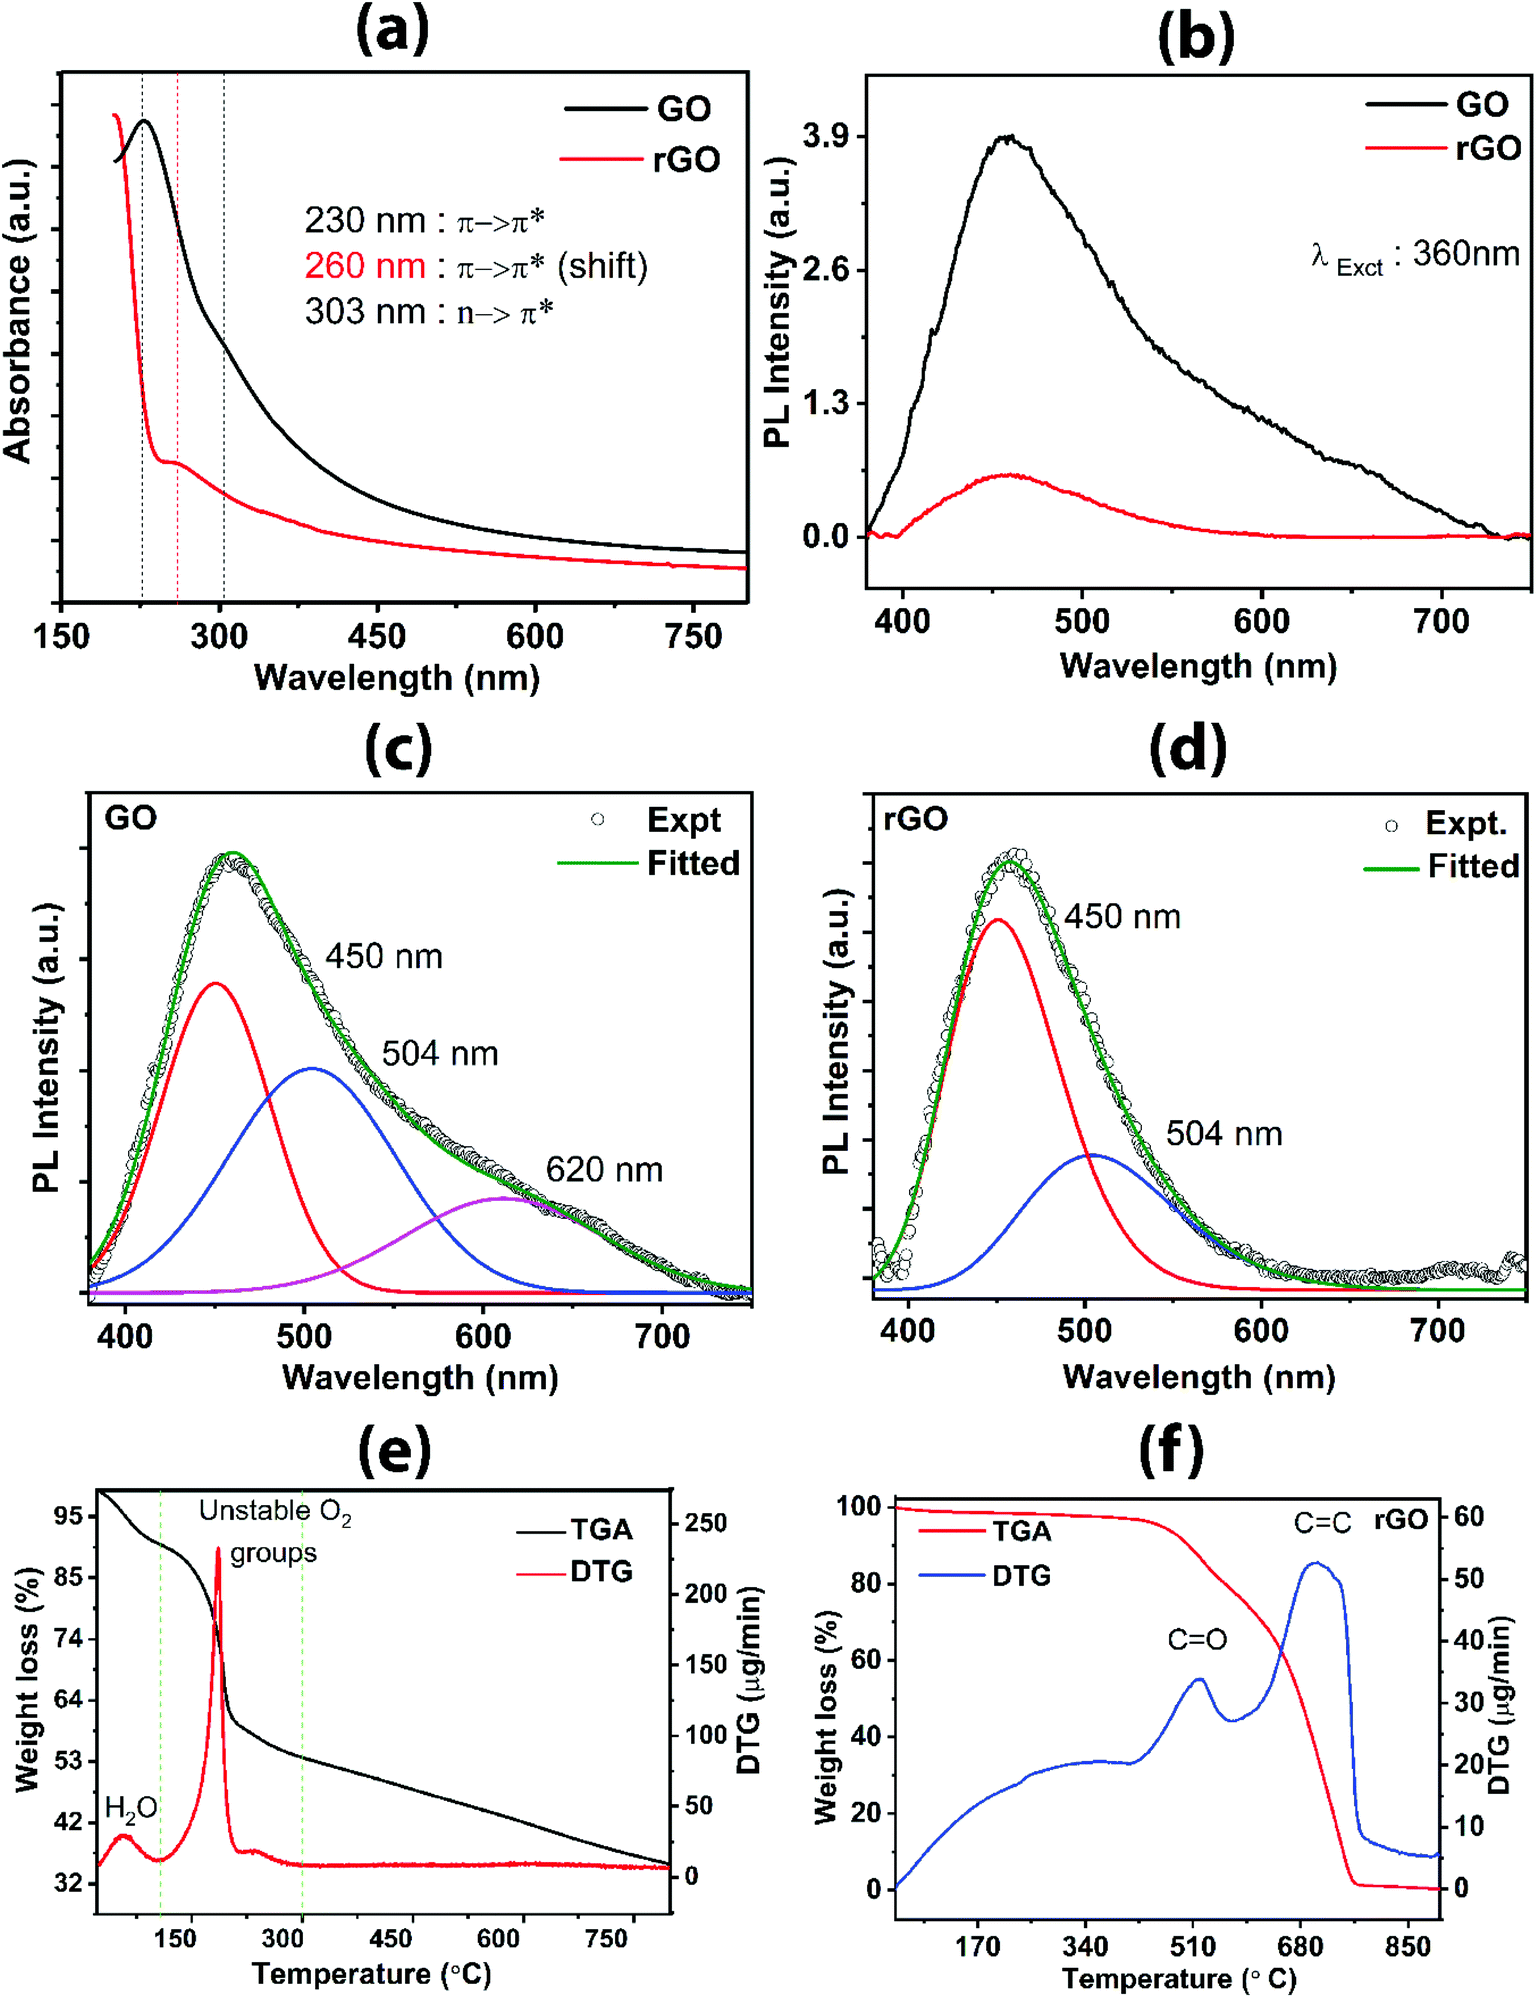 | ||
| Fig. 5 (a) UV-vis absorption spectra of GO and rGO showing bands attributed to π → π* and n → π* transitions. Photoluminescence emission behavior showing degree of defect states for (b) GO and rGO, (c) fitted plot for GO and (d) fitted plot for rGO. TGA/DTG analysis for (e) GO and (f) rGO. | ||
The PL spectra of GO and rGO are shown in Fig. 5b–d. A significant difference in the evolution of the spectra is observed between the two samples, GO and rGO (Fig. 5b). GO has a broad peak, and the fitted spectra consist of three peaks centered at 620 nm, 504 nm, and 450 nm (Fig. 5c), arising from the disorder-induced defect states due to the sp3 character of carbon with oxygen-containing functional groups attached to graphene carbons. The presence of oxygen can increase the number of (C–OH) and (C–O–C) bonds as a result of the rearrangement of oxygen and oxygen-containing functional groups with carbons, which consequently enhance the transfer of resonance energy from O sites to the sp2 clusters in the graphene lattice, contributing to a broad PL emission.42 In general, the significant number of defect states present in the GO sample within the π → π* results in the broad PL spectrum. It should be noted that these defect states are distributed broadly at lower energy as well as at the higher energy within the bandgap between π (analogous to valence band) and π* (analogous to conduction band). Theoretically, the transition within π → π* is caused by pz states oriented perpendicular to the planar graphene. On reduction, oxidized sp3 carbon responsible for the distortion is transformed to sp2 carbon clusters, thereby decreasing the number of defect states in rGO, which results in the decrease in intensity (Fig. 5b) as well as the absence of PL peak at 620 nm (Fig. 5d), as compared to GO spectrum. The increased number of cluster-like states from the newly formed sp2 domain have higher energy than the defect states, which correspond to the emission peak at a shorter wavelength, i.e., higher energy 450 nm. This phenomenon is consistent with the mechanism explained by Chuang et al.42 and Chien et al.43 A significant drop of the intensity of 450 nm peak confirms the reduction of a number of defect states in rGO attributed to more sp2 character in the carbon skeleton. The drastic reduction in the PL intensity from GO to rGO confirms that the present reduction process is stronger than other photoreduction techniques.
TGA/DTG profiles of GO and rGO further provide evidence for the presence of functional groups and their thermal response in terms of change in weight, as shown in Fig. 5e and f. The TGA/DTG data were acquired with a heating rate of 5 °C min−1 in the presence of nitrogen gas. For the GO sample (Fig. 5e), three stages can be assigned in the thermogram; the first stage corresponds to evaporation of water (below 100 °C) adsorbed onto the GO or intercalated between GO layers; secondly, the loss of more labile carbon oxide-based gas (100–220 °C) and thirdly, the removal of relatively more inert carbon oxide-based gas (220–290 °C). DTG peaks show pronounced bands centered at 60 °C, 191 °C, and 242 °C. The DTG peaks at 60 °C, 91 °C, and 242 °C correlate to the first, second, and third stages, respectively, due to the loss of moisture and decomposition of unstable oxygen-containing functional groups (hydroxyl and epoxy groups). In the first stage/zone, a weight loss of 9% of the initial weight in the form of water is observed. In the second zone, 32 wt% is lost, which is attributed to the escape of CO2 and CO gases and subsequently, 5 wt% is lost in the third zone due to the release of CO2 and CO. These results are consistent with the reported works17,28,38 which describe the three zones for weight reduction owing to loss of water, loosely bound oxygen, and relatively inert oxygen. Tang et al.17 explained that the weight loss in the second stage was originated from the decomposition of the oxygen-containing group, resulting in a mixture of CO2 and CO where CO2 dominates. However, in the third stage, CO dominates during the weight reduction process, originated from CO2 and CO. In rGO (Fig. 5f), the weight loss is gradual up to 410 °C and only 4 wt% is lost over this wide temperature window. The broad DTG band at 100–400 °C represents the negligible loss of adsorbed water, in-plane oxygen functional groups, and COOH related functional groups. Interestingly, as compared to the GO, DTG for rGO peaks at 522 °C and 706 °C are due to the removal of more stable carbonyl groups and breaking of sp2 carbon bonds, respectively. A similar observation was reported by Sundramoorthy et al.,44 describing the two major weight loss features attributed, firstly, to the decomposition of the dangling oxygenated compounds and secondly, the graphene itself. The DTG profile of rGO reveals the removal of many oxygen functional groups and restoration of graphitic sp2 carbon framework and subsequently, it is broken on further heating. It appears that rGO has lower thermal stability as compared to GO as seen by the rapid decrease in weight at elevated temperature. E. M. Deemer et al.,38 reported that the weight losses above 625 °C are due to the rapid combustion of the carbon skeleton. Hence, the removal of the labile oxygen-containing group is confirmed in both GO and rGO.
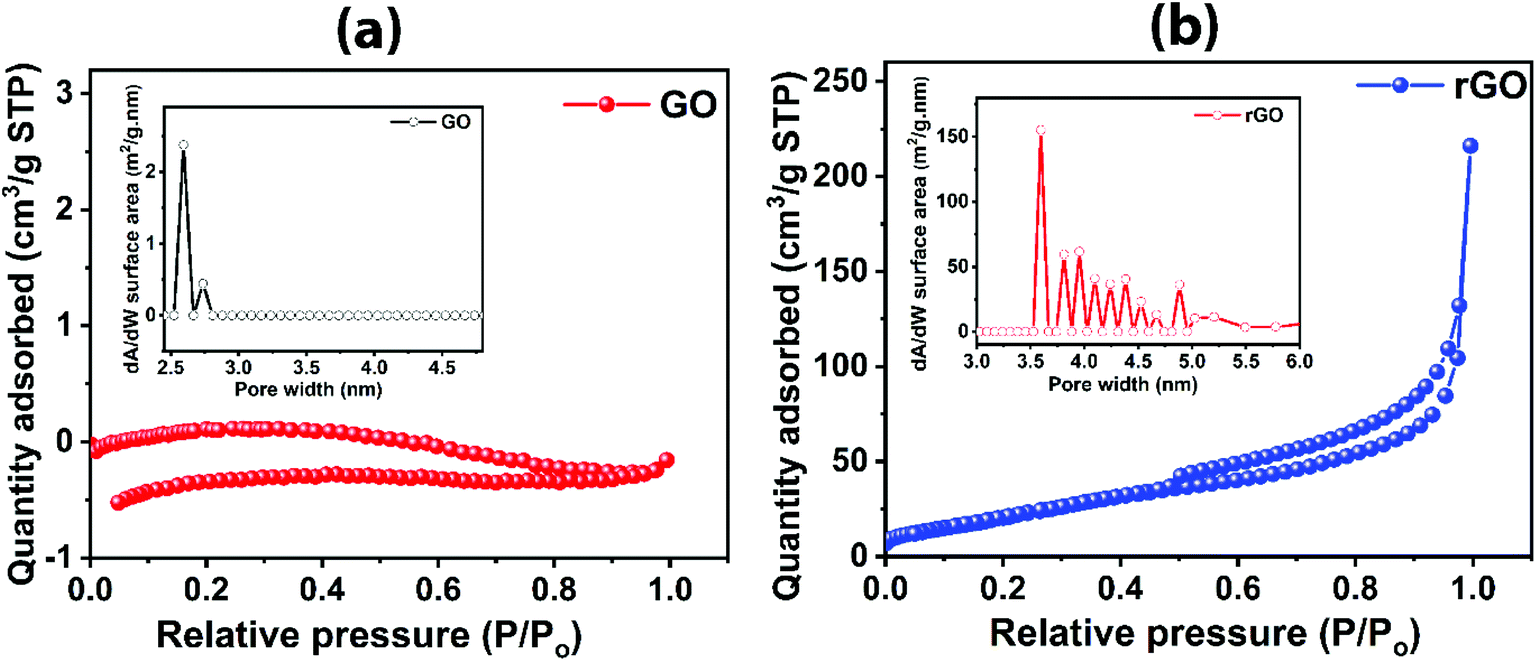
In order to understand the surface area of the graphene-based materials rendering active sites for gas interaction with large-area GO and rGO, BET analysis was conducted, as shown in Fig. 6, depicting the adsorption/desorption isotherm in N2 environment. rGO sheets exhibits the typical Type IV characteristics with slight hysteresis (Fig. 6b), indicating its mesoporous nature with more active sites available for gas to interact, while the GO shows a comparatively flat curve (Fig. 6a). The calculated surface areas for GO and rGO are 0.0993 m2 g−1 and 87.256 m2 g−1, respectively. Thus, the specific surface area of rGO is much higher than the GO. Pore size distributions for GO and rGO are shown as insets Fig. 6a and b, respectively. The majority of pore width for GO and rGO are 2.6 nm and 3.5 nm, respectively. However, the rGO contains additional pores of higher sizes. Micropore volumes analysed from BET for GO and rGO are 0.000254 cm3 g−1 and 0.024595 cm3 g−1, respectively. The presence of more interaction sites is evidenced by the larger surface area of rGO compared to GO. The low surface area of GO shows highly interrupted flow of electron; thus, GO is electrically less conductive material45 as compared to rGO which is further discussed in Section 3.4.
 | ||
| Fig. 6 Adsorption/desorption isotherms in N2 environment and pore size distribution (inset) for (a) GO and (b) rGO. | ||
3.3. Layer analysis of GO: correlation of FETEM, AFM and Raman spectral analyses
The thickness of the GO sheet determined from the FETEM and AFM imaging are shown in Fig. 7. The number of layers in each sheet can be obtained from the thickness as mentioned earlier. Correlation between the number of layers and Raman spectra was analyzed. The Raman spectra were measured on the known thickness of GO sheets using the same sample. The mono-layer and bi-layers of the exfoliated large-area GO are shown in FETEM images (Fig. 7a and b, respectively). The thickness of the mono-layer and bi-layers of GO are calculated using the ImageJ analyzer (∼1.6 nm and ∼4.2 nm, respectively). Further, the thickness of the mono-layer and bi-layer GO are obtained from the AFM imaging and height profile measurement as shown in Fig. 1g and 7c (∼1.6 nm and ∼2.9 nm, respectively). The thickness of the mono-layer is consistent in both the FETEM and AFM analyses. However, bi-layer does not show exact values in FETEM which could be due to the instrumental error. The different thicknesses corresponding to layers of GO sheets as obtained from AFM, such as mono-layer (∼1.6 nm, Fig. 1g), bi-layers (∼2.9 nm, Fig. 7c), <5 layers (∼7.2 nm, Fig. 7d), <10 layers (∼14 nm, Fig. 7e), >10 layers (∼20 nm), and graphite oxide (bulk) are analyzed in correlation with Raman spectra using intensities of SiO2 peak (∼950 cm−1), D peak (∼1333 cm−1), and G peak (∼1603 cm−1) and the corresponding ratio of ID/IG, red shift of G peak and blue shift of D peak, as shown in Fig. 7f–i. The cumulative Raman spectra for the different layers of GO sheets are plotted in Fig. 7f in the range 850 cm−1 to 1750 cm−1, and the changes in Raman spectra based on no of layers are shown. In agreement with the reported analyses on the graphene layers,46–49 when the number of GO layer increases, the ID/IG ratio decreases linearly from 0.97 to 0.73 (Fig. 7g) in which G peak has redshift from 1602 cm−1 to 1586 cm−1, whereas the D peak has a blue shift from 1333 cm−1 to 1345 cm−1 (Fig. 7h). The intensities of the D and G peaks increase from mono-layer up to <5 layers and then decrease afterward, whereas the intensity of the SiO2 peak ∼950 cm−1 gradually decreases (Fig. 7i) as the thickness of the GO layer increases.50,51 From the analysis, it can be concluded that the mild heating-based exfoliation of GO has exfoliated various thicknesses of large-area GO sheets.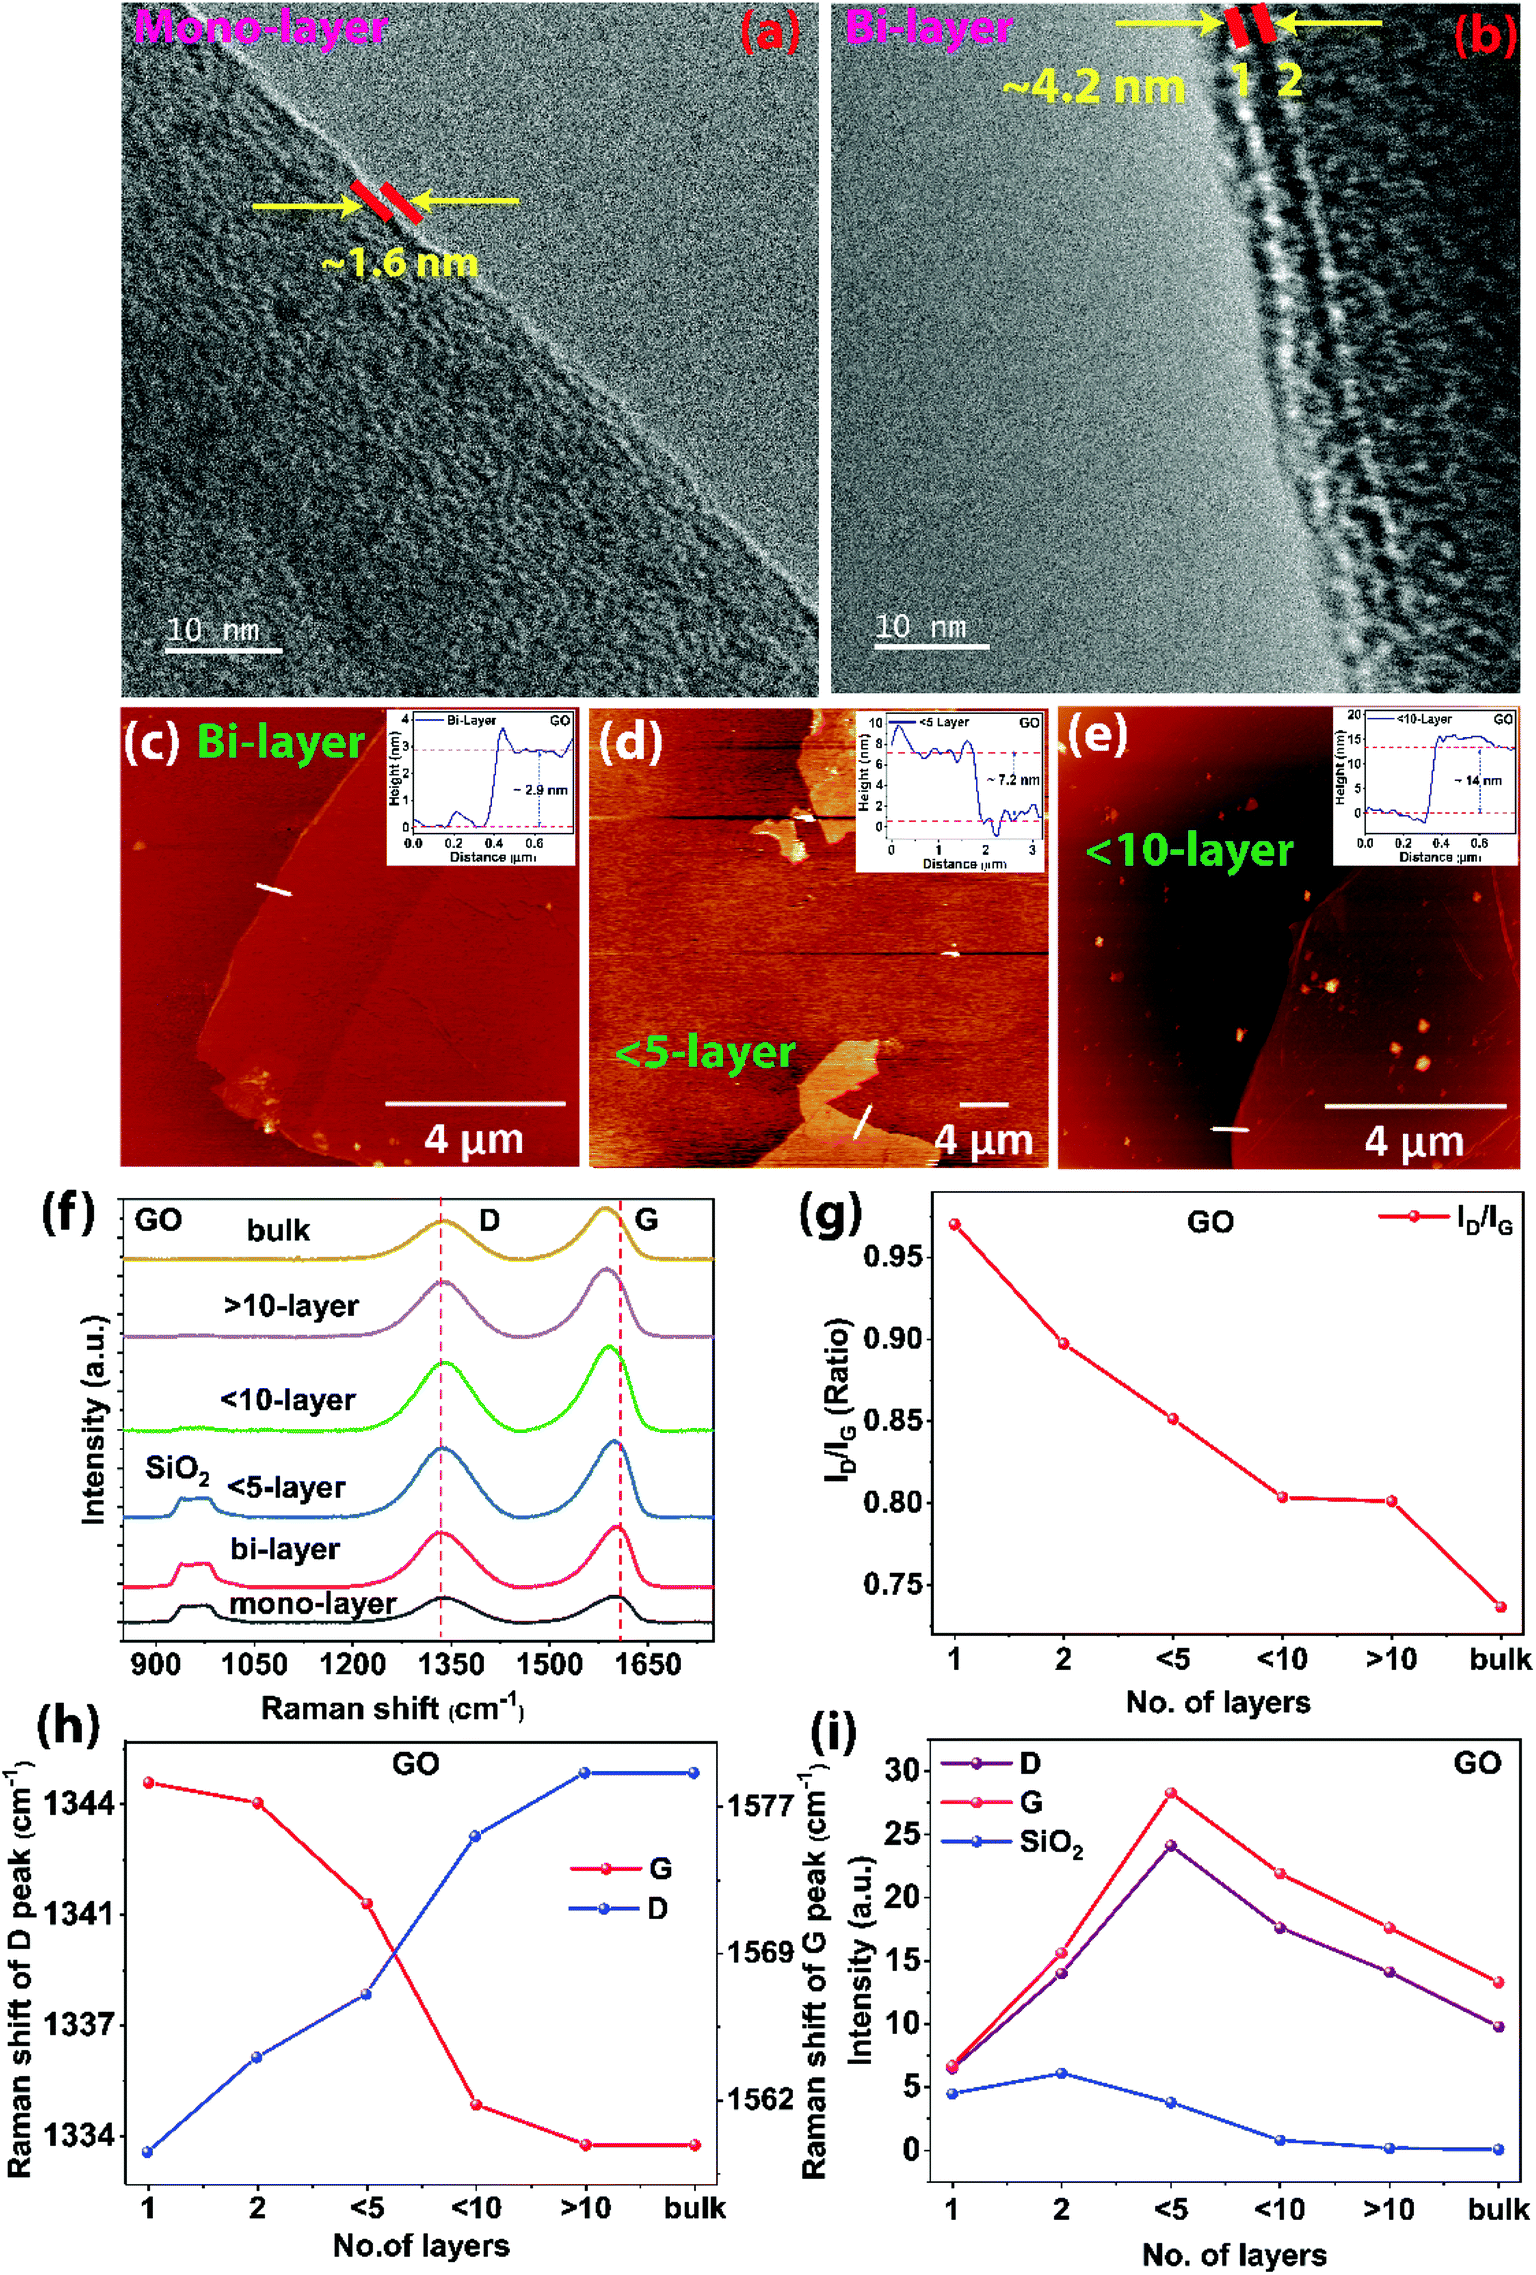 | ||
| Fig. 7 FETEM images of (a) mono-layer and (b) bi-layer GO sheets. AFM images and the height profiles (inset) of (c) bi-layer, (d) <5 layers and (e) <10 layers of GO sheet; Raman analysis of GO with respect to its number of layers (f) cumulative of Raman spectra; (g) ID/IG ratio; (h) shift of D and G peak with the number of layers; and (i) intensity of D, G and SiO2 peaks as a function of the number of layers. | ||
3.4. Electronic and electrochemical behaviors of large-area GO and rGO
I–V characteristics for large-area GO and rGO are shown in Fig. 8a and b. The I–V characteristic of the GO and rGO sheets are measured by using the interdigital electrode (IDE) pattern on the sheets. The IDE patterning on the GO and rGO sheets is fabricated using the lithography technique shown as a schematic diagram in Fig. 8a (inset). The channel width of the IDE pattern is 1 μm, which is shown in Fig. 8b (inset). Non-linear ohmic characteristic is exhibited for GO, which is due to the non-ohmic contact formation. This is primarily attributed to the reduction of electron flow rate owing to the presence of functional groups. The sp3 character bonds and defects arising from the oxidation disrupt the transport of charge carriers through graphene sp2 networks and/or discontinuities between the sp2 domains, reducing electron mobility and electrical conductivity.42 The electron transport is more of hopping type than ballistic transport. For rGO, the current flow rate is significantly improved from μA to milliampere, which is three orders of magnitude higher, arising from the good ohmic contact formation of rGO as confirmed from the linear I–V curve. The recovery of the sp2 graphitic plane with increasing in the delocalization of electron in CC, thereby augmenting the electron flow rate by removing the functional groups during the reduction process is evidenced from the I–V curve. The I–V characteristic of rGO is comparable to that of pristine graphene and other reported literature.22
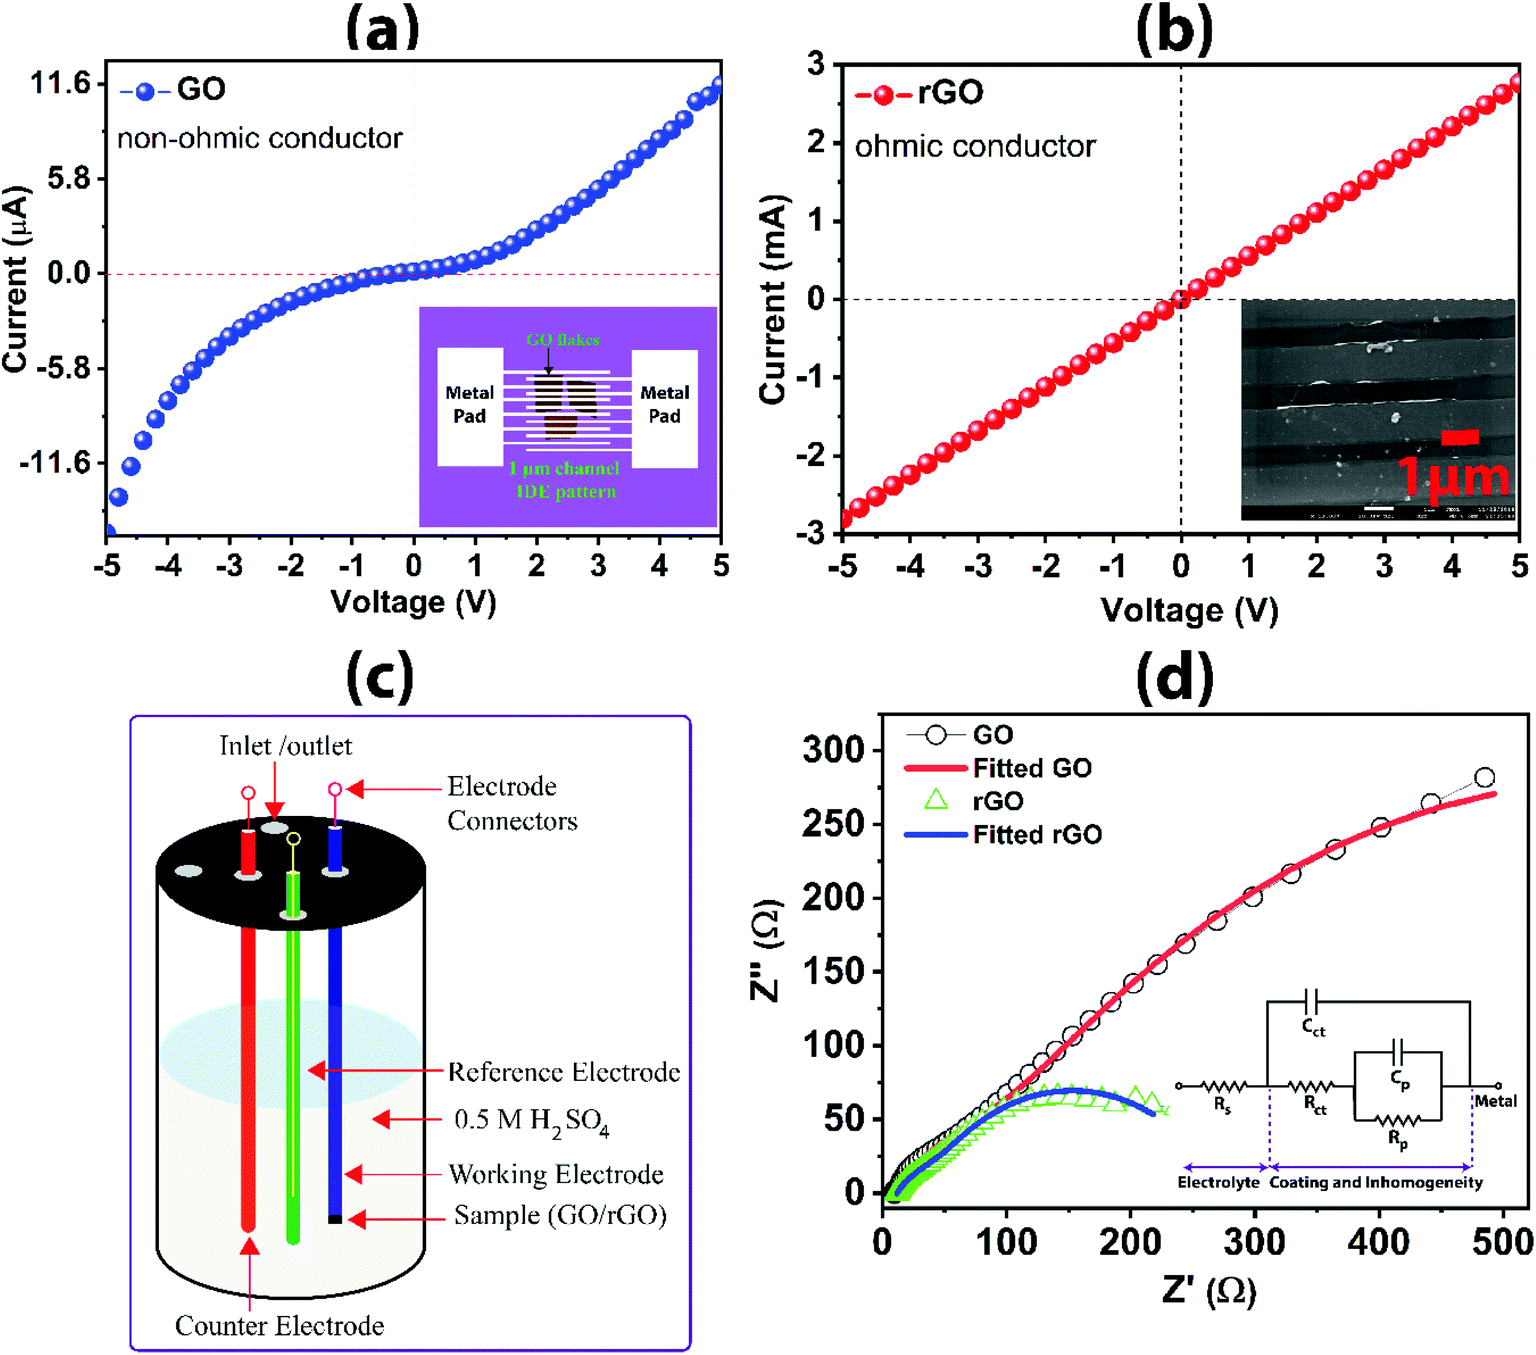 | ||
| Fig. 8 (a) I–V characteristics for GO showing the schematic device contact (inset); (b) I–V characteristics for rGO showing device contact (inset); (c) schematic diagram of a three-electrode system for acquiring electrochemical impedance data; (d) Nyquist plot from electrochemical impedance spectroscopy presenting the comparison of impedance dimensions (the parameters from the fitted equivalent circuit (inset) is shown in Table 2). | ||
The schematic diagram for the three-electrode system used to acquire the electrochemical impedance data is shown in Fig. 8c. The electrochemical impedance spectra for GO and rGO are shown in Fig. 8d. The large dimension of the impedance curve in the Nyquist plot for GO as compared to rGO reveals the large resistance to charge transfer at the interface of the graphene-based electrode and electrolyte (impeding the flow of electron). The smaller impedance arc for rGO indicates higher conductivity in rGO than the GO. The charge transfer resistance (Rct) for rGO is 193.2 Ω, which is five times lower than the GO (958.3 Ω), suggesting the high conductivity of rGO across the interface, subsequently, transferring the charge along the carbon framework and through the base substrate of the working electrode. The EIS results are tabulated in Table 2 as obtained from the fitting using the equivalent circuit (inset in Fig. 8d). Solution resistance (Rs) is nearly consistent when immersed with rGO and GO samples as working electrodes. However, pore resistance (Rp) of rGO (69.19 Ω) and GO (148.7 Ω) are slightly different, which could be attributed to the inherent surface inhomogeneity and unavoidable variation in the localized nano/micropores created during the process for drying of the drop-casted electrode. ‘Cct’ and ‘Cp’ represent the respective capacitance for Rct and Rp. Overall, rGO prepared in this investigation has demonstrated excellent electronic and electrochemical properties as depicted from the results of I–V characteristics and electrochemical impedance responses.
| Samples | Rs (Ω) | Cp (μF) | Rp (Ω) | Cct (μF) | Rct (Ω) |
|---|---|---|---|---|---|
| GO | 9.71 | 0.51 | 148.7 | 1.4 | 958.3 |
| rGO | 11.86 | 1.06 | 69.19 | 1.56 | 193.2 |
3.5. SERS-based sensing applications of large-area GO and rGO
Surface-enhanced Raman scattering (SERS) is a highly-sensitive and promising Raman spectroscopy technique, enabling significant enhancement of Raman signals of adsorbed analyte molecules on an engineered surface.52 Usually, metallic nanoparticles, such as Au, Ag coated glass/SiO2 substrates are used as SERS substrate to enhance the Raman signal of analytes, which have very weak Raman signal. More recently, semiconductors have also been used as SERS substrates, where the enhancement factor is much lower than that of metallic SERS substrates. Rhodamine B (RhB) molecules are highly fluorescent in nature and have a very weak Raman signal. The intensity of the Raman signal for RhB molecule can be enhanced on the GO and rGO by using SERS technique. The efficacy of UGO, GO, and rGO in sensing the low concentration of RhB is studied using the SERS technique, as represented by Fig. 9 and S9 (ESI†). RhB at a concentration of 10−4 M has no Raman signal when placed on SiO2/Si substrate. However, with GO and rGO as substrates, the enhancement of Raman intensity is observed, indicating the detection of RhB on the substrates. The prominent peak at 1647 cm−1 is taken as the detection signal for the UGO, GO, and rGO materials. With the initial concentration of 10−4 M of RhB, the sharp peak at 1647 cm−1 is observed for all the substrates of UGO, GO, and rGO. The peaks with indexing values of relevant Raman shifts of the GO substrate is shown in Fig. 9c. On diluting the RhB to 10−5 M there is a decrease in the peak intensity as indicated in Fig. 9d, showing the change in the intensity of the peak at 1647 cm−1 as a function of the concentration of RhB for all the three substrates. On further diluting to 10−6 M, there is still detection of RhB with lower intensity of the peak. Furthermore, significant detection is observed down to the concentration of 10−7 M for GO and UGO. Interestingly, the detection is observed down to a concentration of 10−8 M RhB for rGO substrate. However, the peak at 1647 cm−1 disappears on subsequent dilution to 10−8 M for both GO and UGO substrates. Thus, the GO, and UGO have better Raman signal for the lower concentrations of RhB down to 10−7 M. It is clear that the mild heating-based exfoliated GO sheets exhibit the high enhancement of the Raman signal as compared to the ultrasonic-based UGO. It is observed that there is a sudden enhancement of Raman signal for the 10−7 M of the RhB molecules on UGO substrate. The detection of RhB on GO and rGO substrates even at lower concentrations indicated by the amplification of the Raman signal is contributed by the π–π stacking as well as from the local electric field generated by sp2 carbon domains. The enhancement of the Raman signal is also explained when LUMO levels of the RhB are aligned or closer to the Fermi Energy level of the graphene-based substrates.53 Recently, Das et al. demonstrated high SERS sensitivity of nitrogen doped graphene quantum dots.54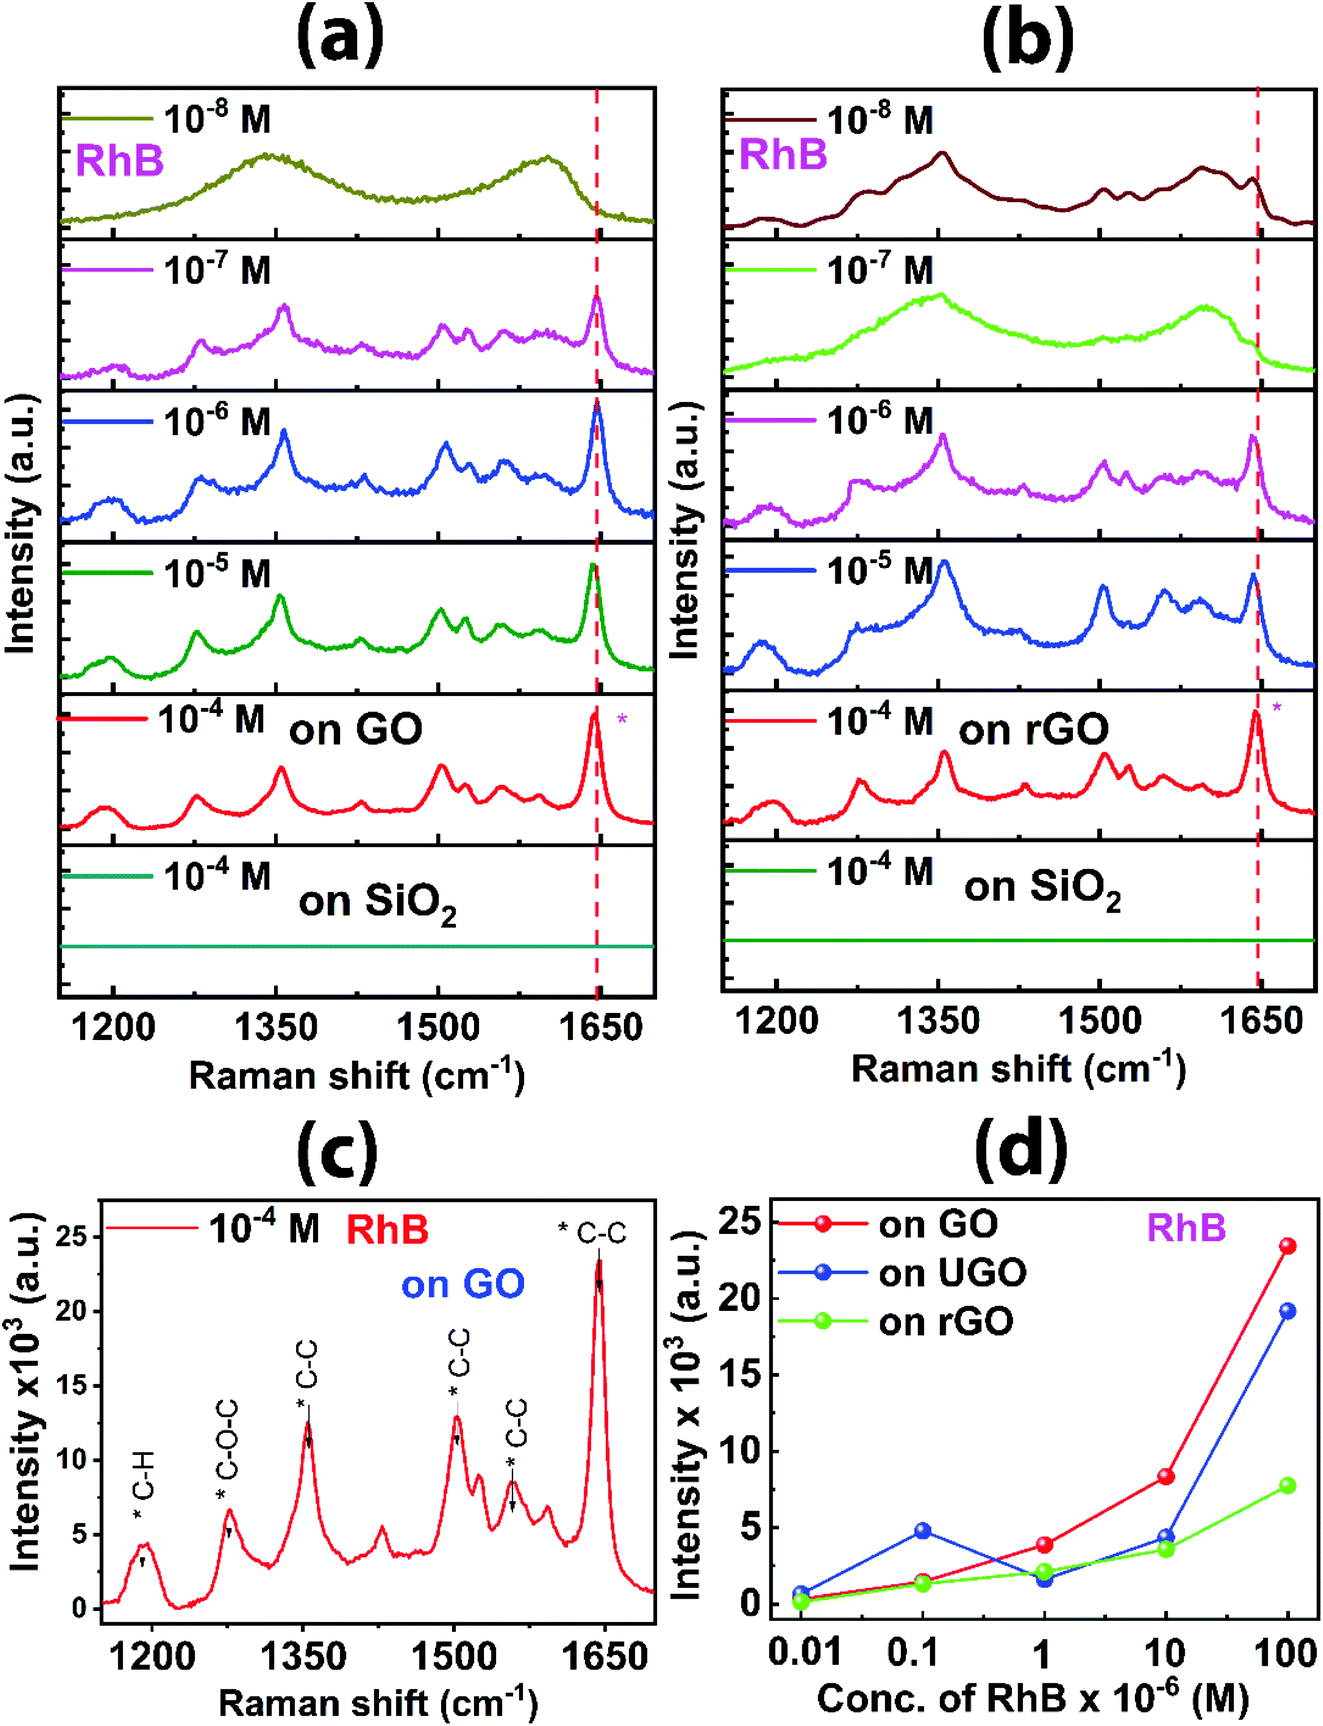 | ||
| Fig. 9 Raman spectra of different concentrations of RhB on (a) GO and (b) rGO substrate; (c) Raman spectrum analysis of 10−4 M concentration of RhB on GO substrate; (d) Raman intensity for RhB (1647 cm−1) peak for UGO, GO, and rGO substrates at different concentrations. | ||
The mechanism of the SERS is contributed mainly by two components; electromagnetic enhancement and chemical enhancement.54 The electromagnetic enhancement arises from the localized electromagnetic field of metallic nature. The chemical enhancement factor is due to the charge transfer phenomenon. In the present case, the electromagnetic enhancement is negligible due to the semiconducting nature of GO and rGO, and the primary reason for the enhancement is the charge transfer between the GO or rGO and the RhB molecules. The π–π stacking between GO or rGO and RhB molecules could assist better interaction between them, which increases the charge transfer from the substrate to the adsorbed molecules. In the SERS measurement on the GO substrate, the enhancement of the signal is obtained in all the peaks including G-band and D-band. However, the G-band and D-band are subtracted to illustrate the Raman pattern for RhB. GO which has several defects due to the presence of functional groups has higher enhancement in Raman peak as the interaction sites increase to combine with more RhB molecules as compared to rGO.
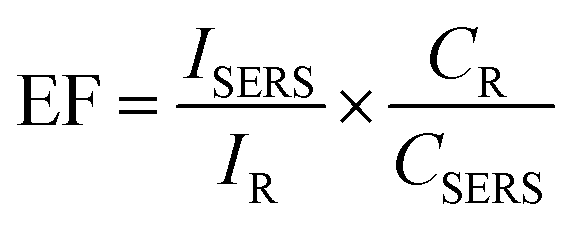
The enhancement factor (EF) for SERS is a useful parameter for studying the effect of substrates for SERS of a material. It is commonly defined as the ratio of the SERS signal intensity to the intensity of Raman signal under identical conditions (e.g. laser power, data accumulation time, concentration of the analyte) on different substrates.55 Most acceptable mathematical formula for the calculation of EF is given below, with varying concentrations of the analyte studied on different substrates
To simplify the calculation of the EF, the same volume of solution and experimental parameters are maintained, such as laser excitation wavelength (532 nm) and laser power (5 mW), accumulation time (10 seconds). The concentration of RhB for SERS measurement is 10−4 M and the higher concentration of RhB up to which Raman signal is detected on SiO2 base substrate is 10−2 M, which is shown in Fig. S9b.† The volume of the solution used to drop-cast on both substrate samples is 5 μL.
So, the value of the EF for rGO at 10−4 M concentration of RhB is given by,
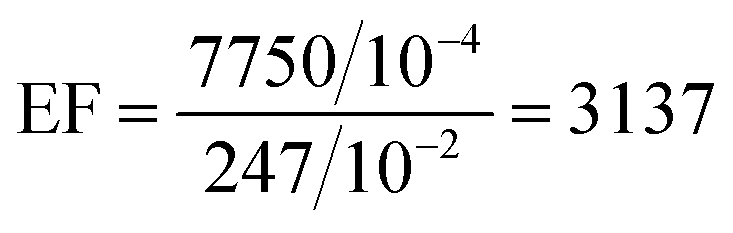
So, the EF value of the rGO substrate for RhB is 3.137 ×10³ at 1647 cm−1 for 10−4 M concentration of RhB using laser excitation of 532 nm. The EF values of the GO and UGO substrates are calculated to be 9.482 ×10³ and 7.759 ×10³, respectively, for 10−4 M concentration of RhB at 1647 cm−1 using the same laser excitation. Thus, the EF value for GO is about three times higher than that of rGO, and it is about 1.22 times higher than UGO. Thus, the GO has better enhanced the Raman signal of the RhB molecules as compared to that of rGO. This enhancement of the Raman signal may be due to the interaction between the RhB molecules and functional groups present on the GO sheets. EF values for various substrates at different Raman peaks are shown in Table S2 (ESI†). Interestingly, the EF value calculated here is the highest among the reported values for GO. Usually, the reported EF corresponding to the chemical enhancement is only ∼103, which is about one order of magnitude lower than the value observed here for GO. Thus, the large-area GO and rGO flakes developed in this work by the simplified technique can be applied as substrates in sensing low concentration molecules using SERS/graphene-enhanced Raman spectroscopy (GERS) technique.
3.6. Application of large-area rGO in CO2 gas sensing
CO2 gas sensing characteristics of rGO incorporated SnO2 composite material is shown in Fig. 10. During the exposure to calibrated CO2 gas (ON stage), the resistance corresponding to the response from the rGO–SnO2 composite is higher than the pure SnO2 for 5000 ppm of the gas. The change of resistance for pure SnO2 material at 5000 ppm of CO2 is 217 Ω, whereas the change of resistance for the rGO–SnO2 composite is 325 Ω. Thus, the rGO–SnO2 composite has a sensitivity 50% higher than that of only SnO2 based sensor, which is very significant for practical application. The change in the resistance can be explained by the oxygen adsorption theory, which is the most commonly accepted mechanism for gas sensing. The electrons from the conduction band of the composite material are transferred to the exposed CO2 gas molecules. This leads to the depletion of the charge carrier in the conduction band of the composite material, thus, increasing in the resistance of the sensing devices during the CO2 exposer. The transferred electron is released back to the conduction band after evacuation of the CO2 gas from the chamber. Haocheng Ji et al. reported more details in the similar gas sensing mechanism of metal oxide.56 During the ON and OFF stages, the response and recovery times for both the materials are not much different. The CO2 gas is measured in different concentrations at 5000 ppm, 1000 ppm, 500 ppm, and 250 ppm and the sensitivities of the composite are 9%, 4%, 2%, and 1%, respectively, as shown in Fig. 10a. The response time (τr) is 20 s and the recovery/decay time (τd) is 40 s (Fig. 10c). In all the concentrations, the recovery time is about twice the response time (Fig. 10d). Overall, rGO has a significant contribution to improved CO2 gas sensing when incorporated with SnO2 as compared to pure SnO2 sensor used commercially. Thus, the large-area rGO developed here by the simplified technique is promising for CO2 gas sensing applications.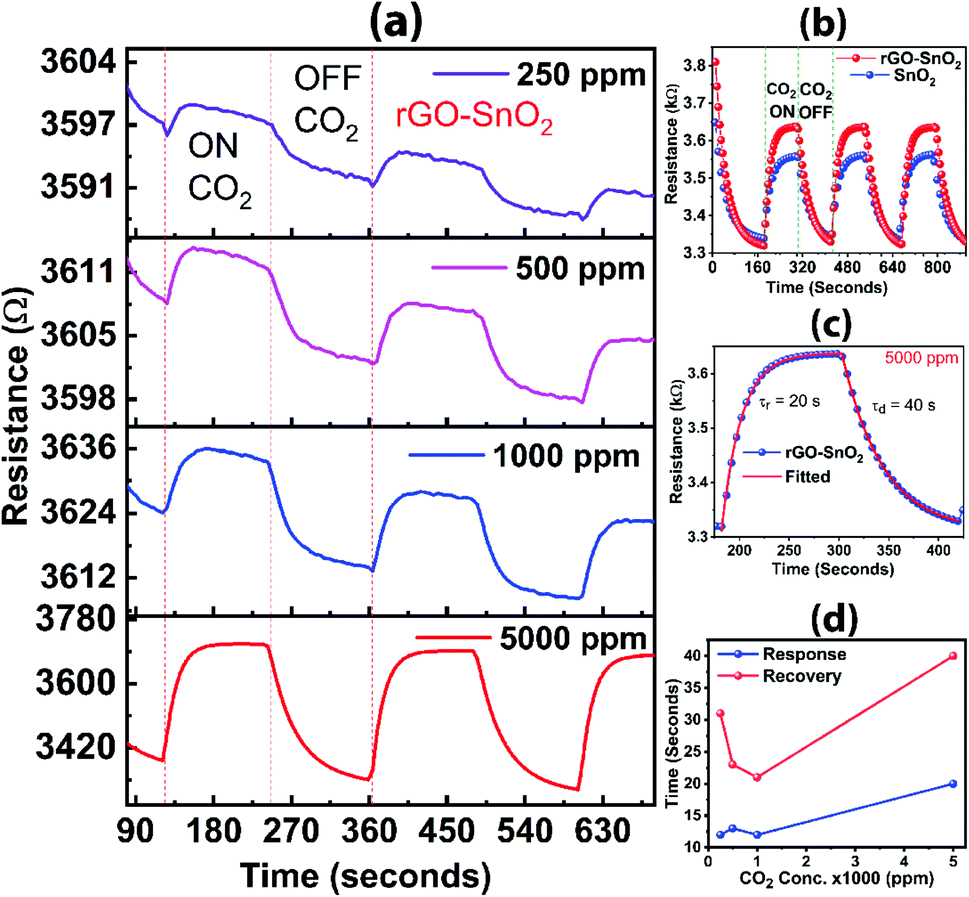 | ||
| Fig. 10 (a) CO2 gas sensitivity in different gas concentrations for rGO–SnO2 composite; (b) CO2 gas sensing response for rGO–SnO2 composite and pure SnO2 materials; (c) time response and recovery for rGO–SnO2 composite material for 5000 ppm of CO2 gas; (d) different concentrations of the CO2 gas in rGO–SnO2 composite sensor device for response time and recovery time. | ||
4. Conclusion
In summary, we have demonstrated a cost-effective and facile approach using mild heating to exfoliate graphene oxide (GO) sheets with ultra-large lateral size up to 104 μm, the largest size reported till date, using a simplified technique with varied layers (mono-layer, bi-layer and few layers), superior to commonly used ultrasonic technique. Subsequently, the reduction was carried out to obtain less defective graphene sheets (rGO) as indicated by ID/IG ratio from Raman studies. Correlation between the number of GO layers and ID/IG ratio was obtained from Raman spectra in which ID/IG ratio increases systematically from 0.73 to 0.97 with the decrease in number of layers (>10, <10, <5, bi-layer and mono-layer). Results from FTIR, XPS, UV-vis, PL, and TGA/DTG confirmed the removal of oxygen-containing functional groups in rGO, suggesting the minimization of defect-induced disorder in graphene carbon framework, which results in restoration of sp2 hybridized honeycomb skeleton. In rGO, the current flow was significantly improved from micro ampere to milli ampere, which is three orders of magnitude change, arising from the good ohmic contact formation on rGO as confirmed from the linear I–V curves, indicating the high quality of the graphene-based sheets. The electrochemical impedance results corroborate with the I–V characteristics, exhibiting much lower charge transfer resistance (Rct = 193.2 Ω) for rGO than that of GO (Rct = 958.3 Ω), which depicts the higher conductivity across the liquid/solid interface for the former as compared to the latter electrode materials. The large-area GO and rGO sheets have been utilized for SERS application for the detection of Rhodamine B (RhB) down to a concentration of 10 nM and a large SERS enhancement factor of 104 is reported here, for the first time. Furthermore, CO2 gas sensing application was explored using the large-area rGO incorporated as a rGO–SnO2 composite resulting in 50% improvement as compared to pure SnO2 based sensor and the results are supported by the BET analysis. Thus, the present simplified and economical approach of large-area graphene oxide could potentially open up a new strategy for industrial-scale production for cutting edge sensing applications.Author contributions
Ningthoujam Somorjit Singh (conceptualization, investigation, methodology, writing – original draft); Franco Mayanglambam (formal analysis, investigation, writing – review & editing); Harshal B. Nemade (conceptualization, funding acquisition, supervision, writing – review & editing); P. K. Giri (conceptualization, funding acquisition, supervision, writing – review & editing).Conflicts of interest
The authors declare no conflict of interest.Acknowledgements
The authors acknowledge the MEITY Project (Grant No. 5(9)/2012-NANO (VOL-II)) for the funding in carrying out the research. The technical supports from Central Instrument Facility, Indian Institute of Technology Guwahati, and XPS measurements by Dr H. Sugimoto and Prof. M. Fujii, Kobe University, are gratefully acknowledged.References
- K. S. Novoselov, A. K. Geim, S. V. Morozov, D. Jiang, Y. Zhang, S. V. Dubonos, I. V. Grigorieva and A. A. Firsov, Science, 2004, 5, 1–12 Search PubMed.
- K. Parvez, Z. S. Wu, R. Li, X. Liu, R. Graf, X. Feng and K. Müllen, J. Am. Chem. Soc., 2014, 136, 6083–6091 CrossRef CAS PubMed.
- K. Parvez, R. Worsley, A. Alieva, A. Felten and C. Casiraghi, Carbon, 2019, 149, 213–221 CrossRef CAS.
- L. Tang, X. Li, R. Ji, K. S. Teng, G. Tai, J. Ye, C. Wei and S. P. Lau, J. Mater. Chem., 2012, 22, 5676–5683 RSC.
- T. T. Tung, J. Yoo, F. K. Alotaibi, M. J. Nine, R. Karunagaran, M. Krebsz, G. T. Nguyen, D. N. H. Tran, J. F. Feller and D. Losic, ACS Appl. Mater. Interfaces, 2016, 8, 16521–16532 CrossRef CAS PubMed.
- J. W. Suk, R. D. Piner, J. An and R. S. Ruoff, ACS Nano, 2010, 4, 6557–6564 CrossRef CAS PubMed.
- T. Cheng-An, Z. Hao, W. Fang, Z. Hui, Z. Xiaorong and W. Jianfang, Polym. Polym. Compos., 2017, 25, 11–16 Search PubMed.
- J. Kim, J. Kim, S. Song, S. Zhang, J. Cha, K. Kim, H. Yoon, Y. Jung, K. W. Paik and S. Jeon, Carbon, 2017, 113, 379–386 CrossRef CAS.
- B. M. Yoo, H. J. Shin, H. W. Yoon and H. B. Park, J. Appl. Polym. Sci., 2014, 131, 1–23 CrossRef.
- A. T. Smith, A. M. LaChance, S. Zeng, B. Liu and L. Sun, Nano Mater. Sci., 2019, 1, 31–47 CrossRef.
- F. Ghauri, M. Raza, M. Baig and S. Ibrahim, Mater. Res. Express, 2017, 4(12), 125601 CrossRef.
- K. Hu, T. Ohto, L. Chen, J. Han, M. Wakisaka, Y. Nagata, J. I. Fujita and Y. Ito, ACS Energy Lett., 2018, 3, 1539–1544 CrossRef CAS.
- J. Il Choi, A. Abdelhafiz, P. Buntin, A. Vitale, A. W. Robertson, J. Warner, S. S. Jang and F. M. Alamgir, Adv. Funct. Mater., 2019, 1902274, 1902274 CrossRef.
- L. Dong, J. Yang, M. Chhowalla and K. P. Loh, Chem. Soc. Rev., 2017, 46, 7306–7316 RSC.
- C. Y. Su, A. Y. Lu, Y. Xu, F. R. Chen, A. N. Khlobystov and L. J. Li, ACS Nano, 2011, 5, 2332–2339 CrossRef CAS PubMed.
- C. M. Gee, C. C. Tseng, F. Y. Wu, H. P. Chang, L. J. Li, Y. P. Hsieh, C. Te Lin and J. C. Chen, Displays, 2013, 34, 315–319 CrossRef CAS.
- H. Tang, P. He, T. Huang, Z. Cao, P. Zhang, G. Wang, X. Wang, G. Ding and X. Xie, Carbon, 2019, 143, 559–563 CrossRef CAS.
- L. Wu, W. Li, P. Li, S. Liao, S. Qiu, M. Chen, Y. Guo, Q. Li, C. Zhu and L. Liu, Small, 2014, 10, 1421–1429 CrossRef CAS PubMed.
- S. Roscher, R. Hoffmann, M. Prescher, P. Knittel and O. Ambacher, RSC Adv., 2019, 9, 29305–29311 RSC.
- T. C. Achee, W. Sun, J. T. Hope, S. G. Quitzau, C. B. Sweeney, S. A. Shah, T. Habib and M. J. Green, Sci. Rep., 2018, 8, 1–8 CrossRef CAS PubMed.
- C. Cai, N. Sang, Z. Shen and X. Zhao, J. Exp. Nanosci., 2017, 12, 1–16 CrossRef.
- I. W. P. Chen, Y. S. Chen, N. J. Kao, C. W. Wu, Y. W. Zhang and H. T. Li, Carbon, 2015, 90, 16–24 CrossRef CAS.
- Y.-S. No, H. K. Choi, J.-S. Kim, H. Kim, Y.-J. Yu, C.-G. Choi and J. S. Choi, Sci. Rep., 2018, 8, 571 CrossRef PubMed.
- L. Niu, M. Li, X. Tao, Z. Xie, X. Zhou, A. P. A. Raju, R. J. Young and Z. Zheng, Nanoscale, 2013, 5, 7202–7208 RSC.
- R. Narayan, J. Lim, T. Jeon, D. J. Li and S. O. Kim, Carbon, 2017, 119, 555–568 CrossRef CAS.
- X. Xing, X. Zhang, K. Zhang, L. Jin and Q. Cao, Fullerenes, Nanotubes, Carbon Nanostruct., 2019, 27, 97–105 CrossRef CAS.
- X. Geng, Y. Guo, D. Li, W. Li, C. Zhu, X. Wei, M. Chen, S. Gao, S. Qiu, Y. Gong, L. Wu, M. Long, M. Sun, G. Pan and L. Liu, Sci. Rep., 2013, 3, 1–6 Search PubMed.
- Y. Zhu, M. D. Stoller, W. Cai, A. Velamakanni, R. D. Piner, D. Chen and R. S. Ruoff, ACS Nano, 2010, 4, 1227–1233 CrossRef CAS PubMed.
- Y. Hu, M. Su, X. Xie, C. Sun and J. Kou, Appl. Surf. Sci., 2019, 494, 1100–1108 CrossRef CAS.
- H. R. Kim, S. H. Lee and K. H. Lee, Carbon, 2018, 134, 431–438 CrossRef CAS.
- W. Wu, J. Xu, X. Tang, P. Xie, X. Liu, J. Xu, H. Zhou, D. Zhang and T. Fan, Chem. Mater., 2018, 30, 5932–5940 CrossRef CAS.
- W. Wu, M. Liu, Y. Gu, B. Guo, H. Ma, P. Wang, X. Wang and R. Zhang, Chem. Eng. J., 2020, 381, 122592 CrossRef CAS.
- K. Y. Chong, C. H. Chia, S. W. Chook, S. Zakaria and D. Lucas, New J. Chem., 2018, 42, 4507–4512 RSC.
- W. K. Park, Y. Yoon, Y. H. Song, S. Y. Choi, S. Kim, Y. Do, J. Lee, H. Park, D. H. Yoon and W. S. Yang, Sci. Rep., 2017, 7, 1–9 CrossRef PubMed.
- Y. Arao, Y. Mizuno, K. Araki and M. Kubouchi, Carbon, 2016, 102, 330–338 CrossRef CAS.
- Z. S. Wu, W. Ren, L. Gao, B. Liu, C. Jiang and H. M. Cheng, Carbon, 2009, 47, 493–499 CrossRef CAS.
- I. Ogino, Y. Yokoyama, S. Iwamura and S. R. Mukai, Chem. Mater., 2014, 26, 3334–3339 CrossRef CAS.
- E. M. Deemer, P. K. Paul, F. S. Manciu, C. E. Botez, D. R. Hodges, Z. Landis, T. Akter, E. Castro and R. R. Chianelli, Mater. Sci. Eng., B, 2017, 224, 150–157 CrossRef CAS.
- L. G. Cancado, A. Jorio, E. H. M. Ferreira, F. Stavale, C. A. Achete, R. B. Capaz, M. V. O. Moutinho, A. Lombardo, T. S. Kulmala and A. C. Ferrari, Nano Lett., 2011, 11, 3190–3196 CrossRef CAS PubMed.
- A. C. Ferrari, Solid State Commun., 2007, 143, 47–57 CrossRef CAS.
- A. C. Ferrari and D. M. Basko, Nat. Nanotechnol., 2013, 8, 235–246 CrossRef CAS PubMed.
- C. H. Chuang, Y. F. Wang, Y. C. Shao, Y. C. Yeh, D. Y. Wang, C. W. Chen, J. W. Chiou, S. C. Ray, W. F. Pong, L. Zhang, J. F. Zhu and J. H. Guo, Sci. Rep., 2014, 4, 1–7 Search PubMed.
- C. T. Chien, S. S. Li, W. J. Lai, Y. C. Yeh, H. A. Chen, I. S. Chen, L. C. Chen, K. H. Chen, T. Nemoto, S. Isoda, M. Chen, T. Fujita, G. Eda, H. Yamaguchi, M. Chhowalla and C. W. Chen, Angew. Chem., Int. Ed., 2012, 51, 6662–6666 CrossRef CAS PubMed.
- A. K. Sundramoorthy, Y. Wang, J. Wang, J. Che, Y. X. Thong, A. C. W. Lu and M. B. Chan-Park, Sci. Rep., 2015, 5, 1–13 Search PubMed.
- V. B. Mohan, K. Jayaraman and D. Bhattacharyya, Solid State Commun., 2020, 320, 114004 CrossRef CAS.
- H. Wang, Y. Wang, X. Cao and G. Lan, J. Raman Spectrosc., 2009, 40(12), 1791–1796 CrossRef CAS.
- D. L. Silva, L. R. P. Machado, E. M. Soares, D. R. Miquita, H. Miranda, C. Rabelo, O. P. Vilela, A. Jorio and L. Gustavo, Carbon, 2020, 161, 181–189 CrossRef CAS.
- Y. Q. Huang, Y. H. An, Z. P. Wu, D. Y. Guo, Y. S. Zhi, W. Cui, X. L. Zhao and W. H. Tang, J. Alloys Compd., 2017, 717, 8–13 CrossRef CAS.
- J. Wu, M. Lin, X. Cong, H. Liu, P. Tan and M. Lin, Chem. Soc. Rev., 2018, (5)1822–1873 Search PubMed.
- Y. Y. Wang, Z. H. Ni and Z. X. Shen, Appl. Phys. Lett., 2008, 92(4), 043121 CrossRef.
- Z. H. Ni, H. M. Wang, J. Kasim, H. M. Fan, T. Yu, Y. H. Wu, Y. P. Feng and Z. X. Shen, Nano Lett., 2007, 7(9), 2758–2763 Search PubMed.
- B. Sharma, R. R. Frontiera, A. I. Henry, E. Ringe and R. P. Van Duyne, Mater. Today, 2012, 15, 16–25 CrossRef CAS.
- S. Feng, M. Cristina dos Santos, B. R. Carvalho, R. Lv, Q. Li, K. Fujisawa, A. L. Elías, Y. Lei, N. Perea-López, M. Endo, M. Pan, M. A. Pimenta and M. Terrones, Sci. Adv., 2016, 2, 1–13 Search PubMed.
- R. Das, S. Parveen, A. Bora and P. K. Giri, Carbon, 2020, 160, 273–286 CrossRef CAS.
- E. C. Le Ru, E. Blackie, M. Meyer and P. G. Etchegoint, J. Phys. Chem. C, 2007, 111, 13794–13803 CrossRef CAS.
- H. Ji, W. Zeng and Y. Li, Nanoscale, 2019, 11, 22664–22684 RSC.
Footnote |
| † Electronic supplementary information (ESI) available. See DOI: 10.1039/d0ra10270a |
| This journal is © The Royal Society of Chemistry 2021 |