
 Open Access Article
 This Open Access Article is licensed under a Creative Commons Attribution-Non Commercial 3.0 Unported Licence
Synthesis and characterization of PEDMCD as a flame retardant and its application in epoxy resins
Yi Zhang *a and
Weiwei Yangb
*a and
Weiwei Yangb
aDepartment of Biology and Chemical Engineering, Shandong Vocational College of Science & Technology, Weifang 261053, China. E-mail: emmazhangling@163.com
bSchool of Materials Science and Engineering, Beijing Institute of Technology, Beijing 100081, China. E-mail: yangweiwei0811@163.com
First published on 12th January 2021
Abstract
In this study, a highly effective flame retardant agent, called polybicyclopentaerythritol phosphate-O-4-imino-p-phenylmethane-4-imino-2-chloro-1,3,5-s-triazine (PEDMCD), has been prepared through a direct polycondensation reaction. PEDMCD was incorporated into epoxy resin (EP) to improve the flame retardancy of EP. The molecular structure and thermal stability of PEDMCD were analyzed by nuclear magnetic resonance spectroscopy. Further, the structural properties, composition, and thermal stability of the PEDMCD/EP composite were characterized by Fourier transform infrared (FTIR) spectroscopy and thermogravimetric analysis (TGA). PEDMCD exhibited both high thermal stability and high flame-retardant performance; these properties were attributed to the phosphorus-containing structure on the side groups and a triazine structure as the molecular backbone, which played the role of a foaming carbon source. With the addition of PEDMCD, the flame-retardant behavior of PEDMCD/EP composites was gradually enhanced. Furthermore, the amount of char residue of the PEDMCD/EP composite at 500 °C was increased from 21% to 34%. The peak value of the mass loss rate of PEDMCD/EP decreased from 0.52 to 0.35 g s−1. Further, the TSP of the sample decreased from 44.2 m2 to 24.6 m2, and the total oxygen consumption decreased from 64.2 g to 30.4 g. Accordingly, owing to the incorporation of PEDMCD, EP begins to decompose sooner, and the carbon layer formed by decomposition reduces the decomposition rate of the EP matrix. Based on the results of characterization measurements and flame retardancy testing, it is confirmed that PEDMCD exhibits good flame retardancy when applied in EP.
Introduction
Owing to their excellent properties such as low shrinkage during curing, superior insulation and dielectric properties, excellent mechanical strength, and satisfactory resistance to moisture and organic solvents, epoxy resins (EPs) are widely applied in various fields such as electronic and electrical equipment, transportation, the petrochemical industry, and construction engineering.1–3 However, EP is an extremely flammable material with a low limiting oxygen index (LOI) value, which makes it a potential fire hazard.4,5 Furthermore, EP releases a large amount of heat and flammable volatile substances during combustion, which poses a potential threat to human life and environmental safety. These properties limit the practical applications of EP. Thus, it is necessary to develop additives for improving its flame retardancy. Further, it is well known that increasing the ignition time of materials and reducing the gas release rate can delay the progress of a fire. This provides additional time to people for escaping from the fire condition6–9 and an opportunity to find and remove the fire source in time, which can protect people's lives and property. This also highlights the criticality of developing a flame retardant, which can enhance the ignition time and reduce the gas release rate.Phosphorus-containing flame-retardant polymers generate a carbon layer during pyrolysis, which can absorb the heat released by the combustion center,10–13 hinder the energy and material transfer during the polymer combustion reaction, and reduce the decomposition rate of the polymer, thereby providing excellent condensed-phase flame retardant effect.14,15 Phosphorus-containing flame-retardant intermediates are synthetic polymers, which provide the structural basis for the realization of multi-element, multi-structure synergistic flame retardancy.16–20 1-Oxo-4-hydroxymethyl-2,6,7-trioxa-l-phosphabicyclo[2.2.2]octane (PEPA) and 3,9-dichloro-2,4,8,10-tetraoxa-3,9-diphosphaspiro-[5,5]undecane-3,9-dioxide (SPDPC) are phosphorus-containing compounds prepared from pentaerythritol and phosphorus oxychloride. They are used as acid sources in chemical intumescent flame retardants (IFRs).21,22 Chemical IFR system with PEPA23–25 or its derivatives combined with triazine ring26,27 are widely used to enhance the flame retardancy of polymers such as polyethylene (PE), polypropylene (PP), and EP. Further, their excellent thermal stability and ability to improve the quality of residual carbon after the polymer is burned have received widespread attention.28,29 Wang et al.15 synthesized a triazine ring-containing charring agent (PEPATA) through the reaction between PEPA and cyanuric chloride, which was used as a carbonizing agent in EP sample cured with IFR (IFR-EP). The thermal analysis results showed that the decomposition temperature of IFR-EP increased, and the amount of residual carbon of IFR-EP system was significantly higher than that of neat EP. Further, the LOI value increased from 21.5 for neat EP to 34.0 for IFR-EP, indicating improved flame retardancy. Qian et al.30 combined PEPA and melamine phosphate to prepare a novel kind of flame retardant for rigid polyurethane foam, which could generate a steady carbon layer when burned at high temperatures, showing better stability. Sun et al.31 investigated the PEPA does not add cyanuric chloride and DDM, and adds piperazine (containing amine group) to obtain flame retardant for EP flame retardant, the flame retardant properties had an increase. In our work, the TTI of the flame-retardant samples with 5% APP + 5% SPDMCD added has significantly extended. Therefore, combining PEPA and triazine ring compounds is a promising method for enhancing the flame retardancy of plastic compounds.
In this study, we prepare a novel chemical IFR containing carbon, phosphorus, and nitrogen elements, called polybicyclopentaerythritol phosphate-O-4-imino-p-phenylmethane-4-imino-2-chloro-1,3,5-s-triazine (PEDMCD). Due to the retention of gas released during pyrolysis in the expansive carbon foam layer, the thermal conductivity of the carbon layer is reduced, and the addition of a small amount of PEDMCD in EP can inhibit the gas release, greatly reduce the heat release rate (HRR), reduce the sample mass loss rate (MLR), and protect the unburned resin, which proves the excellent flame retardant effect of PEDMCD. PEDMCD is characterized by 1H nuclear magnetic resonance (NMR) and 13C NMR spectroscopy and is incorporated in EP to prepare PEDMCD/EP composite material. Due to the addition of PEDMCD in EP, the expanded carbon layer formed during combustion can significantly reduce the MLR of the material and the heat released. Especially, when an additional 5% ammonium polyphosphate (APP) is added, a relatively complete air expansion chamber can be formed. The ignition time is increased by 1.41 times as compared to that of the non-flame-retardant sample.
Experimental
Materials
Pentaerythritol (PER) powder, triethylamine, and acetonitrile were purchased from Beijing Chemical Company (Beijing, China). Phosphorus oxychloride (POCl3) was acquired from Tianjin Guangfu Fine Chemical Research Institute (Tianjin, China). 4,4-Diaminodiphenylmethane (DDM) and dimethylsulfoxide (DMSO) agent were obtained from Sinopharm Chemical Reagent Beijing Co., Ltd (Beijing, China). Melamine was procured from Sann Chemical Technology Co., Ltd. (Shanghai, China). PEPA was prepared in the laboratory. EP (E-44) was purchased from Sinopec Baling Petrochemical Branch (Yueyang, China). All the chemicals using in the experiment were of reagent grade and were used as received.Synthesis of PECD
The synthesis route of the intermediate PECD is depicted in Scheme 1, and the experimental process is described as follows. Under the protection of N2, 18.4 g (0.1 mol) cyanuric chloride, 29.7 g (0.1 mol) PEPA, and 300 ml acetonitrile were added into a 500 ml three-necked flask equipped with a mechanical stirrer and reflux condenser. The solution was stirred until PEPA was completely dissolved. Then, it was heated to 110 °C, and heating was stopped after continuing the reaction for 24 h. After evaporating most of the colorless solution through a rotary evaporator, the temperature was lowered to form white crystalline precipitate, which was washed with acetone for three times. The prepared white PECD powder was dried in a vacuum oven at 80 °C for 8–10 h. The yield of PECD was nearly 60.1%.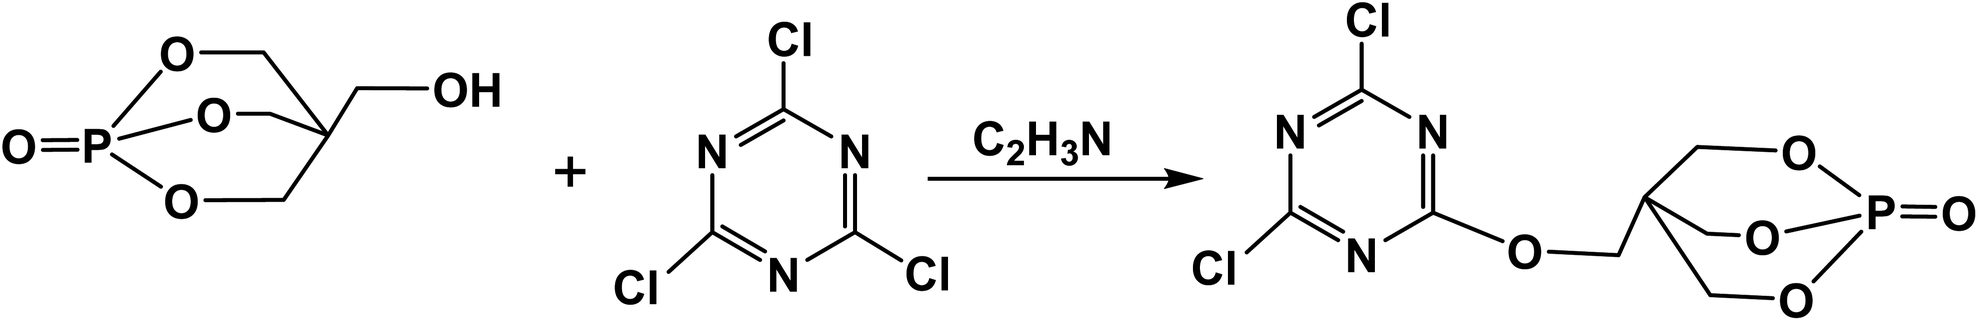 | ||
| Scheme 1 Synthesis route of PECD. | ||
Synthesis of PEDMCD
Scheme 2 depicts the synthesis route of PEDMCD. Under the protection of N2, 19.83 g (0.1 mol) DDM, 29.7 g (0.1 mol) PECD, and 300 ml acetonitrile were poured into a three-necked flask equipped with a mechanical stirrer. The condensation reaction was carried out at 105 °C, and the acidic gas released from the system was absorbed by alkali liquor. After 24 h of reaction, the heating of the system was stopped, and it was cooled to room temperature. The prepared product was washed with acetone and acetonitrile for three times. The obtained light pink powder was dried in a vacuum oven for ∼12 h at 80 °C. The finally obtained light pink powder was called PEDMCD, whose yield was ∼45.6%.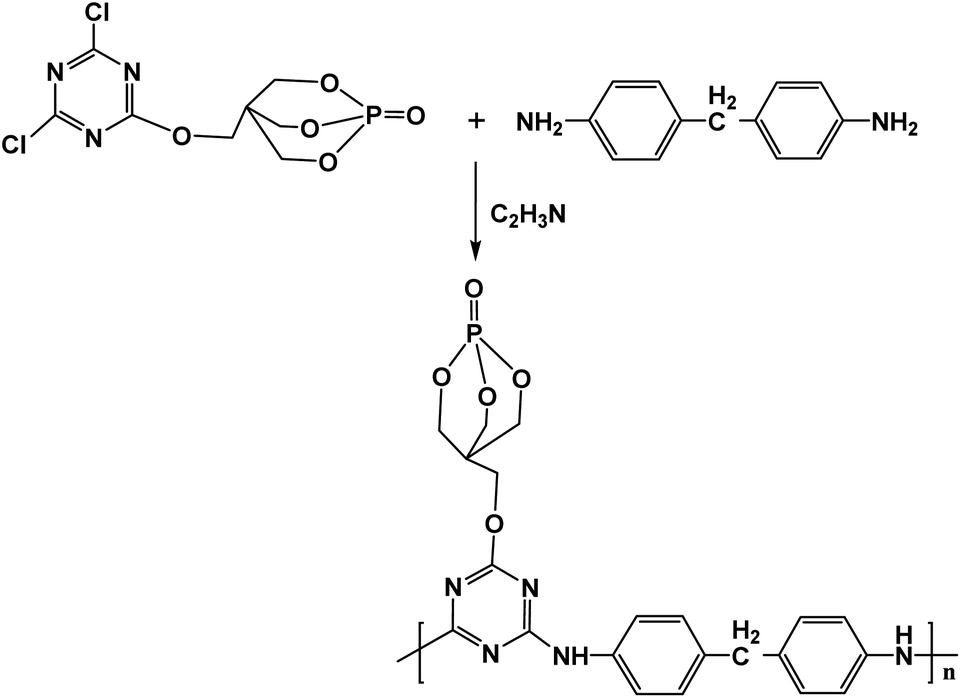 | ||
| Scheme 2 Synthesis route of PEDMCD. | ||
Preparation of PEDMCD/EP composites
A 250 ml beaker containing 50 g of EP-44 was placed in an oil bath at 80 °C and heated for 15 min. The dosage ratio of flame retardants is shown in Table 1. The prepared flame retardant PEDMCD was added into the beaker and stirred for 30 min. Then, 8.75 g (17.5 wt% EP) of curing agent DDM (melted in a blast drying oven at 80 °C) was added to the beaker. After the mixture became uniform, the air in the beaker was removed at 80 °C for 3 min (preheated in 80 °C oven for 10 min). Then, injection mold curing was performed. The mold was placed in the oven and cured at 120 °C for 2 h. Then, it was heated to 150 °C for 4 h. After demolding, the cured sample of PEDMCD/EP was obtained.| Sample | EP (wt%) | PEDMCD (wt%) | DDM (wt%) |
|---|---|---|---|
| a The dosage of components in the flame-retardant samples mentioned in the article indicate mass ratio. | |||
| EP-0 | 100 | 0 | 17.5 |
| EP-1 | 95 | 5 | 17.5 |
| EP-2 | 90 | 5 + 5 (APP) | 17.5 |
| EP-3 | 90 | 10 | 17.5 |
| EP-4 | 80 | 20 | 17.5 |
Characterization
Results and discussion
Structure and thermal stability of PEDMCD
The prepared PECD intermediate and PEDMCD were characterized by 1H NMR and 13C NMR spectroscopy, and the corresponding spectra are shown in Fig. 1 and 2, respectively. The 1H NMR spectra in the upper left corner of Fig. 1 shows two groups of peaks at 4.59–4.60 ppm and 3.29 ppm with a peak area ratio of 3.06![[thin space (1/6-em)]](https://www.rsc.org/images/entities/char_2009.gif) :1, which correspond to the hydrogen atoms attached to no. 2 and no. 3 carbon atoms in the cage structure, respectively.32,33 The peak corresponding to DMSO solvent appears at 2.5 ppm. According to the 13C NMR of PECD in Fig. 1, there are four different carbon atoms. The peaks at 150, 77, and 58 ppm correspond to no. 1, no. 2, and no. 3 carbon atoms, respectively, and the multiple peaks at 40 ppm correspond to no. 4 carbon atom. The above analysis suggests that PECD is successfully synthesized.
:1, which correspond to the hydrogen atoms attached to no. 2 and no. 3 carbon atoms in the cage structure, respectively.32,33 The peak corresponding to DMSO solvent appears at 2.5 ppm. According to the 13C NMR of PECD in Fig. 1, there are four different carbon atoms. The peaks at 150, 77, and 58 ppm correspond to no. 1, no. 2, and no. 3 carbon atoms, respectively, and the multiple peaks at 40 ppm correspond to no. 4 carbon atom. The above analysis suggests that PECD is successfully synthesized.
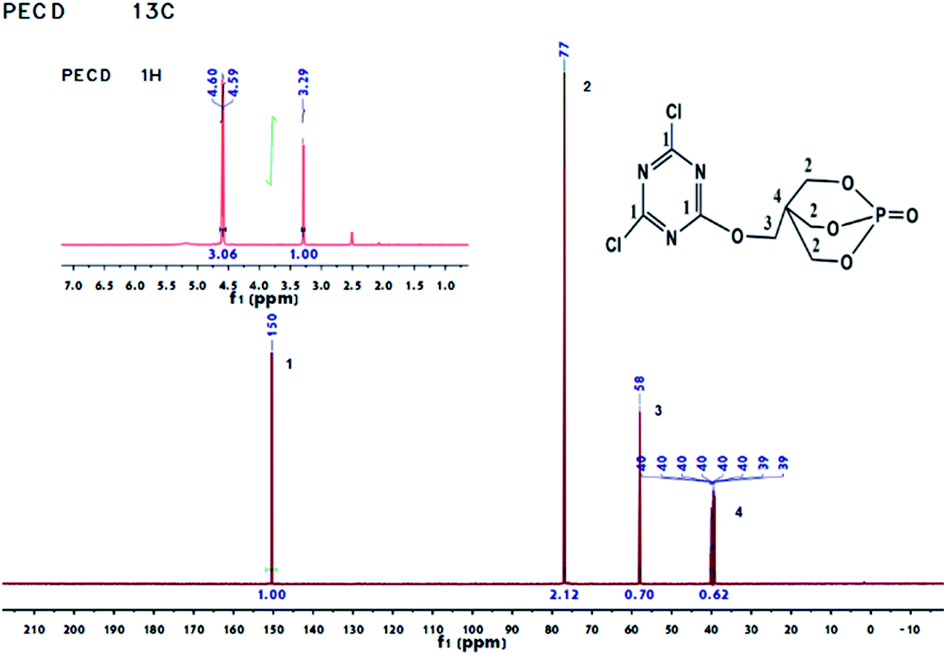 | ||
| Fig. 1 13C NMR and 1H NMR spectra of PECD. | ||
 | ||
| Fig. 2 1H NMR spectra of the synthesized PEDMCD. | ||
As shown in Fig. 2, the area of peaks corresponding to the chemical shift of 4.57 and 4.60 ppm is very small, which confirms that the content of phosphate in the compound is very low. The peaks at the chemical shifts of 3.8–4 ppm correspond to hydrogen atom on –C6H4–CH2–C6H4– from the monomer DDM, and the peak at 7.2–7.5 ppm is ascribed to hydrogen atom in the benzene ring. The area ratio of the peaks is 4:1. The area ratio of the double peak at 4.60 ppm to the single peak at 3.29 ppm is 3:1, which is the same as the hydrogen ratio of methylene at different positions in the structure of PEPA.21,34,35 The DMSO solvent peak appears at a chemical shift of 2.5 ppm.
Fig. 3 presents the FTIR spectra of prepared PECD and PEDMCD retardants. The peak at 3415 cm−1 represents the characteristic absorption peak of –NH2 from DDM. The peaks at 1300 and 1027 cm−1 correspond to the stretching vibration of P![[double bond, length as m-dash]](https://www.rsc.org/images/entities/char_e001.gif) O and P–O–C, respectively. The peaks at 860, 769, 667, and 631 cm−1 are the characteristic peaks of pentaerythritol phosphate.35,36 All these peaks appear in the IR spectra of both PECD and PEDMCD. Further, the peak at 1154 cm−1 indicates the existence of –C(CH2)4 structure, the absorption peaks at 1560, 1623, and 1416 cm−1 are attributed to the triazine ring structure on the main chain of PEDMCD,37–39 and the peaks at 1500 and 1596 cm−1 indicate the presence of benzene ring structure in PEDMCD. The absorption peak at 2923 cm−1 corresponds to the characteristic stretching vibration of hydrocarbon–CH2. When cyanuric chloride and PEPA are reacted at 110 °C for 24 hours, the PECD molecule produced has only one chlorine atom, and then reacts with DDM, the amino hydrogen activity is large, and PEDMCD hyperbranched chain structure. These absorption peaks confirm the successful synthesis of PEDMCD.
O and P–O–C, respectively. The peaks at 860, 769, 667, and 631 cm−1 are the characteristic peaks of pentaerythritol phosphate.35,36 All these peaks appear in the IR spectra of both PECD and PEDMCD. Further, the peak at 1154 cm−1 indicates the existence of –C(CH2)4 structure, the absorption peaks at 1560, 1623, and 1416 cm−1 are attributed to the triazine ring structure on the main chain of PEDMCD,37–39 and the peaks at 1500 and 1596 cm−1 indicate the presence of benzene ring structure in PEDMCD. The absorption peak at 2923 cm−1 corresponds to the characteristic stretching vibration of hydrocarbon–CH2. When cyanuric chloride and PEPA are reacted at 110 °C for 24 hours, the PECD molecule produced has only one chlorine atom, and then reacts with DDM, the amino hydrogen activity is large, and PEDMCD hyperbranched chain structure. These absorption peaks confirm the successful synthesis of PEDMCD.
 | ||
| Fig. 3 FTIR spectra of PECD and PEDMCD retardants. | ||
The thermal stability of PEPA, PECD, and PEDMCD was characterized by TGA test. The results are presented in Fig. 4 and Table 2. The temperature corresponding to 5 wt% weight loss of PEPA is 298 °C. In this stage, some decomposition products such as H2O, Co, C2H4, HCHO, C2H5OH, and HCOOH are produced.40,41 The 15 wt% weight loss temperature of PEPA is 312 °C, where H3PO4 and HPO3 appear as the decomposition products in the solidified carbon layer. As the temperature continues to rise, PEPA is further pyrolyzed to produce a large number of gaseous compounds, resulting in a faster weight loss. The weight loss of the sample is 50% of the original weight of the sample at 467 °C. When the temperature is raised to 800 °C, the weight loss of PEPA is nearly 70 wt%.
 | ||
| Fig. 4 TGA-DTG curves of PEPA, PECD, and PEDMCD. | ||
| Sample | Tx% (°C) (x = residual char, wt%) | Residual char (500 °C, wt%) | Residual char (700 °C, wt%) | |||
|---|---|---|---|---|---|---|
| 99% | 95% | 90% | 50% | |||
| PEPA | 257 | 298 | 308 | 467 | 44 | 33 |
| PECD | 173 | 238 | 280 | 377 | 32 | 23 |
| PEDMCD | 132 | 220 | 238 | 350 | 38 | 26 |
Further, Fig. 4 shows that two sharp endothermic peaks appear in the differential thermal analysis (DTG) curve of PEPA at 313.8 °C and 345.6 °C. The DTG curve of intermediate PECD also shows two sharp endothermic peaks at 317.9 °C and 372.3 °C. The first endothermic peak is not as sharp as that of PEPA, but the second peak at 372.3 °C is larger than that of PEPA because triazine group is introduced into the molecular structure, which increases the molecular weight. At the same time, triazine group promotes the formation of carbon layer and delays the decomposition of PECD. The flame retardant PEDMCD shows only one sharp endothermic peak at 256.2 °C, and a steamed bread type endothermic peak appears for all three compounds at 460–560 °C, which is attributed to the decomposition of carbon containing structural layer formed by pyrolysis.42,43
Table 2 shows that as the phosphorus content in the molecular structure decreases, the temperature at which the three compounds begin to decompose gradually decreases; as the temperature increases, the pyrolysis rate of the residue formed by the initial decomposition increases in the order of PEPA < PEDMCD < PECD, and the residue weight loss rate of three compounds is from 90% to 50%. The temperature of PEPA, PECD, and PEDMCD increase by 159, 97, and 112 °C, respectively. Accordingly, during this period, the thermal stability of the residue formed by the pyrolysis of PEDMCD is higher than that of the PECD residue. When the pyrolysis temperature is 500 °C and 700 °C, the weight loss of PECD reaches the maximum value. The phenomenon is primarily attributed to the existence of a large number of triazine groups in PECD molecules. The thermal degradation of triazine groups in PECD molecules at a low temperature mainly generates small molecular gases; therefore, the initial decomposition temperature of PECD is lower than that of PEPA. At the same time, compared to PEPA, the triazine structure in the molecular structure not only reduces the content of phosphorus but also increases the gas content in the pyrolysis product, making the molten residue structure loose, and the residue quality of PECD at 500 °C and 700 °C is lower than that of PEPA. The weight loss of PEDMCD at low temperature is rapid as compared to that during the pyrolysis of PECD, which is the branched chain of oligomer, and the end group of the chain is decomposed. The mass of the residue at 500 °C and 700 °C is higher than that of PECD, which is primarily due to the existence of p-aminophenylmethane structure in the main chain, which increases the carbon content of the system and increases the viscosity of the melt formed by pyrolysis. This improves the stability of pyrolysis at high temperature.
TGA of EP and PEDMCD/EP composites
The TGA curves of PEDMCD/EP composites are shown in Fig. 5, which provide the information on their thermal stability and thermal degradation behavior. Table 3 lists the TGA parameters. The thermal stability of five cured products: EP-0, EP-1, EP-2, EP-3, and EP-4, was tested in nitrogen and air atmosphere. It is clear from Fig. 5 that in N2 atmosphere, the 5% weight loss temperature (Tonset) and maximum weight loss temperature (Tmax) of PEDMCD/EP system gradually increase with the increase in the content of flame retardant PEDMCD. Fig. 5 shows the results of pyrolysis tests conducted in nitrogen atmosphere and air atmosphere. During the initial stage of pyrolysis, the pyrolysis curve of EP-0 is on the right side of all the flame retardant samples. At the same time, under nitrogen atmosphere, when the EP-0 sample finally enters the weightless plateau, the mass of pyrolysis residue is also the minimum, confirming that the solid product formed during pyrolysis has the worst thermal stability.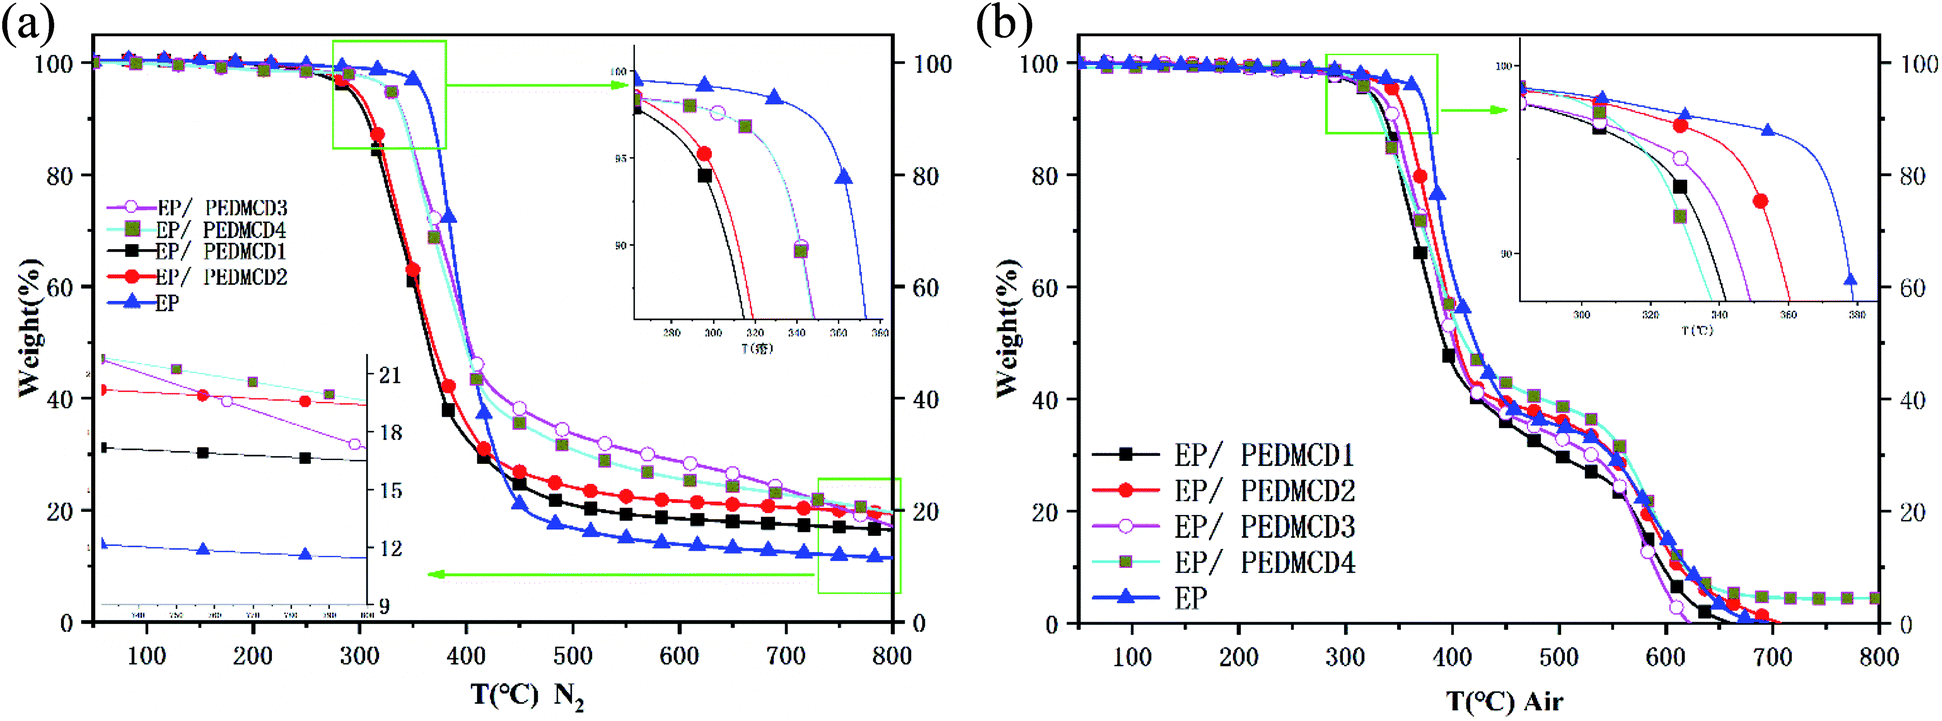 | ||
| Fig. 5 TGA curves of PEDMCE/EP composite in (a) N2 atmosphere and (b) air atmosphere. | ||
| Samples | Tonset (°C) | Tmax (°C) | Residual char (500 °C, wt%) | Residual char (700 °C, wt%) | ||||||
|---|---|---|---|---|---|---|---|---|---|---|
| N2 | Air | N2 | Air | |||||||
| N2 | Air | N2 | Air | Exp. | Cal. | Exp. | Exp. | Cal. | Exp. | |
| a Tonset is the 5% weight loss temperature; Tmax is the maximum weight loss temperature; exp.: experimental value; cal.: calculated value. | ||||||||||
| EP-0 | 388 | 368 | 408 | 383 | 17 | 33 | 13 | 0.22 | ||
| EP-1 | 291 | 321 | 346 | 320 | 21 | 18.7 | 30 | 17 | 14.5 | 0 |
| EP-2 | 297 | 345 | 348 | 385 | 24 | 21.9 | 36 | 20 | 15.5 | 0.5 |
| EP-3 | 328 | 329 | 366 | 365 | 34 | 20.4 | 33 | 24 | 15.9 | 0 |
| EP-4 | 328 | 323 | 370 | 369 | 31 | 23.8 | 39 | 23 | 18.8 | 5 |
There are two rapid weight loss stages in the thermal degradation process of the sample in air atmosphere. The thermal decomposition stage under oxygen atmosphere is between 340 °C and 430 °C. After the pyrolysis stage at 650 °C, only the residual carbon value of sample EP-4 is not zero. Further, compared to the pyrolysis in N2 atmosphere, the values of Tonset and Tmax of EP/PEDMCD composite in air atmosphere are improved. When the sample is pyrolyzed in air, only the sample EP-4 has 5 wt% residual at 700 °C.
Overall, Fig. 5 and Table 3 reveal that the residual carbon content of PEDMCD/EP is higher than that of pure EP materials. In N2 atmosphere, the experimental value of the residual mass of EP-3 at 500 °C is 13.6 wt% higher than the theoretical value, while the experimental value of EP-4 is 7.2 wt% higher than the theoretical value. However, the carbon residue of EP-2 is not as high as that of EP-2 in EP/PEDMCD. When the temperature reaches 700 °C, the EP-3 sample with 10% PEDMCD has the best quality.
In Fig. 6, in a nitrogen atmosphere, there are many sharp exothermic peaks in the EP curve, indicating that the exothermic heat is completed in a short time, and the temperature of the pyrolysis peak is significantly higher than that of the flame retardant sample. With the addition of flame retardant, the temperature trend of the exothermic peak is consistent with the trend of the TG curve. In an air atmosphere, the trend of the pyrolysis peak of the sample is basically the same as that of a nitrogen atmosphere. With the addition of flame retardants, the exothermic peak broadens and it takes longer to complete the exothermic heat.
 | ||
| Fig. 6 DSC curves of PEDMCE/EP composite in (a) N2 atmosphere and (b) air atmosphere. | ||
LOI and vertical burning test
LOI test was applied to evaluate the flame-retardant performance of PEDMCD/EP. It is well established that the LOI test facilitates a facile numerical assessment of flame-retardant stability for polymers materials.27,28 However, due to the influence of environmental factors and experimental conditions, the LOI value is not a rigorous performance indicator of the material. It was observed that the LOI value of PEDMCD/EP composite materials increased with the increase in the addition amount of flame retardant PEDMCD. It gradually increased from 19% for neat EP to 25% when the amount of PEDMCD was 20%. This suggests that PEDMCD can significantly increase the flame retardancy of EP matrix.As expected, neat EP was found to have no rating in UL-94 tests, and it generated little char residue. Furthermore, pure EP (EP-0) was accompanied with severe smoke, and the polymer exhibited droplet formation during combustion. When the amount of PEDMCE was 5%, EP-1 sample showed low flame-retardant performance, which was easy to ignite. As the amount of PEDMCE increased, the UL-94 test for 20% PEDMCE/EP reached level V-0, and there was no dripping, which indicated the anti-dropping effect of PEDMCD on EP during combustion.
Cone calorimeter test
The flame-retardant effects of PEDMCD/EP and APP/PEDMCD/EP were investigated using cone calorimeter test. This test can provide vital information on the burning characteristics of material by simulating real fire conditions. The detailed results of the cone calorimeter test are presented in Table 4, which includes the values of TTI, HRR, total heat release (THR), and total oxygen consumption. The variation in HRR and MLR of PEDMCD/EP composite samples as a function of time is shown in Fig. 7 and 8, respectively.| Sample | TTI (s) | PHRR (kW m−2) | THR (MJ m−2) | Total oxygen consumption (g) | Total smoke release (m2 m−2) | TSP (m2) | MLR (g s−1) |
|---|---|---|---|---|---|---|---|
| EP-0 | 41 | 912.2 | 98.0 | 64.2 | 4996.9 | 44.2 | 31.1 |
| EP-1 | 33 | 642.7 | 56.9 | 37.2 | 3057.6 | 27.0 | 12.4 |
| EP-2 | 58 | 341.5 | 47.0 | 30.4 | 2788.3 | 24.6 | 15.5 |
| EP-3 | 31 | 630.6 | 54.2 | 48 | 2982.8 | 24.6 | 13.7 |
| EP-4 | 29 | 580.4 | 49.2 | 38.6 | 2639.2 | 26.8 | 13.1 |
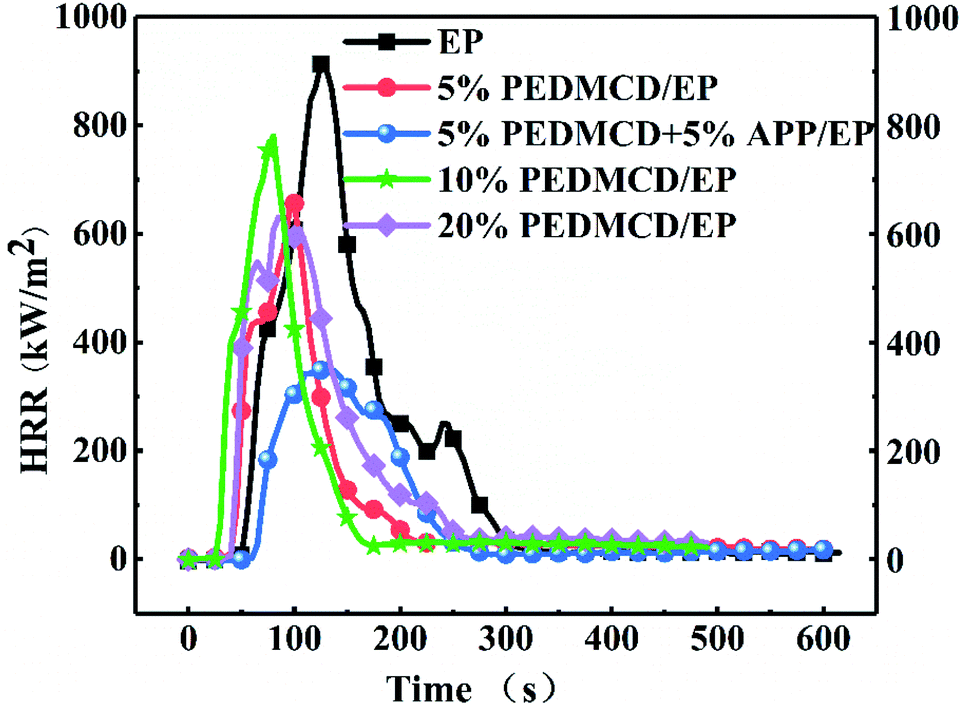 | ||
| Fig. 7 HRR curve of neat EP and EP cured with flame retardant PEDMCD and APP. | ||
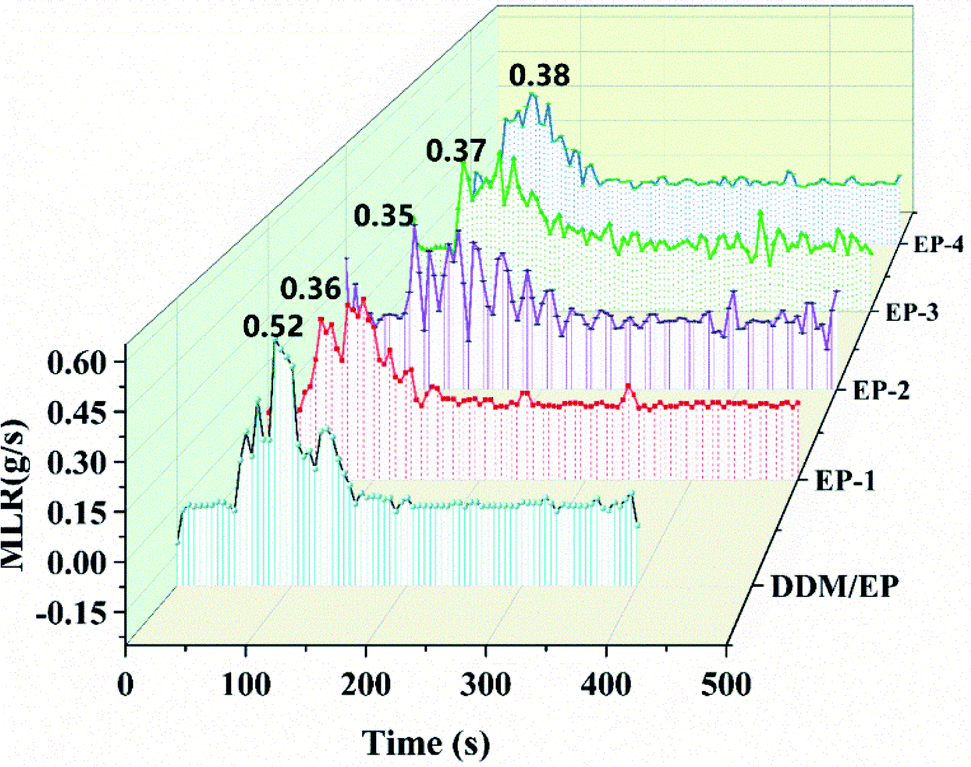 | ||
| Fig. 8 MLR curve of neat EP and EP cured with flame retardant PEDMCD. | ||
It is clear from Fig. 7 that the peak HRR (PHRR) of flame-retardant samples is lower than that of non-flame-retardant samples. When PEDMCD is added alone, the PHRR value decreases with the increase in the amount of flame retardant, and the time to reach PHRR is earlier than that of pure EP. The addition of only 5% APP in PEDMCD/EP samples not only delays the ignition time but also significantly reduces the PHRR value, which is 37% of the PHRR value of neat EP. Due to the presence of APP, the melt viscosity of polymer increases and the content of phosphate ester in the pyrolytic carbon residue increases, which affects the thermal performance of the molten material, reduces the gas spill rate, blocks the heat transfer, and greatly reduces the MLR of the solidified flame retardant material. A similar conclusion can be obtained from Fig. 8, which reveals that the heat release time of the samples with flame retardants is shorter than that of the samples without flame retardants. Further, no obvious secondary heat release occurs, and the THR is significantly lower than that of the samples without flame retardants.
As shown in Table 4, the TTI of EP-0 is 41 s, and the TTI of EP-2 with 5% PEDMCD and 5% APP is 48 s, which is 10 s later than that of EP-0. The TTI of flame retardant specimens in which only PEDMCD is added is lower than that of EP-0. The decrease in the initial pyrolysis temperature is due to the addition of PEDMCD, which is consistent with the TGA test results in Fig. 4. When APP is added, the phosphorous component in EP-2 can effectively promote the formation of dense and solid-phase residual carbon layer, thereby reducing the release rate of combustible gas and increasing the ignition time. As the phosphorus content in PEDMCD/EP increases, the THR of the sample decreases from 98 MJ m−2 to 47 MJ m−2. The total smoke production (TSP) of the sample decreases from 44.2 m2 to 24.6 m2, and the total oxygen consumption decreases from 64.2 g to 30.4 g. During the combustion process, 5% PEDMCD and 5% APP can promote the formation of dense residual carbon layer in EP, hinder the heat transfer, slow down the degradation of solidified phase, and inhibit gas escape.
When the radiation intensity is 50 kW m−2, the EP samples begin to lose weight, which means strong thermal decomposition occurs rapidly. The value of MLR at the peak is 0.52 g s−1, which is the maximum value, and its weight loss rate is significantly higher than that of PEDMCD/EP. After reaching the peak value, the decomposition rate obviously decreases, and the MLR peak appears again, which is due to the combustion of carbon residue formed by PEDMCD/EP. After this peak value, the MLR decreases rapidly until the decomposition reaction is completed in nearly 400 s. The relationship between MLR and time for several groups of PEDMCD/EP is obviously different than that for EP. The maximum MLR at the peak of EP-1, EP-2 and EP-3 is low, and the decomposition process continues after 500 s. The MLR of EP-2 varies considerably from 50 s to 200 s. The MLR of EP-2 is different than that of EP-1 and EP-3. This is due to the chemical reaction and physical process in the melt. After 500 s, the residue of EP-2 is still decomposed, while the decomposition of EP-3 is basically completed.
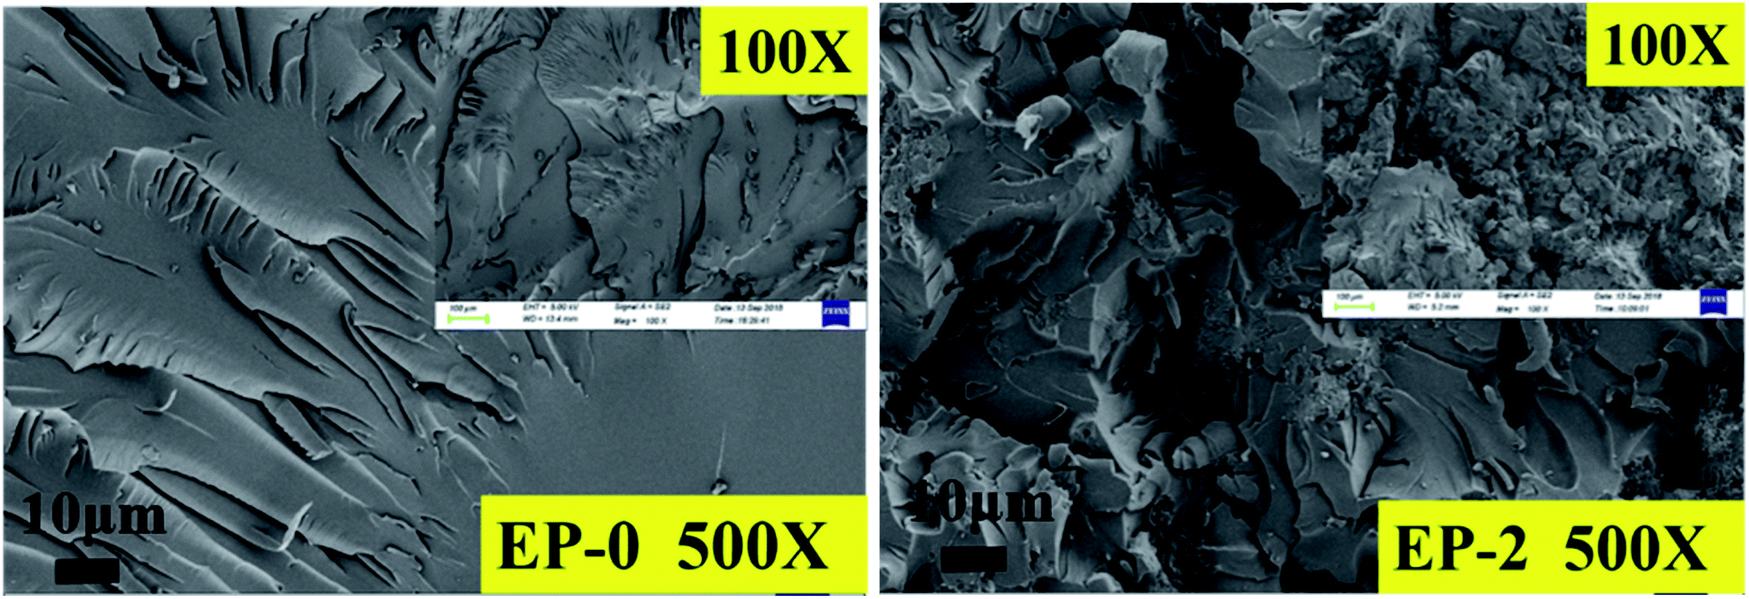
Morphology and compositional analysis of the residues from the cone calorimeter test
To better understand the flame retardant effect of PEDMCD on EP, the carbon residue obtained after the cone calorimeter test was analyzed. Fig. 9 shows the digital images of carbon residue of EP-0, EP-2, and EP-3. Fig. 10 shows the SEM images of EP-3 after the test.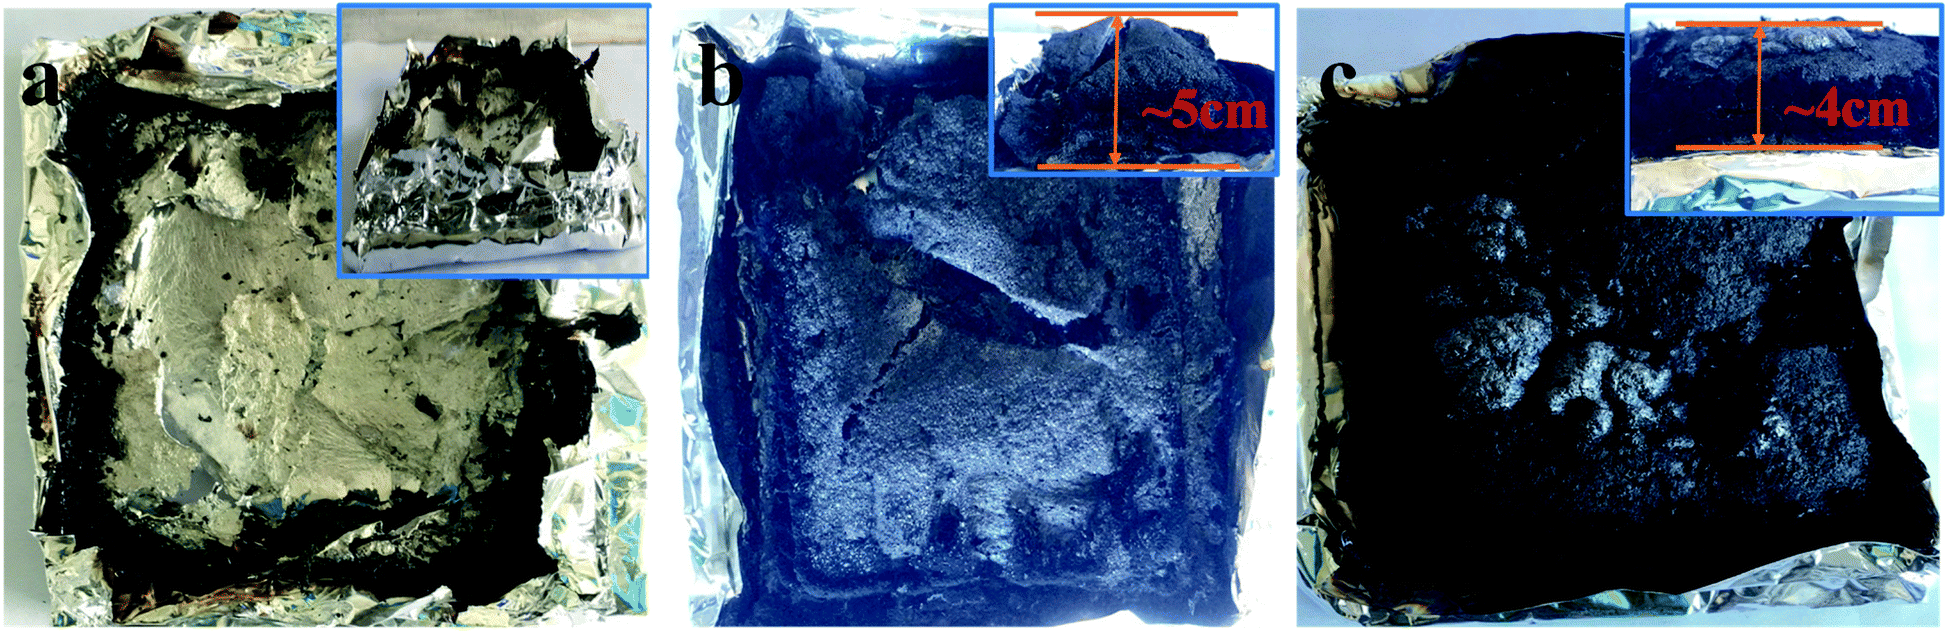 | ||
| Fig. 9 Digital images of EP-0, EP-2 (5% APP + 5% PEDMCD) and EP-3 (10% PEDMCD) after the cone calorimeter test. | ||
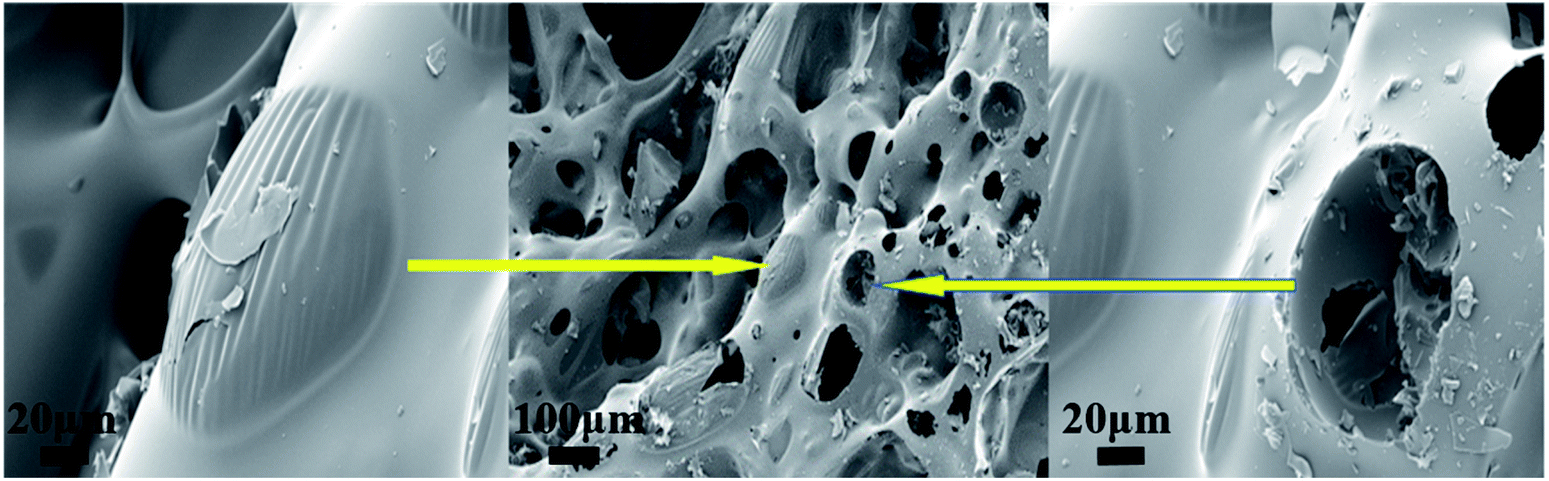 | ||
| Fig. 10 SEM images of EP-2 (5% APP + 5% PEDMCD) after the cone calorimeter test. | ||
As shown in Fig. 9a, after the cone calorimeter test, the residual carbon content of pure EP is negligible, which further proves that the flame-retardant performance of pure EP is poor, and it is almost completely burned. In contrast, when 5% PEDMCD and 5% APP are added, the residual carbon layer expands and its thickness is close to 5 cm (see the inset in Fig. 8b). This proves that the combination of PEDMCD and commonly used flame retardant APP can improve the flame retardancy of EP, and the carbon layer appears fluffy. As shown in Fig. 9c, when only 10% PEDMCD is added, the residual carbon is obvious, and the expanded carbon layer becomes dense. The dense residual carbon layer can improve the flame retardancy in the solidification phase. As shown in Fig. 9c, the thickness of expanded carbon layer is approximately 4 cm, which proves that PEDMCD has better flame-retardant performance when the added amount is the same. This validates the excellent flame retardant effect of the proposed PEDMCD additive.
As shown in Fig. 9, when 5% APP and 5% PEDMCD are added, the surface of the residual carbon obtained from the flame retardant sample after the cone calorimeter test is flat and compact, which proves that the expanded carbon layer is gradually formed during the process. The flame-retardant polymer has a large melt viscosity, and the carbon layer frame has no obvious defects, but cracks appear. This is due to the obvious stress concentration or asynchronous volume shrinkage in the melt EP during burning, crosslinking, and polycondensation process. Combined with the HRR curve in Fig. 7, it can be seen that the sample EP-2 releases heat at a later time than sample EP-0, and the amount of smoke and heat released are significantly lower than that of EP-0. This confirms that during the cone calorimeter test, the gradually expanding foam air chamber not only inhibits the escape of volatile gases (as the thermal conductivity of the gas in the gas chamber is much lower than that of the solid) but also reduces the heat transfer rate. Comparing the digital images of EP-2 and EP-3 with the HRR curve obtained through the cone calorimeter test, it can be seen that the dense and complete expanded carbon layer is more conducive to reducing the heat transfer and escape rate of volatile gases. Further, Fig. 10 shows an SEM image of the flame-retardant sample EP-2 containing 5% APP and 5% PEDMCD with added carbon residue after the cone calorimetry test. Comparing the three images, it can be seen that there is complete carbon residue on EP-2. There are micron-scale tensile deformation traces on the surface of the undamaged air cell and broken cells, which proves that the pyrolysis process of the flame retardant system is more coordinated with the pyrolysis process of the cured epoxy material during the pyrolysis of EP-2. It not only promotes the premature pyrolysis of the flame-retardant samples but also improves the structure of the residue. During the process of polycondensation, cross-linked multi-cohesion, cross-linking, arylation, and carbonization, a melt with a certain viscosity is formed, which seals a part of the pyrolyzed gas in the foam chamber. The outgoing gas is enclosed in the air foam chamber to form a dense expanded foam layer, which effectively reduces the thermal conductivity of the residue. This electron micrograph is consistent with the variation of MLR in Fig. 7. Therefore, EP-2 has a good flame-retardant effect.
Tensile test
The static mechanical properties of PEDMCD/EP were characterized by tensile test, and the results are shown in Fig. 11. It is clear that the addition of PEDMCD significantly affects the tensile strength of prepared PEDMCD/EP samples. The tensile stress of 5% PEDMCD is 63 MPa higher than that of pure EP, which is primarily attributed to the fact that the DDM group in the main chain of PEDMCD is homologous to the curing agent in EP, so the interface effect between PEDMCD and EP is reduced, and the compatibility between PEDMCD and cured EP is improved. Further, as PEDMCD is not soluble in EP or DDM, the crosslink density and tensile strength of cured products decrease with the increase in the addition amount of PEDMCD. This proves that PEDMCD has a good solubility in EP matrix. | ||
| Fig. 11 Tensile strength and elongation at break of EP and PEDMCD/EP. | ||
To further understand the effect of PEDMCD on the mechanical properties of EP, the fracture morphology of the samples was analyzed by SEM, and the corresponding images are shown in Fig. 12. In contrast to EP-0 without flame retardant, when the flame retardants (5% PEDMCD and 5% APP) are added, the tensile cross-section of the cured material reveals the formation of two intersecting faults. This is because there are several phenylamine structures in PEDMCD, and the curing agent used in the epoxy compound is DDM, thus the p-phenylenediamine residues in the engineered network of cured epoxy material are homologous to those on the backbone of the flame retardant PEDMCD molecule. And the EDX imges in Fig. 13 shows the C, O, P and N elements content in 20% PEDMCD/EP composite, which shows the sample is not 100% homogenous. Therefore, PEDMCD and the cured epoxy product have good compatibility. The inhomogeneity of the system is reduced. Further, the existence of amino groups may also increase the crosslinking point in the system and increase the strength of the system.
 | ||
| Fig. 12 SEM image of cross section after tensile test of EP-0 and EP-2. | ||
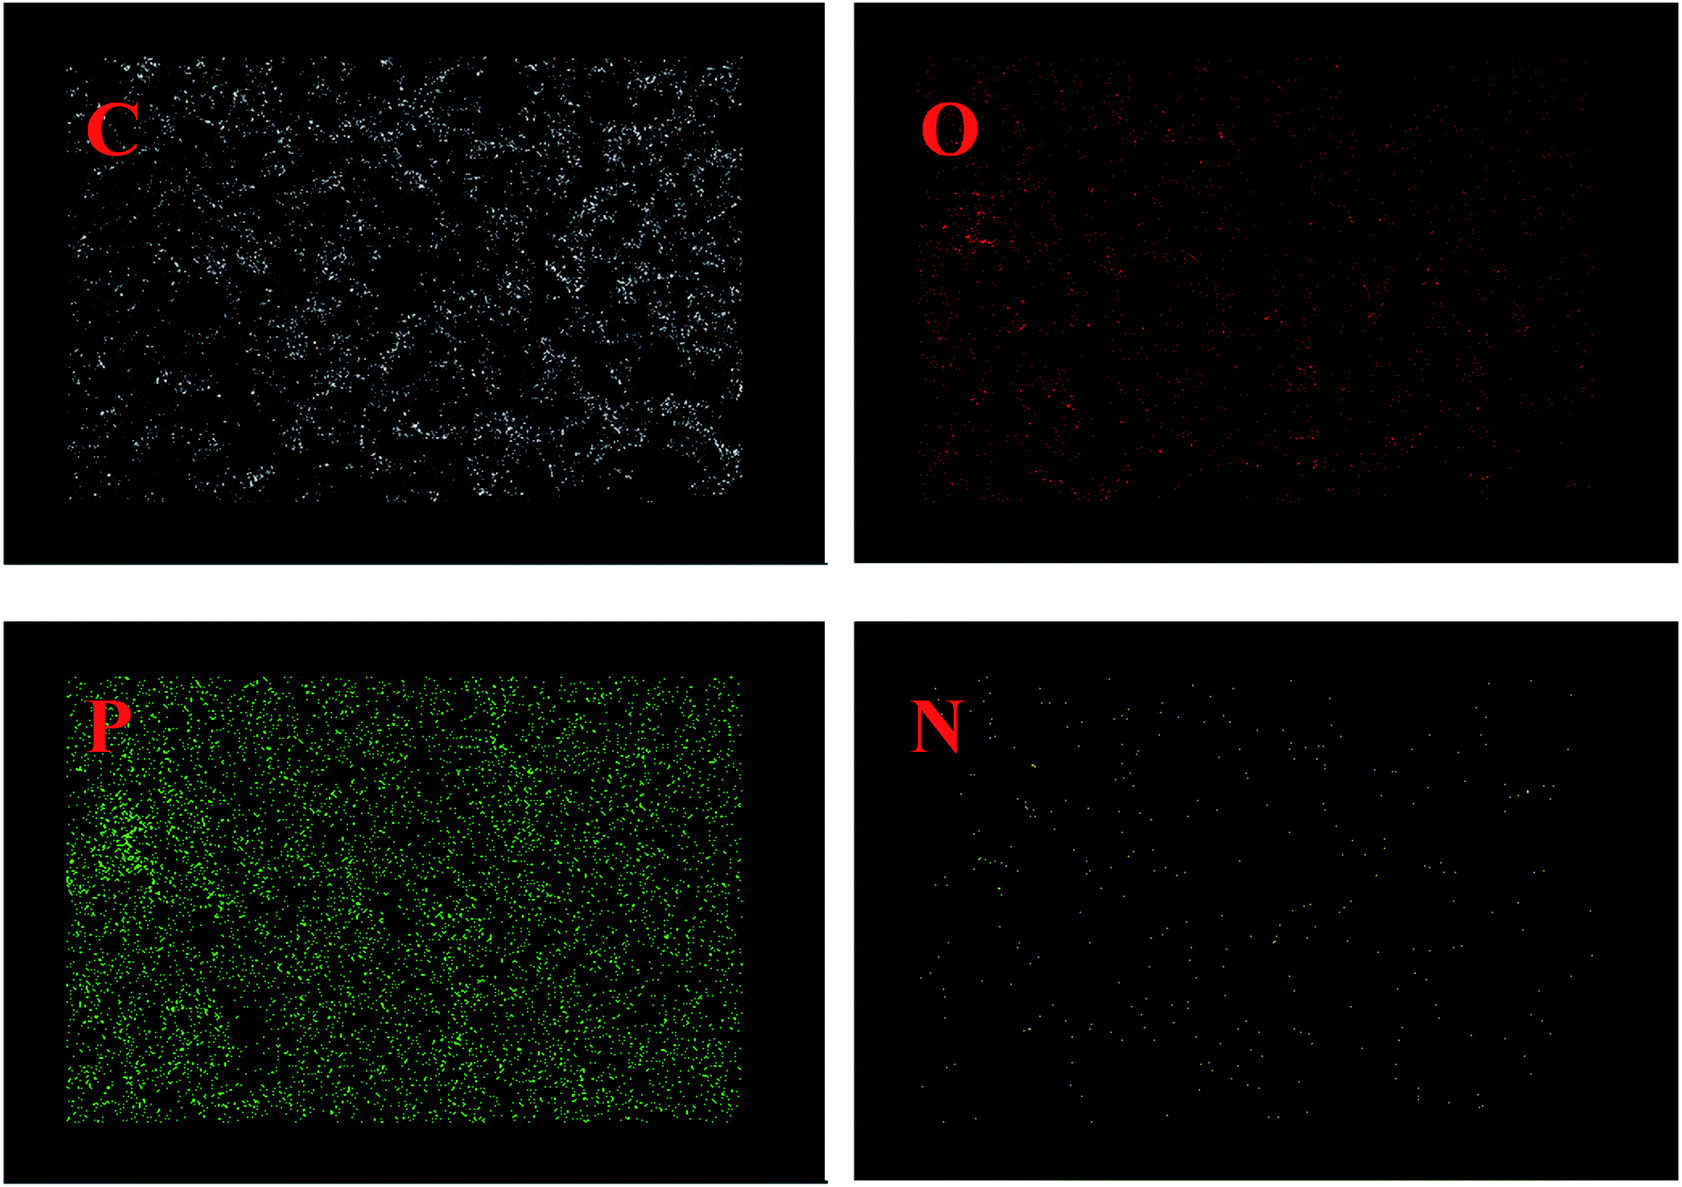 | ||
| Fig. 13 EDX image of cross section of 20% PEDMCE/EP. | ||
Conclusion
A novel flame-retardant additive called PEDMCD was synthesized, and the thermal degradation behavior and flame-retardant performance of PEDMCD/EP composite were studied. The EP with 20 wt% PEDMCD exhibited a LOI value of 26% and V-0 level in the UL-94 test. The incorporation of PEDMCD decreased the PHRR and THR, increased the TTI, and enhanced the charring ability of EP. The flame retardant effect of PEDMCD resulted not only from the flame inhibition effect in the gaseous phase but also from the charring and barrier effect of the flexible and sealed char layer in the condensed phase. The chemical IFR mainly played a flame retardant effect in the solidified phase. The structure and density of the residue affected its flame retardant performance. In this work, PEDMCD was used to modify EP to obtain the cured product when it was pyrolyzed. PEDMCD caused the cured product to pyrolyze in advance, and the viscosity of the formed melt was high. Especially when 5% APP was also added, the melt structure formed could retain a certain amount of pyrolysis gas, which effectively reduced the thermal conductivity of the melt. Furthermore, after the addition of APP, an obvious foamed carbon layer was formed. The cone calorimeter, LOI, UL-94 vertical burning, and tensile tests proved that the addition of PEDMCD and APP significantly improved the flame-retardant properties of the material. The tensile test confirmed that unlike the common flame-retardant system, the addition of PEDMCD in EP improved the tensile strength of the material. Overall, this work provides a rapid approach to determine the flame retardancy of novel flame retardants. Further, it potentially promotes the design of other composites with a high flame-retardant performance, adequate glass transition temperature, and large fracture toughness for practical applications.Author contributions
Data curation and formal analysis, Weiwei Yang; investigation, and supervision, Yi Zhang.Conflicts of interest
There are no conflicts to declare.Acknowledgements
The authors would like to thank all the reviewers who participated in the review and MJEditor (www.mjeditor.com) for its linguistic assistance during the preparation of this manuscript.Notes and references
- H. Gu, C. Ma, J. Gu, J. Guo, X. Yan, J. Huang, Q. Zhang and Z. Guo, J. Mater. Chem. C, 2016, 4, 5890 RSC.
- S. Wang, S. Ma, C. Xu, Y. Liu, J. Dai, Z. Wang, X. Liu, J. Chen, X. Shen, J. Wei and J. Zhu, Macromolecules, 2017, 50, 1892 CrossRef CAS.
- R. Auvergne, S. Caillol, G. David, B. Boutevin and J. P. Pascault, Chem. Rev., 2014, 114, 1082 CrossRef CAS.
- L. P. Gao, D. Y. Wang, Y. Z. Wang, J. S. Wang and B. Yang, Polym. Degrad. Stab., 2008, 93, 1308 CrossRef CAS.
- H. Liu, X. Wang and D. Wu, Polym. Degrad. Stab., 2014, 103, 96 CrossRef CAS.
- B. Dittrich, K. A. Wartig, R. Mülhaupt and B. Schartel, Polymers, 2014, 6, 2875 CrossRef.
- R. K. Jian, Y. F. Ai, L. Xia, L. J. Zhao and H. B. Zhao, J. Hazard. Mater., 2019, 371, 529 CrossRef CAS.
- L. Yan, Z. Xu and X. Wang, Prog. Org. Coat., 2018, 122, 107 CrossRef CAS.
- G. Camino, L. Costa and G. Martinasso, Polym. Degrad. Stab., 1989, 23, 359 CrossRef CAS.
- Q. L. Li, X. L. Wang, D. Y. Wang, W. C. Xiong, G. H. Zhong and Y. Z. Wang, J. Appl. Polym. Sci., 2010, 117, 3066 CAS.
- D. Y. Wang, X. G. Ge, Y. Z. Wang, C. Wang, M. H. Qu and Q. Zhou, Macromol. Mater. Eng., 2006, 291, 638 CrossRef CAS.
- D. Q. Chen, Y. Z. Wang, X. P. Hu, D. Y. Wang, M. H. Qu and B. Yang, Polym. Degrad. Stab., 2005, 88, 349 CrossRef CAS.
- L. Li, P. Wei, J. Li, J. Jow and K. Su, J. Fire Sci., 2010, 28, 523 CrossRef CAS.
- M. J. Chen, Y. C. Lin, X. N. Wang, L. Zhong, Q. L. Li and Z. G. Liu, Ind. Eng. Chem. Res., 2015, 54, 12705 CrossRef CAS.
- X. Wang, Y. Hu, L. Song, W. Xing, H. Lu, P. Lv and G. Jie, Polym. Adv. Technol., 2011, 22, 2480 CrossRef CAS.
- S. Yang, J. Wang, S. Huo, M. Wang and L. Cheng, Ind. Eng. Chem. Res., 2015, 54, 7777 CrossRef CAS.
- Z. Li, T. Song, J. Liu and Y. Yan, Iran. Polym. J., 2017, 26, 21 CrossRef CAS.
- W. Zhang, X. Li, H. Fan and R. Yang, Polym. Degrad. Stab., 2012, 97, 2241 CrossRef CAS.
- W. Zhang, X. Li and R. Yang, Polym. Degrad. Stab., 2014, 99, 298 CrossRef CAS.
- W. Zhang, X. Li, L. Li and R. Yang, Polym. Degrad. Stab., 2012, 97, 1041 CrossRef CAS.
- W. Zhao, J. Liu, H. Peng, J. Liao and X. Wang, Polym. Degrad. Stab., 2015, 118, 120 CrossRef CAS.
- X. Lai, S. Tang, H. Li and X. Zeng, Polym. Degrad. Stab., 2015, 113, 22 CrossRef CAS.
- Y. Shi and G. Wang, Prog. Org. Coat., 2016, 97, 1 CrossRef CAS.
- Y. Shi and G. Wang, Appl. Surf. Sci., 2016, 385, 453 CrossRef CAS.
- G. H. Hsiue, Y. L. Liu and J. Tsiao, J. Appl. Polym. Sci., 2000, 78, 1 CrossRef CAS.
- L. Qian, Y. Qiu, N. Sun, M. Xu, G. Xu, F. Xin and Y. Chen, Polym. Degrad. Stab., 2014, 107, 98 CrossRef CAS.
- J. Dai and B. Li, J. Appl. Polym. Sci., 2010, 116, 2157 CAS.
- M. Banks, J. R. Ebdon and M. Johnson, Polymer, 1993, 34, 4547 CrossRef CAS.
- L. L. Zhang, A. H. Liu and X. R. Zeng, J. Appl. Polym. Sci., 2009, 111, 168 CrossRef CAS.
- J. D. Qian, Y. Z. Wu, C. C. Dong, Y. H. Yuan, B. Gui and S. L. Ding, China Plast. Ind., 2014, 5, 74 Search PubMed.
- Y. B. Sun, Y. H. Hou and W. Z. Hu, Mater. Chem. Phys., 2018, 214, 154–164 CrossRef.
- F. Gao, L. Tong and Z. Fang, Polym. Degrad. Stab., 2006, 91, 1295 CrossRef CAS.
- Z. Sun, Y. Hou, Y. Hu and W. Hu, Mater. Chem. Phys., 2018, 214, 154 CrossRef CAS.
- P. Song, Z. Fang, L. Tong and Z. Xu, Polym. Eng. Sci., 2009, 49, 1326 CrossRef CAS.
- A. I. Balabanovic, Thermochim. Acta, 2005, 435, 188 CrossRef.
- D. W. Allen, E. C. Anderton, C. Bradley and L. E. Shiel, Polym. Degrad. Stab., 1995, 47, 67 CrossRef CAS.
- S. Huo, J. Wang, S. Yang, J. Wang, B. Zhang, B. Zhang, X. Chen and Y. Tang, Polym. Degrad. Stab., 2016, 131, 106 CrossRef CAS.
- H. Wu, R. Hu, B. Zeng, L. Yang, T. Chen, W. Zheng, X. Liu, W. Luo and L. Dai, RSC Adv., 2018, 8, 37631 RSC.
- W. Xie, S. Huang, S. Liu and J. Zhao, RSC Adv., 2019, 9, 30815 RSC.
- N. D. Mathan, M. Arunjunairaj, T. Rajkumar, D. Ponraju and C. T. Vijayakumar, J. Therm. Anal. Calorim., 2012, 110, 1133 CrossRef CAS.
- Y. L. Liu, G. H. Hsiue, C. W. Lan and Y. S. Chiu, Polym. Degrad. Stab., 1997, 56, 291 CrossRef CAS.
- G. Yang, W. H. Wu, Y. H. Wang, Y. H. Jiao, L. Y. Lu, H. Q. Qu and X. Y. Qin, J. Hazard. Mater., 2019, 366, 78 CrossRef CAS.
- B. Xu, X. Wu, W. Ma, F. Xin and Y. Qiu, J. Anal. Appl. Pyrolysis, 2018, 134, 231–242 CrossRef CAS.
| This journal is © The Royal Society of Chemistry 2021 |