
 Open Access Article
 This Open Access Article is licensed under a Creative Commons Attribution-Non Commercial 3.0 Unported Licence
Unraveling the catalytic mechanisms of H2 production with thiosemicarbazone nickel complexes†
Alexandre Barrozo * and
Maylis Orio*
* and
Maylis Orio*
Aix-Marseille Univ, CNRS, Centrale Marseille, iSm2, Marseille, France. E-mail: alexandre.hernandes-barrozo@univ-amu.fr; maylis.orio@univ-amu.fr
First published on 27th January 2021
Abstract
Thiosemicarbazone-based complexes have been explored as a new class of redox-active catalysts H2 production due to their flexibility for extensive optimization. To rationalize the process, we need to understand how these complexes function. In this work, we used DFT calculations to investigate the various mechanisms that could take place for three previously characterized Ni complexes. We found that two possible mechanisms are compatible with previously published experimental data, involving protonation of two adjacent N atoms close to the metal center. The first step likely involves a proton-coupled electron transfer process from a proton source to one of the distal N atoms in the ligand. From here, a second proton can be transferred either to the coordinating N atom situated in between the first protonated atom and the Ni atom, or to the second distal N atom. The former case then has the protons in close distance for H2 production. However, the latter will require a third protonation event to occur, which would fall in one of the N atoms adjacent to the Ni center, resulting in a similar mechanism. Finally, we show that the H–H bond formation is the rate-limiting step, and suggest additional strategies that can be taken into account to further optimize these complexes.
Introduction
Hydrogen has been regarded as a promising renewable and non-polluting molecular fuel to answer the world energy demand.1,2 One of the main challenges lies with strategies of cost-effective and green mass production. The scientific community has been advancing toward finding alternatives to platinum-based catalysts, the golden standard for man-made hydrogen production.3 This has been possible thanks to continuous research on how hydrogenases produce H2 in nature.4–6 As a consequence, innumerous molecular electrocatalysts have been developed, attempting to either reproduce the chemical structure of the active sites in these enzymes (biomimetic),7–12 or their main mechanistic features (bioinspired).13–16In the past few years, molecular complexes based on thiosemicarbazone ligands have drawn significant attention due to their efficiency, low overpotential requirement and the active role played by the ligand in the hydrogen evolution reaction (HER).17–22 Thiosemicarbazone ligands are highly customizable, offering the possibility to not only fine-tune the catalytic cycle of the complex, but also to better understand the different ways HER can occur. Thus, it is paramount to understand how these catalysts work, which is the main goal of this work.
We have recently studied a set of mononuclear Ni-thiosemicarbazone (NiL) complexes.23 The idea was to investigate the impact of different phenyl substituents as a strategy of ligand optimization for HER. We have shown that the more electron-withdrawing the substituent was, the less negative the overpotential requirement became. However, simply changing the overpotential was not the best strategy to optimize the complex, as we saw an impact in the turnover rates of H2 production.
In this article, we considered three catalysts from our previous studies: two of the best catalysts (NiOCH3 and NiSCH3), and the best in terms of overpotential, but worst in turnover (NiCN). We assessed all the possible mechanisms for HER using DFT, finding two types of pathways that accurately account for multiple experimental observations, such as cyclic voltammograms and UV-Vis spectra, in the presence of trifluoric acid (TFA) acting as the proton source. We show that the catalytic cycle is best described by a [EC][EC] and a [EC][EC]C mechanism occurring concomitantly (Fig. 1), where E describes an electrochemical event, C, a chemical (proton transfer) event, and [EC], a concerted proton-coupled electron transfer (PCET). We show that the latter, involving three protons, is the rate-limiting step, and reproduces trend in kinetics for the three catalysts. Additionally, our data shows that PCET is essential, as it stabilizes the reduction steps by ∼0.25 V for different complexes for the first step. We conclude by proposing possible synthetic strategies to design new Ni-thiosemicarbazone catalysts.
 | ||
| Fig. 1 The two-proton, two-electron proposed catalytic cycle for the series of NiL complexes investigated in this study. R = OCH3, SCH3 and CN. In red, we indicate the notation adopted for this article, where NNi corresponds to the coordinating N atoms, and Nd is the distal N atom further away from Ni. TFA− and TFAH corresponds to the anionic conjugated base and the neutral protonated form of TFA, respectively. Protonation sites were determined based on calculated relative pKa values. The catalytic cycle begins with the complex in a neutral singlet state (a). The arrival of TFAH will trigger a PCET involving one of the Nd sites, provided that enough potential is applied to the system (b). The process would repeat itself, this time with protonation of an adjacent NNi atom (d). A possibility of a three-proton scenario is also considered (in green), with both Nd protonated prior to protonation of one of the NNi atoms (c). | ||
Results and discussion
The first steps: EE, EC, CE, CC or [EC]?
Throughout the article, TFAH refers to protonated neutral form of the acid, while TFA− stands for the anionic conjugated base form. We start by revisiting previous experimental observations on these complexes (Table 1). In cyclic voltammetry experiments in the presence of TFAH, we noticed a single peak at ∼−1.3 V (vs. Fc+/0), corresponding to the potential necessary to allow for the catalytic cycle to take place.21,23 Redox potential calculations of those complexes yield a first potential at ∼−1.5 V, and a second at ∼−2.0 V, regardless of the substituent.19 Unless the presence of TFAH H-bonding the complex would stabilize the second reduction by ∼0.7 V, we could discard a mechanism starting with EE. UV-Vis experiments21,23 showed that the spectrum does not change in the absence and presence of TFAH. Since it is a strong acid, this finding points to the fact that the complex does not get protonated spontaneously. Thus, we can expect that mechanisms starting with a chemical step (CE and CC) are not likely to occur. Thus, we would ultimately consider the first steps as being either a stepwise EC process, or a single, concerted, [EC] step. With that in mind, we need to probe how and where the first protonation step occurs.| Complex | E0(NiIIL/NiIIL−) | E0(NiIIL−/NiIL2−) | Ecat/2 (TFA) |
|---|---|---|---|
| NiOCH3 | −1.57 | −2.20 | −1.32 |
| NiSCH3 | −1.50 | −2.13 | −1.33 |
| NiCN | −1.40 | −1.99 | −1.27 |
One of the complications in studying these complexes lies with its multiple protonation sites (Fig. 1). We can disregard the case where the N atoms from the phenylthiocarbamide fragments are protonated, since adding a second H atom to them yields a very high energy species.21,24 Due to symmetry, there are four sites to consider: Ni, S, NNi and Nd. We calculated the relative values of pKa after the first reduction by comparing free energy differences for each protonation event. We observed that Nd is the most favorable site for the first protonation (Table 2). With this in mind, we proceeded with investigating the energetics of the first proton transfer. This involved assessing the free energies associated with the complex in the presence of a TFAH molecule H-bonding Nd. We analyzed the energies considering the proton either attached to TFA− (reactant state, RS), or transferred to the complex (product state, PS), also taking into account different oxidation states (i.e. NiL0, NiL− and NiL2−).
| Protonation sites | NiLH+ | NiLH0 |
|---|---|---|
| 1st protonation | ||
| Nd | — | 0 |
| NNi | — | −4.2 |
| S | — | −8.2 |
| Ni | — | −10.8 |
![[thin space (1/6-em)]](https://www.rsc.org/images/entities/char_2009.gif) |
||
| 2nd protonation: without TFAH | ||
| Nd,1, Nd,2 | 0 | 0 |
| Nd,1, NNi,1 | −6.5 | −0.4 |
| Nd,1, NNi,2 | −10.0 | −0.6 |
| Nd,1, S1 | −7.2 | −4.1 |
| Nd,1, S2 | −8.7 | −4.6 |
| Nd,1, Ni | −15.5 | −4.3 |
|
||
| 2nd protonation: with TFAH | ||
| Nd,1, Nd,2 | 0 | 0 |
| Nd,1, NNi,1 | −2.7 | 3.1 |
Fig. 2 shows a scheme with free energies for every process. On the top, we display the two reduction potentials for each complex in the absence of the proton source. When considering TFAH interacting with the protonation site, a spontaneous proton transfer occurs upon reduction. Furthermore, we notice that the reduction process of the complex is at least 0.2 eV less negative than in the absence of acid (e.g. −1.31 vs. −1.54 V for NiOCH3). This stabilization effect suggests a PCET phenomenon. Such change in reduction potentials was also seen in cyclic voltammograms, in similar magnitude (Table 1).
 | ||
| Fig. 2 Free energy diagram considering the first protonation, as well as first and second reduction steps. Red, yellow and blue numbers are free energy differences corresponding to OCH3, SCH3 and CN substituents, respectively. All number are in eV. | ||
The following steps: EC, CE or [EC]?
Our calculations show that the first part of the cycle is a PCET to Nd. This means that now we have our complex protonated at one of the Nd atoms, and the protonated complex remain neutral. In principle, what we would need to do at this stage is to simply repeat the previous calculations, now considering a new protonation state of the complex. We start by considering the pKas of the possible proton acceptors. However, protonation of one site broke the symmetry of the complex, so we need to take into account both sides.At this stage, we should also consider two different oxidation states: NiLH+ and NiLH0, corresponding to the second protonation event before and after the second reduction, respectively. Comparison of energetics show that the second reduction state is best described by a singlet state. Table 2 shows the relative values of pKa against protonating both Nd sites. We see that most favorable protonation state involves both Nd sites, regardless of the oxidation state. However, due to the structures of the complexes and TFAH, there is a possibility of a double H-bonding interaction for one particular site: the Nd,1,NNi,1, where two adjacent N atoms would become protonated (Fig. 1 and 3), and this could increase its pKa. In fact, recalculating the pKa difference between protonating the adjacent NNi and the opposite side Nd reduces the pKa gap to −2.7 units to the adjacent site prior to reduction (NiLH2+), and becomes advantageous by 3.1 units upon reduction (NiLH20). This double H-bonding advantage is solely present for the NNi adjacent to the protonated Nd, creating a more stabilizing site for TFAH to bind to the complex, which could favor this kind of interaction between the acid and the complex. Additionally, since the complexes differ in substituents far from the thiosemicarbazone structure, and their electronic structures are very similar (Fig. S1–S3†), relative pKas will not differ significantly.
 | ||
| Fig. 3 Free energy diagram considering the second protonation to two adjacent N atoms (Nd and NNi) and the final step of the cycle. Red, yellow and blue numbers are free energy differences corresponding to OCH3, SCH3 and CN substituents, respectively. All number are in eV. | ||
We start by assessing the simpler two-proton, two-electron scenario. We performed the same analysis as done above (Fig. 3). Just like with geometry optimization upon reduction of the complex and in the presence of TFAH, the proton transferred is triggered spontaneously. The same kind of stabilizing effect on the redox potentials is observed.
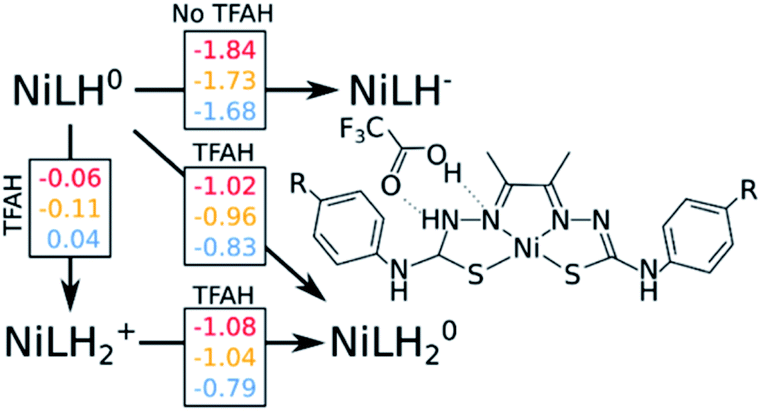
Our results point out to a second PCET, being more advantageous than a stepwise EC process, which features calculated potentials above the measured catalytic potentials (e.g. −1.84 vs. −1.32 V for NiOCH3). Additionally, the calculated PCET redox potentials are below the catalytic potential (e.g. −1.02 vs. −1.32 V for NiOCH3), which makes such process able to take place.
This is not the only possibility: unlike the first part of the cycle, we need to consider a possible proton transfer prior to reduction. Our calculations show that a proton transfer before reduction is energetically favourable for NiOCH3 and NiSCH3, but slightly unfavourable for NiCN substituent. Furthermore, the subsequent reduction potentials are also below the catalytic potential, although 40–60 mV more negative than the PCET path (−1.08 vs. −1.02 V for NiOCH3). As a consequence, we cannot easily discriminate between [EC] and CE at this stage. However, considering that: (i) catalysis would occur at a potential of ∼−1.3 V, (ii) electrons are faster than protons, and (iii) the reduction potential for the PCET event is less negative by about 0.3 V compared to experiment, we could speculate that [EC] is more likely to occur than the stepwise CE. A more detailed study would be required to confirm this hypothesis.
The “three-proton” scenarios
A catalytic cycle for H2 production does not necessarily need to involve two protons. Hess and co-workers have reported a cobalt complex where three protons are required, with one of them acting as a pre-catalytic preparation of the complex.25 This possibility could also take place in the kind of catalysts studied here. Table 2 shows that the pKa for a protonation of the second Nd is favorable prior to a second reduction, regardless of the interactions with TFAH. Thus, we need to take it into account. This would be an intermediate step of a three-proton scenario, where a third proton would eventually bind to NNi, as expected from Table 2, particularly regarding the interaction between TFAH and the protonated complex. Fig. 4 shows the free energy diagrams of these two steps. While for NiSCH3 and NiCN we again observe a PCET, for NiOCH3 we observe a spontaneous protonation prior to reduction of the complex. | ||
| Fig. 4 Free energy diagram considering the second protonation to the second Nd atom. Red, yellow and blue numbers are free energy differences corresponding to OCH3, SCH3 and CN substituents, respectively. The NiOCH3 complex it spontaneously protonated in the presence of TFAH. All number are in eV. | ||
However, reduction of the complex followed by this protonation is now a more expensive process, 50 mV (−1.37 vs. −1.32 V) more negative compared to the first PCET potential. This is important, because depending on the applied potential, we could have only the two-proton mechanism [EC][EC] occurring. For a potential that can attain a −1.32 V reduction, but not a −1.37 V, one could claim that only the two-proton mechanism could occur.
Upon the second protonation, we now need a third proton for H2 production. Table 2 shows how the pKas for the NNi are significantly higher than for S and Ni. Thus, we need to assess how proton transfer would occur at either one of the NNi atoms. It turns out that, upon placing TFAH in double H-bonding interaction with the complex, proton transfer occurs spontaneously for all complexes when performing geometry optimization, without the need of a third reduction. From here, we should ask if we need a third electron. In principle, the two adjacent protons are in close distance for the reaction to take place. However, at the moment that two electrons are transferred to the protons for H2 formation, the complex will be left as NiLH+, meaning with one proton and charge +1. On the other hand, if a third reduction occurs, we will restore the first intermediate state of the complex in the catalytic cycle, i.e. after the first PCET. It turns out that the redox potentials of these complexes for the third reduction after the third protonation are too negative: −1.87 V, −1.94 V and −1.58 V for NiOCH3, NiSCH3 and NiCN, respectively. Since the catalytic potentials are all at ∼−1.3 V, we can discard the hypothesis of a third reduction.
The last step: H2 formation and release
In the last two sections, we saw that there are two possible mechanisms. Both have two adjacent N atoms protonated (Fig. 1d), meaning two protons in close proximity for the formation of H2. The main difference is the extra protonation of the complex, which leads to a difference in charge. Additionally, the TFA− is still bound by two H-bonds. The results shown above suggest both mechanisms can occur concomitantly. We performed a potential energy surface (PES) scan for the two protons at different distances (see Methodology section and Tables S1–S6†), starting from a larger distance from that of equilibrium in the complex (2.35 Å) to the bond length of H2 (0.75 Å). During the scan, we allowed the remaining atoms to relax and the resulting surface is displayed in Fig. 5. Between 2.35 Å and 1.20 Å, no noticeable change is seen in the interaction between the two protons, the complex and TFA−. As the distance gets shorter, the distance between TFA− and the complex starts increasing, as the proton bound at Nd detaches from the complex and starts binding to its adjacent proton. This is where we start seeing differences between the complexes. In both mechanisms, NiCN tends to dissociate at a larger distance. Particularly for the three-proton case, the dissociated proton stays at very close distances between TFA− and the bound proton (∼1.10 Å for both). This could be the reason for the resulting high energy intermediate observed in Fig. 5. As for the other two complexes, the proton behaviour remains similar. Between the highest energy point, at ∼1.00 Å, and the product state, there is an abrupt drop in energy. This is due to the fact that H2 is close to formation, and it dissociates from the complex, together with TFA−. Realistically, this surface would be smoother, as formation of H2 and its dissociation from the complex would occur concomitantly. Nevertheless, the approach applied here is a computationally affordable method that, as we shall show below, suffices to describe the main differences between the complexes in kinetics for the formation of H2. Our results show activation barriers in the range of 55–66 kcal mol−1 for all complexes. These are very high barriers that would yield slow reaction rates. Nevertheless, such barriers are similarly seen in other intramolecular proton transfer processes.26–28 In those cases, tunnelling is paramount, and could be assessed from the PES using the semi-classical WKB approximation. Details of this approach can be found in the Methodology section and ref. 28. | ||
| Fig. 5 Potential energy surface for H–H distances for the two-proton, two-electron (top) and three-proton, two electron (bottom) mechanisms. The three-proton mechanism shows the presence of high-energy intermediates for two of the complexes, associated with one proton between TFA− and the bound second proton. See Fig. S4–S6† for representations of the highest energy states. | ||
We calculated the zero-point vibrational energy (ZPVE) differences associated with the ground and the highest energy states from harmonic analysis. This will give the energy at which the protons will attempt to tunnel through the barrier.28 We also obtained the frequencies of vibration for the two protons, associated with the mode that would bring them together by fitting a parabola to the PES for H–H distances near equilibrium (1.9–2.35 Å). Those frequencies will tell us with which frequency tunnelling will be attempted. Finally, the probability of tunnelling is calculated from the WKB approximation, and the kinetic rates are obtained as a product between this probability and the calculated frequency of vibration between the two protons.
Results are summarized in Table 3. We clearly see that the two-proton, two-electron mechanism is the fastest one. Thus, the real limiting step would be the H2 production for the three-proton, two-electron mechanism. In this case, we see the qualitative agreement between the calculated rates, and kinetic experiments. The underestimation of rates is expected from the WKB approximation.28 Still, we capture the difference of about one order of magnitude between NiSCH3 and NiCN. Our results show that there is no correlation between activation barriers and the catalytic rates. Rather, it seems to be an interplay between all the parameters involved and the shape of the barrier.
| Complex | ΔE‡ (kcal mol−1) | ZPVE (kcal mol−1) | ν(H2) (cm−1) | k(H2) (s−1) | TOFmax (s−1)17,19 |
|---|---|---|---|---|---|
| Two-proton, two-electron mechanism | |||||
| NiOCH3 | 63.8 | 4.23 | 2356.4 | 183.2 | 89.7 |
| NiSCH3 | 66.5 | 4.19 | 2388.7 | 110.1 | 115.9 |
| NiCN | 55.1 | 3.48 | 2368.4 | 115.9 | 10.2 |
|
|||||
| Three-proton, two-electron mechanism | |||||
| NiOCH3 | 55.8 | 3.30 | 2341.2 | 10.8 | 89.7 |
| NiSCH3 | 55.5 | 4.94 | 2351.5 | 22.0 | 115.9 |
| NiCN | 49.2 | 3.65 | 2445.1 | 2.8 | 10.2 |
While NiCN possesses a much lower barrier, it has a broader barrier, particularly due to a high-energy intermediate state, involving a proton in between TFA and the second bound proton prior to product release (Fig. 5 and S4–S6†). A similar intermediate is also observed for NiSCH3, but after the highest energy state, and associated only with a very narrow interval of H–H distance. Due to the nature of tunnelling being exponential with the distance,28 this results in a clear distinction between the reaction rates.
Conclusions
The objective of this work was to figure out how catalysis takes place in three related thiosemicarbazone Ni complexes. We analyzed which catalytic mechanisms would be compatible with experimental observations. Our results show two possible mechanisms, one involving two protons and two electrons, and other with three protons and two electrons. The reactivity occurs at two adjacent N atoms close to the metal center for both pathways, and can happen interchangeably. We saw the importance of including TFA in our calculations to accurately account for the experimentally observed catalytic overpotentials. Our results show that such overpotential corresponds to the first reduction of the complex with a coordinating acid to one of the Nd. The reduction potential is stabilized thanks to a PCET process. From there, the second protonation could occur in two sites: the NNi adjacent to the first protonated site, or the second unprotonated Nd. If the second protonated site is the NNi, the mechanism of H2 formation would occur via tunneling of the two protons. Else, a third proton would have to come into play, being transferred to either NNi. From there, we would also observe tunneling, albeit one order of magnitude slower than for the former case. Since there is nothing preventing both mechanisms to be happening together, we can claim that the rate-limiting step in the catalytic cycle of these catalysts is the tunneling of the protons on the three-proton pathway. Still, our catalysts would be working with two mechanisms at the same time.One might argue that studying these complexes with a different acid, even those with a similar structure, such as acetate, could give us the information we need to distinguish between the two pathways. At the same time, nothing prevents the mechanism from changing for different proton sources. In the end, the second half of the cycle has a smaller potential requirement than the first one. This means that any attempt of improving the overpotential requirements of the complex could initially focus in the first half of the cycle. As for the catalytic turnover rate, we essentially want to reduce tunnelling distances without touching the thiosemicarbazone structure. For instance, modifying the complex to increase its ZPVE would be a way to go. This has to go with tandem with no broadening of the activation barrier, which occurred with NiCN. These are subjects worth exploring not only for these complexes, but for any intramolecular proton transfer reaction.
Methodology section
DFT calculations
The choice of methodology was based on our previous study.23 All calculations were performed with ORCA 4.1.2.29,30 We used BP86, with def2-TZVP as the basis set.27–34 We used ‘Grid4’ and ‘TightSCF’ as our integration and convergence criteria, respectively, following ORCA notation. Solvation effects for DMF were included via CPCM.35 Free energy differences were extracted from numerical frequencies calculations. Since experimental values are reported with respect to the ferrocene electrode in DMF, we need to shift our calculated absolute potentials. We calculated the Gibbs free energy difference for the ferrocene reduction in DMF, obtaining ΔG(Fc0/+) = 4.87 eV. Different oxidation states are described as neutral and singlet for the initial state, doublet after the first reduction, and again singlet after the second reduction. All chemical structure images were generated using Chemcraft.36Tunneling calculations
Tunnelling was considered using the WKB approximation, as shown in ref. 28. The probability of tunnelling is given bywhere a and b are the initial and final H–H distances for the protons to tunnel from one well to another of the PES. The intervals of integration were determined based on the calculated zero-point vibration energy difference between the ground and highest-energy states. Here, we do not say transition state, as the highest-energy state possessed two imaginary frequencies. However, both frequencies are associated with the proton vibrations, as well as with the movement of TFA. V is the potential energy, and E the ground state energy, which includes ZPVE. Lastly, mp is the mass of the proton, and notice that we are considering twice the mass, since both protons are attempting tunnelling through the barrier at once.

The potential energy surfaces are scanned with 33 points (intervals of 0.05 Å between points). The PES is obtained using a cubic spline, and the integral is solved numerically using the Fortran library QUADPACK, as implemented in the SciPy library.
Conflicts of interest
There are no conflicts to declare.Acknowledgements
The authors gratefully acknowledge financial support of this work by the ANR (ANR-19-CE05_0030_01).Notes and references
- J. A. Turner, Science, 2004, 305, 972–974 CrossRef CAS.
- P. P. Edwards, V. L. Kuznetsov, W. I. F. David and N. P. Brandon, Energy Policy, 2008, 36, 4356–4362 CrossRef.
- O. T. Holton and J. W. Stevenson, Platinum Met. Rev., 2013, 57, 259–271 CrossRef.
- J. C. Fontecilla-Camps, A. Volbeda, C. Cavazza and Y. Nicolet, Chem. Rev., 2007, 107, 4273–4303 CrossRef CAS.
- W. Lubitz, H. Ogata, O. Rudiger and E. Reijerse, Chem. Rev., 2014, 114, 4081–4148 CrossRef CAS.
- K. A. Vincent, A. Parkin and F. A. Armstrong, Chem. Rev., 2007, 107, 4366–4413 CrossRef CAS.
- M. L. Helm, M. P. Stewart, R. Morris Bullock, M. Rakowski DuBois and D. L. DuBois, Science, 2011, 333, 863 CrossRef CAS.
- M. Y. Darensbourg, E. J. Lyon and J. J. Smee, Coord. Chem. Rev., 2000, 206, 533–561 CrossRef.
- T. B. Rauchfuss, Acc. Chem. Res., 2015, 48, 2107–2116 CrossRef CAS.
- Z. Li, Y. Ohki and K. Tatsumi, J. Am. Chem. Soc., 2005, 127, 8950–8951 CrossRef CAS.
- K. Weber, T. Kramer, H. S. Shafaat, T. Weyhermuller, E. Bill, M. van Gastel, F. Neese and W. Lubitz, J. Am. Chem. Soc., 2011, 141, 472–481 Search PubMed.
- D. Brazzolotto, M. Gennari, N. Queyriaux, T. R. Simmons, J. Pocault, S. Demeshko, F. Meyer, M. Orio, V. Artero and C. Duboc, Nat. Chem., 2016, 8, 1054–1060 CrossRef CAS.
- H. I. Karunadasa, C. J. Chang and J. R. Long, Nature, 2010, 464, 1329–1333 CrossRef CAS.
- M. Ravazet, V. Artero and M. Fontecave, Inorg. Chem., 2005, 44, 4786–4795 CrossRef.
- P. Zhang, M. Wang, Y. Yang, T. Yao and L. Sun, Angew. Chem., 2014, 53, 13803–13807 CrossRef CAS.
- E. J. Thompson and L. A. Berben, Angew. Chem., 2015, 54, 11642–11646 CrossRef CAS.
- X. Jing, P. Wu, X. Liu, L. Yang, C. He and C. Duan, New J. Chem., 2015, 39, 1051 RSC.
- W. R. McNamara, et al., Dalton Trans., 2015, 44, 14265 RSC.
- A. Z. Haddad, B. D. Garabato, P. M. Kozlowski, R. M. Buchanan and C. A. Grapperhaus, J. Am. Chem. Soc., 2016, 138, 7844 CrossRef CAS.
- A. Z. Haddad, S. P. Cronin, M. S. Mashuta, R. M. Buchanan and C. A. Grapperhaus, Inorg. Chem., 2017, 56, 11254 CrossRef CAS.
- T. Straistari, J. Fize, S. Shova, M. Réglier, V. Artero and M. Orio, ChemCatChem, 2017, 9, 2262 CrossRef CAS.
- T. Straistari, R. Hardré, J. Fize, S. Shova, M. Réglier, V. Artero and M. Orio, Chem.–Eur. J., 2018, 24, 8779 CrossRef CAS.
- M. Papadakis, A. Barrozo, T. Straistari, N. Queyriaux, A. Putri, J. Fize, M. Giorgi, M. Réglier, J. Massin, R. Hardré and M. Orio, Dalton Trans., 2020, 49, 5064–5073 RSC.
- R. Jain, A. A. Mamun, R. M. Buchanan, P. M. Kozlowski and C. A. Grapperhaus, Inorg. Chem., 2018, 57, 13486–13493 CrossRef CAS.
- G. C. Tok, A. T. S. Freiberg, H. A. Gasteiger and C. R. Hess, ChemCatChem, 2019, 11, 3973 CrossRef CAS.
- P. R. Schreiner, H. P. Reisenauer, D. Ley, D. Gerbig, C.-H. Wu and W. D. Allen, Science, 2011, 332, 1300–1303 CrossRef CAS.
- M. Schäfer, K. Peckelsen, M. Paul, J. Martens, J. Oomens, G. Berden, A. Berkessel and A. J. H. M. Meijer, J. Am. Chem. Soc., 2017, 139, 5779–5786 CrossRef.
- H. Quanz and P. R. Schreiner, J. Comput. Chem., 2019, 40, 543–547 CrossRef CAS.
- F. Neese, Wiley Interdiscip. Rev.: Comput. Mol. Sci., 2012, 2, 73–78 CAS.
- F. Neese, Wiley Interdiscip. Rev.: Comput. Mol. Sci., 2018, 8, e1327 Search PubMed.
- J. P. Perdew, Phys. Rev. B: Condens. Matter Mater. Phys., 1986, 33, 8822–8824 CrossRef.
- J. P. Perdew, Phys. Rev. B: Condens. Matter Mater. Phys., 1986, 34, 7406 CrossRef.
- A. D. Becke, Phys. Rev. A: At., Mol., Opt. Phys., 1988, 38, 3098–3100 CrossRef CAS.
- A. Schaefer, C. Huber and R. Ahlrichs, J. Chem. Phys., 1994, 100, 5829–5835 CrossRef CAS.
- V. Barone and M. Cossi, J. Phys. Chem. A, 1998, 102(11), 1995–2001 CrossRef CAS.
- Chemcraft – Graphical software for visualization of quantum chemistry computations, https://www.chemcraftprog.com Search PubMed.
Footnote |
| † Electronic supplementary information (ESI) available. See DOI: 10.1039/d0ra10212a |
| This journal is © The Royal Society of Chemistry 2021 |