 Open Access Article
An Amberlite IRA-400 Cl− ion-exchange resin modified with Prosopis juliflora seeds as an efficient Pb2+ adsorbent: adsorption, kinetics, thermodynamics, and computational modeling studies by density functional theory†
Sivaprakasam Anbazhagan *a,
Venugopal Thiruvengadam*a and
Anandhakumar Sukerib
aDepartment of Chemistry, Govt. College of Engineering, Salem-636011, Tamil Nadu, India. E-mail: venugopalt@gcesalem.edu.in; greenchemistry2020@gmail.com
bSão Carlos Institute of Physics, University of São Paulo, Av. Trabalhador São-Carlense, 400 – Parque Arnold Schimidt, PO Box 369, São Carlos, CEP-13566-590, São Paulo, Brazil
First published on 22nd January 2021
Abstract
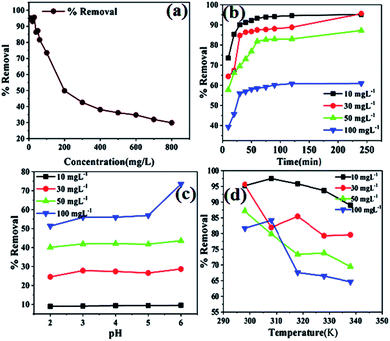
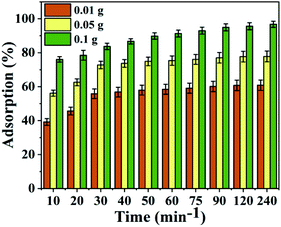
A Prosopis juliflora-seed-modified Amberlite IRA-400 Cl− ion-exchange resin (hereafter denoted as SMA resin) is used for the removal of Pb2+ from wastewater. SEM, EDX, FT-IR, BET, XRD, and XPS analyses were used to characterize the SMA resin. Parameters such as Pb2+ concentration, pH, temperature, and time are optimized. The obtained results show that the SMA resin has high efficiency for the removal of Pb2+ (73.45%) at a concentration of 100 mg L−1 and a dosage of 0.01 g at pH 6. Thermodynamic studies indicate that the adsorption was spontaneous with negative ΔH° and ΔS° values at all temperatures; pseudo-second-order kinetics and the Langmuir adsorption isotherm provided the best fit (qmax = 106 mg g−1 and R2 = 0.99) from 298 to 338 K. In addition, a diffusion-controlled mechanism at 298 K was observed from intra-particle studies. A desorption and recovery process has been applied successfully to the SMA adsorbent. The obtained results showed desorption of 90.7% at pH 2.5 with 86.3% recovery over six cycles. Furthermore, the DFT results suggest that all the functional groups of the SMA resin possibly bind with Pb2+ and, of these, the –C![[double bond, length as m-dash]](https://www.rsc.org/images/entities/char_e001.gif) O group shows the highest binding energy towards Pb2+. Moreover, the high-efficiency removal of Pb2+ from synthetic wastewater using the proposed SMA resin was demonstrated to show the real-life application potential.
O group shows the highest binding energy towards Pb2+. Moreover, the high-efficiency removal of Pb2+ from synthetic wastewater using the proposed SMA resin was demonstrated to show the real-life application potential.
1. Introduction
Environmental pollution, in particular water pollution, is one of the biggest problems worldwide and it causes economic and physical damage on an everyday basis. It has been an issue of continuously increasing concern that needs to be taken care of.1 Water pollution occurs mainly when people overload the water environment with waste. It is defined as the contamination of streams, lakes, underground water, bays, and oceans with substances that are harmful to living things.2 Heavy metals such as lead, mercury, copper, cadmium, zinc, nickel, and chromium are the most common pollutants found in industrial effluent. Even at low concentrations, these metals can be toxic to organisms, including humans.3 Lead is a naturally occurring metal that is found in rocks, soil, water, and air. Lead, a toxic pollutant of importance, enters the environment from various anthropogenic sources, as well as via natural geochemical processes. It can build up in the food chain and does not easily undergo biological degradation.4 Lead as a poisonous metal can cause severe health problems in humans. Lead poisoning is commonly a result of the ingestion of food or water that has been contaminated with lead, or it may be caused by the accidental ingestion of contaminated soil, dust, or lead-based paint.5 Long-term exposure to lead may cause weakness, high blood pressure, anemia, and brain and kidney damage in adults and children, it may lead to miscarriages in the case of pregnant women, and it can also affect aquatic and human systems.6 One of the main sources of lead contamination in water streams is the discharge of industrial wastewater related to mining, electroplating, metal processing, battery manufacturing, tanneries, textile production, fertilizers, pesticides, pigments, paints, and munitions.7,8 The main industrial sources of lead also include oil-refining industries and motor vehicles that use petrol. It enters the environment as a result of both natural processes and anthropogenic activities.9Therefore, the removal of lead is very important, and adsorption using activated carbon is a popular technology for treating industrial and domestic contaminated water. The utilization of plant seeds, seaweed, molds, yeasts, and other dead microbial biomass and agricultural waste materials as adsorbents has also been seen.10 For instance, the elimination of heavy metals using cherry kernels and cashew nut shells has been recently explored.11,12 Plant waste has been directly used as an adsorbent in adsorption studies, e.g., mustard husks,6 papaya wood,9 and saltbush leaves.13 Ion-exchange resins have played an exceptional role in metal recovery and separation, and they are widely used for pre-concentrating and removing heavy metal ions from wastewater.14–16 However, efficiency and selectivity are key issues in this research area. Hence, the surface modification of ion-exchange resins is essential to improve the selectivity towards metallic ions and to increase the efficiency; this is generally achieved via introducing active functional groups onto the surface of the ion-exchange resin/membrane via complexation. For instance, an anion-exchange resin surface modified with a thin anionic poly-electrolyte layer has been used for the separation of sulfate and nitrate ions.17 Methylene diphosphonate and ethylene diphosphonate were used for the separation of Ni2+, Fe3+, Cd2+, and Zn2+ ions.18 Resins with phosphonomethyl crosslinked with polyethyleneimine (PEI) were used for uranium recovery from seawater.19 From this angle, here an attempt has been made to use an anion-exchange resin, i.e., Amberlite IRA-400 (Cl form) for the removal of Pb2+ from seawater. However, we did not use such a resin to directly remove the metal ions (positively charged) from solution via an ion-exchange reaction. Instead, the Amberlite IRA-400 Cl− ion-exchange resin was modified with Prosopis juliflora seeds and then used as an efficient Pb2+ adsorbent, because the resultant modified resin surface contains new functional groups (e.g., C–OH, –COOH, C![[double bond, length as m-dash]](https://www.rsc.org/images/entities/char_e001.gif) C, etc.) that can increase the adsorption capacity for Pb2+ due to complexation with the corresponding oxygen-containing functional groups. As a result, the efficiency of Pb2+ removal can be enhanced with high selectivity.
C, etc.) that can increase the adsorption capacity for Pb2+ due to complexation with the corresponding oxygen-containing functional groups. As a result, the efficiency of Pb2+ removal can be enhanced with high selectivity.
Hence, this study focuses on investigating the adsorption performance of a PJ-seed adsorbent supported on an Amberlite IRA-400 Cl− ion-exchange resin for the removal of Pb2+ from synthetic contaminated water. Surface coverage and surface modification using activated carbon and the removal of toxic Pb2+ were carried out using surface-modified Amberlite (SMA). An SMA ion-exchange resin modified with PJ seeds has not been used as adsorbent so far to the best of our knowledge. Therefore, the first attempt has been made in this study.
2. Experimental section
2.1 Materials
Fresh Prosopis juliflora seedpods were collected from areas near the city of Salem (Tamil Nadu, India), and they were air-dried for five days in a dark place without exposure to sunlight. The Prosopis juliflora seeds were then washed thoroughly, dried in a dark place for two more days, and then crushed to a fine size. The seeds were then powdered and sieved. Amberlite IRA-400 Cl− (Table 1) and H2SO4 were both purchased from Sigma-Aldrich and used as received without further purification. Milli-Q water (18 Ω cm resistivity) was used for all the required solution preparations unless otherwise stated.| Matrix | Polystyrene divinylbenzene |
| Functional group | Quaternary ammonium (NR3)+ |
| Ionic state | Cl− form |
| Ion exchange capacity | 2.6–3 eq. kg−1 of dry mass |
| Size | 0.3–0.9 mm |
| Temperature | 75 °C (max) |
2.2 Instruments
Scanning electron microscopy coupled with energy-dispersive X-ray spectroscopy (SEM-EDS, TESCAN BRNO 62300), Fourier-transform infrared spectroscopy (FT-IR, PerkinElmer spectrophotometer), X-ray diffraction (XRD, GE Inspection Technologies, Germany), Brunauer–Emmett–Teller (BET, Quantachrome Corporation), and X-ray photoelectron spectroscopy (XPS, Thermo Fisher) studies are used in this study to find the various physical properties of the adsorbent.2.3 Preparation of the adsorbent
10 g of a sieved sample of Prosopis juliflora seeds and 20 g of Amberlite-400 (Cl) were soaked in 80 mL of sulfuric acid (at a ratio of 1![[thin space (1/6-em)]](https://www.rsc.org/images/entities/char_2009.gif) :
:![[thin space (1/6-em)]](https://www.rsc.org/images/entities/char_2009.gif) 2) for 24 h under constant stirring in a fume hood. The liquid portion was decanted carefully, and the precipitated solid was taken to a ceramic hood and heated to 160 °C in an air oven for 24 h. The temperature of the oven was increased by 5 °C every 15 min. The resulting mass was then thoroughly washed with water until the filtrate pH coincided with the pH of the distilled water used. After that, the surface-modified resin was dried at 105 °C for 1 h and then stored in a cool dry place (desiccator) for further analysis.
2) for 24 h under constant stirring in a fume hood. The liquid portion was decanted carefully, and the precipitated solid was taken to a ceramic hood and heated to 160 °C in an air oven for 24 h. The temperature of the oven was increased by 5 °C every 15 min. The resulting mass was then thoroughly washed with water until the filtrate pH coincided with the pH of the distilled water used. After that, the surface-modified resin was dried at 105 °C for 1 h and then stored in a cool dry place (desiccator) for further analysis.
2.4 Preparation of lead standard solution
The lead stock solution was prepared via dissolving 1.5984 g of Pb(NO3)2·6H2O in one liter of distilled water to obtain a 1000 mg L−1 concentration of Pb2+ ions. From the stock solution, 100 mg L−1 working solutions were used to perform the experiments. Fresh dilutions were used for each experiment if required. pH adjustments were carried out using either diluted HCl or NaOH.2.5 Batch experiments
Batch studies were performed in a closed plastic container (500 mL capacity) with 100 mL of lead solutions of different concentrations, ranging from 10 mg L−1 to 200 mg L−1, and adsorbent dosages from 0.01 to 0.1 g. The constant shaking of the solution was done using an orbital shaker at a rate of 150 rpm. The temperature throughout the experiment was maintained at a constant value. The samples were shaken for a specified time, and then the supernatant liquid was filtered and used for analysis. The pH of the solutions was also adjusted with 1 N HCl and 1 N NaOH.The removal efficiency of the SMA resin was calculated as follows:
 | (1) |
2.6 Analysis of lead after batch studies
Lead was analyzed using an atomic adsorption spectrophotometer (AAS) (Systronic, SL 163) with a lead hollow cathode lamp. Readings were taken 10 times and the average value was used for calculations. Standards were tested after every five samples to verify the accuracy of the instrument.2.7 The desorption and regeneration of adsorbed Pb2+ ions
The desorption of Pb2+-loaded SMA resin was carried out from pH 2 to 7, which was achieved by utilizing 1.0 M HCl and 1.0 M NaOH, after the saturation of the SMA resin with 100 mg L−1 Pb2+ ions. The SMA resin was washed several times with deionized distilled water to remove any excess Pb2+ ions. It was then treated with 100 mL of 0.1 M HCl and equilibrated by shaking for 3 h in an orbital shaker at 250 rpm and then filtered. The collected supernatant was used to analyze the metal ions. The desorption percentage was calculated using the given formula:
 | (2) |
3. Results and discussion
3.1 Characterization of the SMA resin and Pb2+ adsorption via SEM and EDX analysis
SEM images at different magnifications of the SMA resin before (Fig. 1a and b) and after (Fig. 1c) the adsorption of Pb2+ are shown in Fig. 1. From the SEM images, the particle size, surface area, and minimum pore size of the adsorbent were investigated. In general, the resin has a surface area that is minimal compared with other adsorbents.21 The raw material of PJ seeds was used to modify the surface of the Amberlite resin, resulting in an increase in the surface area and pore size of the resin. These results can be concluded based on BET analysis. Furthermore, the EDX spectrum (Fig. 1d) clearly shows the presence of lead after the adsorption of Pb2+ onto the adsorbent.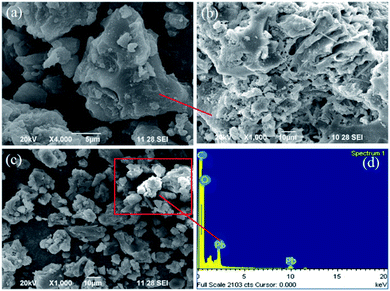 | ||
| Fig. 1 SEM images of the SMA ion-exchange resin before (a and b) and after (c) Pb2+ adsorption. The EDX spectrum of the SMA resin after Pb2+ adsorption (d). | ||
3.2 FT-IR, XRD, point of zero charge (pHpzc), and textural analysis of the SMA resin
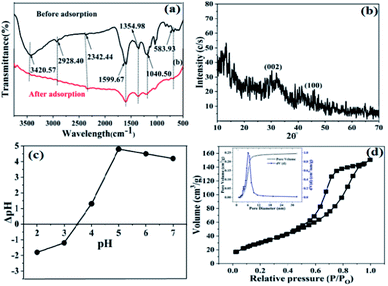
FT-IR spectra before and after the adsorption of Pb2+ onto the SMA resin are shown in Fig. 2a, with the corresponding adsorption band data given in Table S1.† The functional groups before the adsorption of SMA resin lead to corresponding adsorption bands at 3947.36 cm−1, assigned to –NH– groups, 3420.57 cm−1, assigned to –OH groups, 2928.57 cm−1, assigned to C–H stretching groups, and 1599.67 cm−1, 1354.98 cm−1, 1040.50 cm−1, and 583.93 cm−1, assigned to C![[double bond, length as m-dash]](https://www.rsc.org/images/entities/char_e001.gif) O, S
O, S![[double bond, length as m-dash]](https://www.rsc.org/images/entities/char_e001.gif) O, C–X, and –C–C– functional groups, respectively.22 Fig. 2a shows the SMA resin FT-IR spectrum after the adsorption of Pb2+ under the following reaction conditions: temperature, 350 °C; pH, 4; concentration, 100 mg L−1; and time, 240 min. It shows some adsorption bands after the adsorption of Pb2+ onto the SMA resin. It can be seen that Pb2+ adsorption resulted in several noticeable changes (to the peaks from 1700 to 1000 cm−1). These changes (at 1610, 1358, 1213, and 1030 cm−1) are owing to the attachment of Pb2+ ions to the surface of the adsorbent. Moreover, the amide (–NH–) peaks were widened with a reduction in intensity, shifting from 3420 to 3725.12 cm−1 upon the adsorption of Pb2+ ions onto the SMA resin. These shifts revealed that interactions between the adsorbent and adsorbate (SMA and Pb2+) take place at binding or active sites on the surface of the SMA resin. Additionally, the changes suggested that complexation between Pb2+ and the active functional groups can also participate in the Pb2+ adsorption process.23
O, C–X, and –C–C– functional groups, respectively.22 Fig. 2a shows the SMA resin FT-IR spectrum after the adsorption of Pb2+ under the following reaction conditions: temperature, 350 °C; pH, 4; concentration, 100 mg L−1; and time, 240 min. It shows some adsorption bands after the adsorption of Pb2+ onto the SMA resin. It can be seen that Pb2+ adsorption resulted in several noticeable changes (to the peaks from 1700 to 1000 cm−1). These changes (at 1610, 1358, 1213, and 1030 cm−1) are owing to the attachment of Pb2+ ions to the surface of the adsorbent. Moreover, the amide (–NH–) peaks were widened with a reduction in intensity, shifting from 3420 to 3725.12 cm−1 upon the adsorption of Pb2+ ions onto the SMA resin. These shifts revealed that interactions between the adsorbent and adsorbate (SMA and Pb2+) take place at binding or active sites on the surface of the SMA resin. Additionally, the changes suggested that complexation between Pb2+ and the active functional groups can also participate in the Pb2+ adsorption process.23
The XRD spectrum of the SMA resin (Fig. 2b) showed a broad diffraction peak at 2θ values between 28 and 29°, corresponding to the 002 diffraction planes of graphite.24 No obvious diffraction pattern was noticed for the SMA resin, indicating that it was not entirely crystalline but partly amorphous. Further, the amorphous nature of the SMA resin was confirmed from the presence of broad peaks at around 28° and 44°, which can be attributed to the presence of amorphous carbon.25 Since neither the SMA resin nor Prosopis juliflora-seed activated carbon are crystalline, it is not surprising that SMA does not show any crystalline nature.
Further, the solid addition method was used to investigate the pHpzc value of the adsorbent. 50 mL solutions of 0.01 M NaNO3 with different pH values from 2 to 12 were prepared and transferred to 100 mL beakers. Then, 0.125 g of the SMA resin was added to every beaker and they were placed for 12 h at room temperature without shaking to equilibrate. The final pH value for each adsorbent mixed solution was measured. The place where there is zero difference between the initial and final pH gives pHpzc (Fig. 2c). This method was repeated 2 to 3 times using 0.01 M NaNO3 solution. The point of zero charge (pHpzc) value was used to find the surface charge (ionic state) and active functional groups of the adsorbent. The SMA resin adsorbent pH was neutral. The pHpzc curve reveals that the SMA resin has a pHpzc value of 3.5.
The BET equation was used to calculate the surface area and mean pore size and volume using the BJH (Barrett–Joyner–Halenda) method via N2 adsorption/desorption at 77 K using a Quantachrome instrument. The shape obtained upon plotting the relative pressure versus the volume of the gas adsorbed indicates that SMA shows a type-IV adsorption isotherm as per IUPAC classifications. As can be seen in Fig. 2d, at a high relative pressure the hysteresis loop was wider, which implies that SMA has a mixed mesoporous and microporous structure. The total surface area of the SMA resin was found to be 638 m2 g−1 and the existence of large mesopores compared to micropores suggests the better adsorption capacity of SMA. A higher pore size distribution in SMA indicates that the total pore volume available for Pb2+ was higher, resulting in a higher adsorption capacity.
3.3 X-ray photoelectron spectroscopy analysis
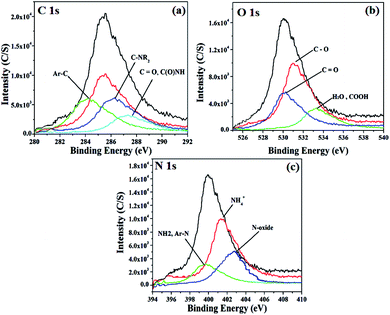
Fig. 3a–c shows the XPS investigation of the SMA resin. SMA shows three peaks in the XPS spectrum, corresponding to C 1s, O 1s, and N 1s peaks. The C 1s peak is a symmetrical peak in the range of ∼284 to ∼288 eV. This chemical shift toward a higher binding energy indicates that there are some carbon-based functional groups present on the SMA resin surface. A major aromatic carbon peak from C–C and C–H of graphitic origin is seen at around 284 eV (Fig. 3a). The peaks occurring at ∼286.2 eV and ∼287.3 eV can be attributed to the presence of carbon functional groups, such as C![[double bond, length as m-dash]](https://www.rsc.org/images/entities/char_e001.gif) O ether/hydroxyl, C
O ether/hydroxyl, C![[double bond, length as m-dash]](https://www.rsc.org/images/entities/char_e001.gif) N, and COOH.26 The O 1s (Fig. 3b) spectrum of SMA indicates the presence of C
N, and COOH.26 The O 1s (Fig. 3b) spectrum of SMA indicates the presence of C![[double bond, length as m-dash]](https://www.rsc.org/images/entities/char_e001.gif) O groups with a binding energy of around 531.1 eV, which may be due to ketone, aldehyde, and lactose groups. The peak at ∼533.3 eV indicates the presence of C–O groups from esters, amides, or any other carboxylic acid derivatives.27 The N 1s spectrum shows the presence of quaternary ammonium salts at around 403.0 eV due to Amberlite resin.28 The N 1s spectrum (Fig. 3c) thus indicates that a fraction of the Amberlite resin functional groups were present on the surface of SMA.
O groups with a binding energy of around 531.1 eV, which may be due to ketone, aldehyde, and lactose groups. The peak at ∼533.3 eV indicates the presence of C–O groups from esters, amides, or any other carboxylic acid derivatives.27 The N 1s spectrum shows the presence of quaternary ammonium salts at around 403.0 eV due to Amberlite resin.28 The N 1s spectrum (Fig. 3c) thus indicates that a fraction of the Amberlite resin functional groups were present on the surface of SMA.
3.4 Optimization for the removal of Pb2+
3.5 Adsorption isotherm studies
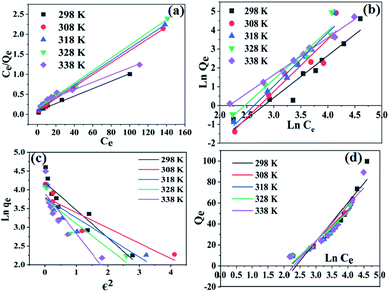
Adsorption isotherms are useful for describing the distribution of the adsorbate when equilibrium is reached between the adsorbent and solution. Several isotherm models, like Langmuir, Freundlich, Dubinin–Radushkevich (DR), Temkin, and Koble–Corrigan (KC), have been reported in the literature for studying the equilibrium process.32 Among these, suitable isotherm models can be found based on the correlation coefficient (R2) values.
 | (3) |
 | (4) |
![[thin space (1/6-em)]](https://www.rsc.org/images/entities/char_2009.gif) qe vs. ln
qe vs. ln![[thin space (1/6-em)]](https://www.rsc.org/images/entities/char_2009.gif) Ce were used to find Kf and n, as shown in Fig. 6b, and the values are given in Table S2.† It was found that the values of R2 at all temperatures were lower than the Langmuir isotherm model R2 values. The Kf values were found to be low, indicating that the heterogeneity of adsorption was negligible, and there was no definite trend in the changes of the Kf values with an increase in temperature. Also, the value of n indicates that the heterogeneity of the adsorbent was low. The values of n (<1) and the slopes of the adsorption isotherms (>1) show that there was cooperative adsorption between Pb2+ and the SMA resin.
Ce were used to find Kf and n, as shown in Fig. 6b, and the values are given in Table S2.† It was found that the values of R2 at all temperatures were lower than the Langmuir isotherm model R2 values. The Kf values were found to be low, indicating that the heterogeneity of adsorption was negligible, and there was no definite trend in the changes of the Kf values with an increase in temperature. Also, the value of n indicates that the heterogeneity of the adsorbent was low. The values of n (<1) and the slopes of the adsorption isotherms (>1) show that there was cooperative adsorption between Pb2+ and the SMA resin.
 | (5) |
 | (6) |
The values of A, B, and n were determined from the slopes and intercepts and are given in Table S2.† From Table S2,† it can be inferred that the Koble–Corrigan isotherm at 333 K showed a poor R2 value, confirming the fact that at high temperature the mechanism of the adsorption is different from that at low temperature. The value of A was found to decrease with an increase in temperature, except at 333 K, indicating that the physical adsorption process was spontaneous at these temperatures.
| qe = qse−Bε2 | (7) |
 | (8) |
 | (9) |
Plots of ln![[thin space (1/6-em)]](https://www.rsc.org/images/entities/char_2009.gif) qe vs. ε2 (Fig. 6c) were used to find the values of qs and E, and the values are presented in Table S2.† The R2 values for the plots were found to be smaller compared to the other models. The adsorption of Pb2+ ions onto the SMA resin did not follow the DR model. With an increase in temperature, there was no definite trend in E and qs. The value of E provides evidence of whether the adsorption process is chemical or physical in nature.38 When the value of E is less than 8 kJ mol−1 then adsorption is predominantly physical, and when E is above 8 kJ mol−1 the adsorption is considered to be chemical in nature.39 From Table S2,† it can be seen that the value of E was very low up to 328 K, which indicates physical adsorption; but at 338 K, the value of E was found to be approximately 8 kJ mol−1, indicating that the adsorption mechanism was chemical in nature.40
qe vs. ε2 (Fig. 6c) were used to find the values of qs and E, and the values are presented in Table S2.† The R2 values for the plots were found to be smaller compared to the other models. The adsorption of Pb2+ ions onto the SMA resin did not follow the DR model. With an increase in temperature, there was no definite trend in E and qs. The value of E provides evidence of whether the adsorption process is chemical or physical in nature.38 When the value of E is less than 8 kJ mol−1 then adsorption is predominantly physical, and when E is above 8 kJ mol−1 the adsorption is considered to be chemical in nature.39 From Table S2,† it can be seen that the value of E was very low up to 328 K, which indicates physical adsorption; but at 338 K, the value of E was found to be approximately 8 kJ mol−1, indicating that the adsorption mechanism was chemical in nature.40
 | (10) |
Taking RT/b = K, the linear form of the equation is represented as:
qe = K![[thin space (1/6-em)]](https://www.rsc.org/images/entities/char_2009.gif) ln ln![[thin space (1/6-em)]](https://www.rsc.org/images/entities/char_2009.gif) A + K A + K![[thin space (1/6-em)]](https://www.rsc.org/images/entities/char_2009.gif) ln ln![[thin space (1/6-em)]](https://www.rsc.org/images/entities/char_2009.gif) Ce Ce
| (11) |
Plots of ln![[thin space (1/6-em)]](https://www.rsc.org/images/entities/char_2009.gif) Ce vs. qe (Fig. 6d) were used to find K and A. In the above equation, R is the universal gas constant, and b (kJ mol−1) and A (L g−1) are Temkin isotherm constants. b is related to the heat of adsorption between the resin and Pb2+ ions. Table S2† gives the values of the Temkin constants, and it can be inferred that the correlation of the experimental data with the Temkin model was poor within the studied temperature range (298 to 308 K).
Ce vs. qe (Fig. 6d) were used to find K and A. In the above equation, R is the universal gas constant, and b (kJ mol−1) and A (L g−1) are Temkin isotherm constants. b is related to the heat of adsorption between the resin and Pb2+ ions. Table S2† gives the values of the Temkin constants, and it can be inferred that the correlation of the experimental data with the Temkin model was poor within the studied temperature range (298 to 308 K).
3.6 Kinetic adsorption models
The kinetics of the adsorption of Pb2+ ions on the SMA resin were studied to find the rate of the reaction, the rate-limiting step, and the mechanism of the process. Kinetic modeling experiments are important for gaining insight into the interactions that occur between the adsorbate and adsorbent. In this study, pseudo-first-order, pseudo-second-order, and first-order models were considered to determine the mechanism of adsorption.41,42 For determining the kinetic parameters, 10 mL of 100 mg L−1 Pb2+-ion solution was shaken at 250 rpm with 0.01 g of the resin for different time intervals.
ln(qe − qt) = ln![[thin space (1/6-em)]](https://www.rsc.org/images/entities/char_2009.gif) qe − k1t qe − k1t
| (12) |
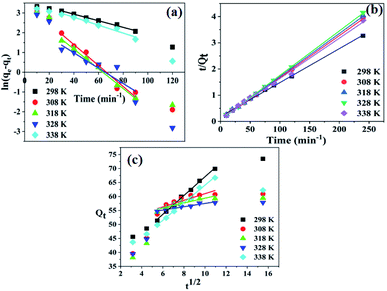
Linear plots of ln(qe − qt) vs. t at various temperatures are shown in Fig. 7a. The rate constant, qe, and R2 values for the above plots at various temperatures are given in Table S3.† From Table S3,† the R2 values at all temperature are found to be greater than 0.94, and the value decreases with an increase in temperature; however, qe does not show a regular decreasing or increasing trend. The value of qe was found to be highest at 338 K.
 | (13) |
The integrated form of the equation is given as:
 | (14) |
The linear form of the above equation can be represented as:
 | (15) |
Plots of t/qt vs. t at different temperatures are shown in Fig. 7b, and the intercepts and slopes of the plots are used to find the values of qe and k2, which are presented in Table S3.† It was found that the R2 values at all temperatures were above 0.99, indicating that the adsorption of Pb2+ ions onto the resin follows a pseudo-second-order reaction. From Table S3,† it can also be inferred that the Δq values were lower than the other kinetics models.
 | (16) |
Plots of 1/qt vs. 1/t (not shown) were used to calculate the values of qe and k1, and the values are given in Table S3.† The R2 values for the first-order kinetics model were found to be less than 0.7, indicating that this model had the worst fit for the adsorption of Pb2+ ions onto the resin.
 | (17) |
Plots of qt vs.  are given in Fig. 7c, and the Weber-and-Morris equation parameters are given in Table S4,† where I is the Weber-and-Morris constant, which is determined by the intercept, and kid is the intra-particle diffusion rate constant in mg g−1 min−1/2. The I and Kid values can be used to find the thickness of the boundary layer. If the value of I is high, subsequently, the boundary layer is considered to be thick and intra-particle diffusion is found to be more difficult.42,43 The R2 values in Table S4† indicate that, except at 298 K, the values of R2 are less than 0.75. Since the R2 values were less than 0.75, plots of qt vs.
  do not give straight lines and do not pass through the origin; therefore, the process can be considered to follow some other mechanism in addition to intra-particle diffusion. The data indicate that at a lower temperature (at 298 K), intra-particle diffusion was found to control the mechanism, whereas as the temperature increased, boundary layer accumulation seems to control the mechanism.
3.7 Thermodynamic studies
Thermodynamic parameters can give important insight into the adsorption process. A negative ΔG° value indicates that the adsorption process is spontaneous, and a highly negative value indicates that chemical adsorption is favorable.44 The equilibrium constant K is determined using the equation:
 | (18) |
ΔG°, the Gibbs free energy, was determined using the equation:
ΔG° = −RT![[thin space (1/6-em)]](https://www.rsc.org/images/entities/char_2009.gif) ln ln![[thin space (1/6-em)]](https://www.rsc.org/images/entities/char_2009.gif) Kc Kc
| (19) |
The entropy and enthalpy changes during the adsorption process are given by the equation:
| ΔG° = ΔH° − TΔS° | (20) |
Substituting the value from eqn (19) for ΔG° and rearranging,42,44 we get:
 | (21) |
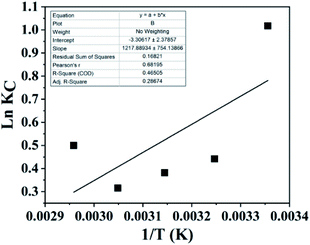
A van't Hoff plot of ln![[thin space (1/6-em)]](https://www.rsc.org/images/entities/char_2009.gif) Kc vs. 1/T (Fig. 8) was used to find ΔS° and ΔH° from the intercept and the slope, respectively, and the values are given in Table S4.† From Table S4,† it can be inferred that the ΔG° values were negative at all temperatures, indicating that the adsorption process can be considered as spontaneous. The low values of ΔG° indicate that the adsorption process was mostly physical in nature. With an increase in temperature, it was found that ΔG° decreases, indicating that the process becomes less spontaneous.45 However, at 333 K, the ΔG° value increases, indicating a change in the mechanism at high temperature. The ΔH° value of −10.13 kJ mol−1 indicates that the adsorption process was energetically exothermic and feasible. However, the value of ΔS° was found to be −24.45 J mol−1 K−1. The negative value of ΔS° indicates that the disorder decreases during the adsorption process. This trend in ΔS° can be explained via considering that during the adsorption process the functional group was bound to a lead ion and, hence, the rotational and vibrational energies were decreased due to this process and the resin obtained an ordered arrangement; hence, a decrease in entropy was seen.
Kc vs. 1/T (Fig. 8) was used to find ΔS° and ΔH° from the intercept and the slope, respectively, and the values are given in Table S4.† From Table S4,† it can be inferred that the ΔG° values were negative at all temperatures, indicating that the adsorption process can be considered as spontaneous. The low values of ΔG° indicate that the adsorption process was mostly physical in nature. With an increase in temperature, it was found that ΔG° decreases, indicating that the process becomes less spontaneous.45 However, at 333 K, the ΔG° value increases, indicating a change in the mechanism at high temperature. The ΔH° value of −10.13 kJ mol−1 indicates that the adsorption process was energetically exothermic and feasible. However, the value of ΔS° was found to be −24.45 J mol−1 K−1. The negative value of ΔS° indicates that the disorder decreases during the adsorption process. This trend in ΔS° can be explained via considering that during the adsorption process the functional group was bound to a lead ion and, hence, the rotational and vibrational energies were decreased due to this process and the resin obtained an ordered arrangement; hence, a decrease in entropy was seen.
3.8 Mechanism of adsorption/desorption
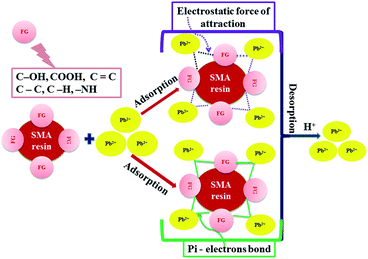
The mechanism of lead adsorption and desorption strongly depends upon the pH value of the solution on the adsorbent surface. Outlining the mechanism of any adsorption and desorption process is an essential part of understanding the methodology and explaining the physical appearance of an adsorbent; this is useful for finding out facts about a new adsorbent for future applications. A mechanism for the adsorption of Pb2+ ions by SMA can be explained based on the electrostatic force of attraction between the positively charged Pb2+ ions and the oppositely charged SMA, as shown in Fig. 9. This can be furthermore explained based on pHpzc. The pHpzc value of SMA was found to be 3.5. The point-of-zero-charge for an identified adsorbent surface is the pH at which that surface has a net neutral charge. The pHpzc value of the adsorbent demonstrates that the external surface of the adsorbent was positively charged at a pH level lower than 3.5 and negatively charged at a pH level above 3.5. The highest level of adsorption of Pb2+ ions on SMA occurs at pH 6, since this pH is higher than pHpzc; therefore, the surface of the adsorbent is negatively charged and the quantity of H3O+ ions is reduced. Hence, the positively charged Pb2+ ions are adsorbed onto the SMA surface through electrostatic forces of attraction. Furthermore, the SMA resin has a high surface area and also many binding or active sites, which promote complexation between Pb2+ and oxygen-containing active functional groups (such as C–OH and –COOH) or C![[double bond, length as m-dash]](https://www.rsc.org/images/entities/char_e001.gif) C (pi-electron) bonds.40 Moreover, the adsorption capacity of SMA is compared with other reported adsorbents in the literature (Table S6†), indicating that the maximum adsorption capacity of the SMA resin (106.5 mg g−1) for Pb2+ ions is favorable.
C (pi-electron) bonds.40 Moreover, the adsorption capacity of SMA is compared with other reported adsorbents in the literature (Table S6†), indicating that the maximum adsorption capacity of the SMA resin (106.5 mg g−1) for Pb2+ ions is favorable.
3.9 Desorption and reusability
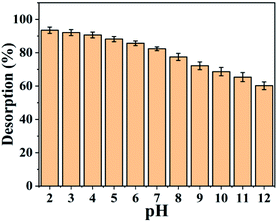
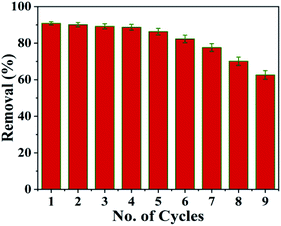
To make the adsorption process cheaper and more feasible, the recovery and reusability of the SMA resin prepared from PJ seeds were explored (Fig. 10). The results show that 90.7% recovery is obtained at pH 2.5; this is because the adsorbent surface is protonated by hydronium (H3O+) ions when in an acidic state, making the desorption of Pb2+ ions from the SMA surface conceivable. To confirm the reusability of the SMA adsorbent, adsorption–desorption cycles were carried out multiple times utilizing the same adsorbent.Fig. 11 shows the adsorption efficacy of SMA for Pb2+ ions over more than six progressive adsorption–desorption cycles. The obtained results revealed that the adsorption efficacy for Pb2+ ions diminished upon expanding the number of adsorption–desorption cycles, and toward the end of the sixth cycle, 86.3% adsorption efficacy was discovered for Pb2+ ions. The adsorbent was regenerated, but subsequent cycles showed lower removal percentages. The blocked pores of the SMA ion-exchange resin were effectively cleared by the desorbing agent. However, after completing the desorbing process, the SMA resin has an adsorption capacity that is comparatively lower than fresh SMA resin, owing to regeneration of Pb2+ ions from SMA. From this, SMA was seen to be a decent eco-friendly adsorbent and it could be successfully utilized for the removal of Pb2+ from water and wastewater.
3.10 DFT studies of the SMA ion-exchange resin
For computational calculations of the interactions of the SMA resin with Pb2+ ions, density functional theory (DFT) was selected due to its accuracy and unbiased computational competence.46 The DFT studies were carried out using Gaussian 9 software. The Becke, 3-parameter, Lee–Yang–Parr (B3LYP) method was used with Los Alamos National Laboratory 2 Double-Zeta (LANL2DZ) as a basis set. To determine the adsorption characteristics of the resin, a four-membered fused pyrene ring was chosen to represent the molecular structure of the SMA resin. The pyrene ring with different functional groups was taken as the base structure for the interaction of the functional groups with Pb2+. The functional groups that were considered in this work are –CHO, –C![[double bond, length as m-dash]](https://www.rsc.org/images/entities/char_e001.gif) O, –COOH, –SH, and an aromatic pi system. IR spectral results were considered for the selection of the functional groups based on the characterized absorption peaks. For Pb, the most common oxidation state of +2 in the singlet and triplet states (excited) was used to determine the energies of interaction between the ion and various functional groups. The binding energies (BEs) between the various functional groups and Pb2+ ions were calculated using the given formula:
O, –COOH, –SH, and an aromatic pi system. IR spectral results were considered for the selection of the functional groups based on the characterized absorption peaks. For Pb, the most common oxidation state of +2 in the singlet and triplet states (excited) was used to determine the energies of interaction between the ion and various functional groups. The binding energies (BEs) between the various functional groups and Pb2+ ions were calculated using the given formula:| BEPb(II)–pyr = E(pyr+functional group (Fg)) + E(Pb(II) in singlet or triplet state) − E(Pb(II) in singlet or triplet state—pyr+Fg) |
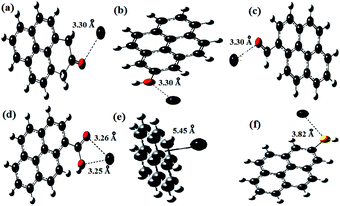
The results from the computational study of the adsorption of Pb2+ ions onto the resin are given in Table S5.† In Table S5,† the BEs of Pb2+ ions with various functional groups and the bond distances between the functional groups and the Pb2+ ions can be seen. The presence of functional groups and their interactions with Pb2+ ions were determined via FT-IR spectroscopy. It can be seen from the IR data in Table S1† that the functional group peaks were shifted due to interactions between the heteroatoms of the functional groups and Pb2+ ions. Fig. 12a–d shows the optimized configurations of Pb2+ ions when interacting with the functional groups present in SMA. The five functional groups, namely an aromatic pi system and carbaldehyde, –C![[double bond, length as m-dash]](https://www.rsc.org/images/entities/char_e001.gif) O, –COOH, and –SH groups, were confirmed based on IR studies. Therefore, these functional groups were used for DFT calculations, and the optimized structures of the pyrene ring system with a functional group interacting with the metal are shown in Fig. 12e and f. The results of DFT analysis showed that the bond distances between the Pb2+ ion and the O atoms of the carbaldehyde, –C
O, –COOH, and –SH groups, were confirmed based on IR studies. Therefore, these functional groups were used for DFT calculations, and the optimized structures of the pyrene ring system with a functional group interacting with the metal are shown in Fig. 12e and f. The results of DFT analysis showed that the bond distances between the Pb2+ ion and the O atoms of the carbaldehyde, –C![[double bond, length as m-dash]](https://www.rsc.org/images/entities/char_e001.gif) O, and –OH groups were fairly constant, with a bond length of 3.30 Å. The chelating nature of carboxylic acid shortens the bond length between O and Pb2+ for both C
O, and –OH groups were fairly constant, with a bond length of 3.30 Å. The chelating nature of carboxylic acid shortens the bond length between O and Pb2+ for both C![[double bond, length as m-dash]](https://www.rsc.org/images/entities/char_e001.gif) O and OH, but the resultant energies were found to be far lower compared with the other interactions (except for the SH and pi-interactions), suggesting that the chelating action of COOH provides less stabilization during the adsorption of Pb2+.
O and OH, but the resultant energies were found to be far lower compared with the other interactions (except for the SH and pi-interactions), suggesting that the chelating action of COOH provides less stabilization during the adsorption of Pb2+.
The BE values suggest that Pb2+ ions in the triplet state show a better adsorption capacity than the singlet state for all functional groups. The aromatic ring pi-interaction with Pb2+ ions shows the lowest BE, suggesting that the attraction of Pb2+ ions to the aromatic ring was weak. However, the presence of a large number of such groups in the SMA resin makes the attraction between pi-electrons and Pb2+ ions important. The –SH group showed the next lowest BE towards Pb2+ ions. The size of sulfur and its less electronegative nature are responsible for the longer bond length and lower BE. The –COOH group show a lower BE towards lead due to the redistribution of electrons between CO and OH in the presence of Pb2+. The singlet Pb2+-ion ketonic group showed the highest BE compared to any other form, but for triplet Pb2+ ions, aldehyde and hydroxyl oxygen showed the highest BEs. The BEs of –CO and –OH were found to be nearly 328 kcal mol−1, suggesting that moderate chemical adsorption may be involved in the mechanism of the adsorption of Pb2+ onto the SMA resin.
4. Conclusions
In summary, we have demonstrated that the inexpensive and eco-friendly adsorbent SMA resin has a significant adsorption capacity (106.5 mg g−1) compared with other adsorbents reported in the literature (Table S6†) for the removal of lead ions from wastewater. The SMA resin revealed highly efficient Pb2+ removal (73.45% at pH 6), and chemical adsorption was favorable at higher temperatures. Moreover, the SMA resin indicates adsorption isotherm correlation in the following order: Langmuir > Freundlich > Koble–Corrigan > Temkin > Dubinin–Radushkevich. Kinetics studies indicate that the adsorption shows the best fit with pseudo-second-order kinetics, followed by pseudo-first-order and first-order kinetics. Thermodynamic studies showed that adsorption was spontaneous at all temperatures. An investigation of desorption and recovery revealed that HCl could be used as a desorption agent, and it gave desorption of 90.7% at pH 2.5; a removal percentage of 86.3% could be maintained for up to six cycles. The straightforward strategy used for the preparation of the SMA adsorbent, the minimal energy required, and the high removal capacity over a number of cycles support the use of this SMA adsorbent. DFT studies proved that the pyrene ring system with functional groups interacted with Pb2+, and the proposed SMA resin showed high binding energies toward Pb2+. Hence, these results highlight the advantages of this material for wastewater treatment for environmental applications.Conflicts of interest
There are no conflicts to declare.Acknowledgements
SA gratefully acknowledges the All India Council for Technical Education (AICTE) and Govt. College of Engineering, Salem-636011 (Tamil Nadu, India) for providing funding under the Technical Education Quality Improvement Programme (TEQIP) phase-III scholarship scheme.Notes and references
- Y. A. Yahaya, M. M. Don and S. Bhatia, J. Hazard. Mater., 2009, 161, 189–195 CrossRef CAS.
- A. Azimi, A. Azari, M. Rezakazemi and M. Ansarpour, ChemBioEng Rev., 2017, 4, 37–59 CrossRef.
- T. Zehra, L. B. L. Lim and N. Priyantha, Environ. Earth Sci., 2015, 74, 2541–25514 CrossRef CAS.
- P. X. Sheng, Y. P. Ting, J. P. Chen and L. Hong, J. Colloid Interface Sci., 2004, 275, 131–141 CrossRef CAS.
- S. Lata, P. K. Singh and S. R. Samadder, Int. J. Environ. Sci. Technol., 2015, 12, 1461–1478 CrossRef CAS.
- C. Saka, Ö. Şahin and M. M. Küçük, Environ. Sci. Technol., 2012, 9(2), 379–394 CAS.
- M. R. Lasheen, I. Y. El-Sherif, S. T. El-Wakeel, D. Y. Sabry and M. F. El-Shahat, J. Mater. Environ. Sci., 2017, 8, 503–511 CAS.
- Y. Yu, J. Wang, J. Chen, X. He, Y. Wang, K. Song and Z. Xie, J. Environ. Sci., 2016, 47, 100–108 CrossRef CAS.
- S. Saber-Samandari, S. Saber-Samandari, N. Nezafati and K. Yahya, J. Environ. Manage., 2014, 146, 481–490 CrossRef CAS.
- A. Kaur and S. Sharma, Indian J. Sci. Technol., 2017, 10, 1–14 CAS.
- S. Pap, J. Radonić, S. Trifunović, D. Adamović, I. Mihajlović, M. Vojinović Miloradov and M. Turk Sekulić, J. Environ. Manage., 2016, 184, 297–306 CrossRef CAS.
- K. Nuithitikul, R. Phromrak and W. Saengngoen, Sci. Rep., 2020, 10(1), 1–14 CrossRef.
- J. Feng, J. Zhang, W. Song, J. Liu and Z. Hu, Ecotoxicol. Environ. Saf., 2020, 203, 111002 CrossRef CAS.
- S. H. Lin and R. S. Juang, J. Environ. Manage., 2009, 90, 1336–1349 CrossRef CAS.
- F. Mateen, I. Javed, U. Rafique, N. Tabassum, M. Sarfraz, S. Z. Safi, I. Yusoff and M. A. Ashraf, Desalin. Water Treat., 2015, 14, 1–9 Search PubMed.
- M. Carmona, A. De Lucas, J. L. Valverde, B. Velasco and J. F. Rodriguez, Chem. Eng. J., 2006, 117(2), 155–160 CrossRef CAS.
- K. Matsusaki, N. Hashimoto, N. Kuroki and T. Sata, Anal. Sci., 1997, 13(3), 345–349 CrossRef CAS.
- A. W. Trochimczuk, Eur. Polym. J., 1998, 34(7), 1047–1051 CrossRef CAS.
- S. Kobayashi, T. Tanabe, T. Saegusa and F. Mashio, Polym. Bull., 1986, 15(1), 7–12 CrossRef CAS.
- S. Raghav and D. Kumar, J. Chem. Eng. Data, 2018, 63(5), 1682–1697 CrossRef CAS.
- M. Naushad, S. Vasudevan, G. Sharma, A. Kumar and Z. A. Alothman, Desalin. Water Treat., 2016, 57, 18551–18559 CrossRef CAS.
- X. Li and L. Yan, RSC Adv., 2019, 9(22), 12732–12736 RSC.
- Y. Cheng, C. Yang, H. He, G. Zeng, K. Zhao and Z. Yan, J. Environ. Eng., 2016, 142, C4015001 CrossRef.
- T. Qiu, J. Yang, X. Bai and Y. Wang, RSC Adv., 2019, 9, 12737–12746 RSC.
- H. Bhunia and P. K. Bajpai, RSC Adv., 2015, 5(58), 46568–46582 RSC.
- A. Sivaprakasam, T. Venugopal and K. Kannan, Iran. J. Chem. Chem. Eng., 2020, 39(6), 75–93 Search PubMed.
- Q. Li, Y. C. Lin, X. Chen and N. Yun, J. Hazard. Mater., 2007, 148(3), 671–678 CrossRef.
- G. B. Adebayo, N. Abdus-salam and S. A. Elelu, Ilorin J. Sci., 2014, 1(1), 1–10 Search PubMed.
- T. Mutiara, F. I. Muhandi, A. Alhumaini, A. Chafidz and P. Hidayat, Mater. Sci. Forum, 2020, 981, 331–335 Search PubMed.
- M. M. Habtegebrel and M. A. Khan, Mod. Chem., 2018, 6, 6–14 CrossRef CAS.
- S. H. Tabatabaei, M. Asemanrafat and M. Nousahdi, E3S Web Conf., 2013, 1, 13010 CrossRef.
- K. C. Nebaghe, Y. El Boundati, K. Ziat, A. Naji, L. Rghioui and M. Saidi, Fluid Phase Equilib., 2016, 430, 188–194 CrossRef CAS.
- M. Imamoglu and O. Tekir, Desalination, 2008, 228, 108–113 CrossRef CAS.
- C. K. Singh, J. N. Sahu, K. K. Mahalik, C. R. Mohanty, B. R. Mohan and B. C. Meikap, J. Hazard. Mater., 2008, 153, 221–228 CrossRef CAS.
- H. Wang and P. Luo, Water, Air, Soil Pollut., 2020, 231(7), 1–5 Search PubMed.
- G. Abimbola, Z. Zaman and P. Adeniyi, J. Cleaner Prod., 2017, 148, 958–968 CrossRef.
- N. Gopal, M. Asaithambi, P. Sivakumar and V. Sivakumar, J. Water Process. Eng., 2014, 2, 87–95 CrossRef.
- K. S. Obayomi, M. Auta and A. S. Kovo, Desalin. Water Treat., 2020, 181, 376–384 CrossRef CAS.
- Y. Huang, C. Yang, Z. Sun, G. Zeng and H. He, RSC Adv., 2015, 5, 11475–11484 RSC.
- J. Zhang, J. Shao, Q. Jin, X. Zhang, H. Yang, Y. Chen, S. Zhang and H. Chen, Sci. Total Environ., 2020, 716, 1–9 Search PubMed.
- N. Gopal, M. Asaithambi, P. Sivakumar and V. Sivakumar, J. Water Process. Eng., 2014, 2, 87–95 CrossRef.
- F. Batool, J. Akbar, S. Iqbal, S. Noreen, S. Nasir and A. Bukhari, Bioinorg. Chem. Appl., 2018, 3, 230–239 Search PubMed.
- Z. B. Bouabidi, M. H. El-naas, D. Cortes and G. Mckay, Chem. Eng. J., 2018, 334, 837–844 CrossRef CAS.
- H. Fan, X. Sun, Z. Zhang and W. Li, J. Chem. Eng. Data, 2014, 59(6), 2106–2114 CrossRef CAS.
- A. A. Inyinbor and F. A. A. G. A. Olatunji, Appl. Water Sci., 2017, 7, 2297–2307 CrossRef CAS.
- A. Jellibi, I. Chaabane and K. Guidara, Phys. E, 2016, 84, 1–9 CrossRef CAS.
Footnote |
| † Electronic supplementary information (ESI) available: Tables showing FT-IR spectral data, the parameters of various isotherm models for the adsorption of Pb2+ onto SMA resin, the adsorption capacities of various adsorbent, kinetic models of adsorption on Pb2+-loaded SMA resin at various temperatures, thermodynamic parameters for the adsorption of Pb2+ onto SMA resin, and computational studies of the adsorption of Pb2+ on the SMA resin. See DOI: 10.1039/d0ra10128a |
| This journal is © The Royal Society of Chemistry 2021 |

