
 Open Access Article
 This Open Access Article is licensed under a Creative Commons Attribution-Non Commercial 3.0 Unported Licence
About the transformation of low Tm into high Tm poly(L-lactide)s by annealing under the influence of transesterification catalysts†
Steffen M. Weidner a,
Andreas Meyerb,
Saber Chattic and
Hans R. Kricheldorf*d
a,
Andreas Meyerb,
Saber Chattic and
Hans R. Kricheldorf*d
aBAM – Bundesanstalt für Materialforschung und -prüfung, Richard Willstätter Str. 11, D-12489 Berlin, Germany
bInstitut für Physikalische Chemie, Universität Hamburg, Grindelallee 117, D-20146 Hamburg, Germany
cInstitute National de la Recherche et D'Analyse (INRAP), Sidi Thabet, Tunisia
dInstitut für Technische und Makromolekulare Chemie, Universität Hamburg, Bundesstr. 45, D-20146 Hamburg, Germany. E-mail: hrkricheldorf@aol.de
First published on 12th January 2021
Abstract
Cyclic polylactides were prepared in bulk at 170 °C, crystallized at 120 °C and then annealed at temperatures between 130 and 170 °C with variation of catalyst, catalyst concentration and annealing time. The transformation of the initially formed low melting (LTm) crystallites, having melting temperatures (Tm) < 180 °C into high melting (HTm) crystallites having Tm values > 189 °C was monitored by means of DSC measurements and characterized in selected cases by SAXS measurements. It was confirmed that the formation of HTm crystallites involves a significant growth of the thickness of the lamellar crystallites along with smoothing of their surface. Annealing at 170 °C for 1 d or longer causes thermal degradation with lowering of the molecular weights, a gradual transition of cyclic into linear chains and a moderate decrease of lamellar thickness. An unexpected result revealed by MALDI TOF mass spectrometry is a partial reorganization of the molecular weight distribution driven by a gain of crystallization enthalpy.
Introduction
Poly(L-lactide) is an important biodegradable and biosourced engineering plastic, which is produced by several chemical companies. Due to the higher costs compared to oil-based polymers, its application today is still severely limited. However, due to the rapidly increasing pollution of oceans, lakes and rivers with plastic and microplastic, polylactides might have a bright future. The first reports of the synthesis of poly(D,L-lactide) based on the polycondensation of rac-D,L-lactic acid were published in 1833 and 1845.1,2 A first patent concerning the polymerization of L-lactide followed more than 100 years later.3 Greater interest in the properties and commercial application of polylactide or copolymers of L-lactic acid arose after 1967, when Union Carbide patented strong biodegradable fibres based on polyglycolide.4 In 1972 Ethicon Inc. followed with patenting of medical structures containing L-lactic acid.5,6 Since then, the interest in polylactic acid and polylactide has risen dramatically.Like almost all applications of poly(L-lactide), this and other medical applications (e.g. for implants) are based on its semi-crystalline character with a glass transition around 62–64 °C and a melting temperature in the range of 174–177 °C with short annealing, or in the range of 176–180 °C after long annealing, when catalysts are absent or poisoned (typical for commercial polylactides).6–11 The orthorhombic crystal lattice (α-modification), first identified by DeSantis and Kovacs,12 is the basis of this consideration, because it is the normal result of a stress-free annealing or slow cooling of molten poly(L-lactide) above 120 °C.13 These values are typical for linear poly(L-lactide)s. Interestingly, during the past decade quite different Tm and ΔHm values were reported by several research groups for cyclic poly(L-lactide)s. At first (2011) Prasad et al. listed Tm values in the range of 140–147 °C recorded from virgin samples and a Tm of 159 °C for a sample annealed at 65 °C.14 These samples were prepared via zwitterionic polymerization with an in situ generated carbene, a method with a high potential for racemization due to the anionic chain end, but information about optical purity was not disclosed. In 2012 the Waymouth group reported a Tm of 135 °C and ΔHm of 18 J g−1 for a sample also prepared via carbene-catalyzed zwitterionic polymerization.15 However, those authors also found a considerable extent of racemization. Again, a carbene-catalyzed zwitterionic polymerization was used by Si et al.,16 but at −70 °C a highly stereoselective polymerization of racemic D,L-lactide was found yielding cyclic low molar mas poly(L-lactide)s (Mw < 9000 g mol−1) with up to 91% optical purity. For these samples Tm values in the range of 165–193 °C were measured.
In 2015 the Tezuka group described the synthesis of low molar mass cyclic poly(L- and D-lactide)s by a photochemical end-to-end cyclization of linear precursors.17 This synthetic method avoids significant racemization but leaves a guest comonomer in the cycles. The low Tm values (128 °C for L and 125 °C for D-polylactide) along with the low melting enthalpies (26 J g−1 for L and 25 J g−1 for D-polylactide) demonstrate the enormous influence of the guest comonomer on the physical properties. Nonetheless, those authors extrapolated a ΔHm0 value of 44 J g−1 for a perfect crystal with 100% crystallinity. Again, a guest–host copolymer was prepared by the Müller group via an end-to-end cycloaddition reaction of a linear precursor.18 A Tm of 148.6 °C and ΔHm of −24.3 J g−1 were found, similar to the values reported by the Tezuka group. An equilibrium Tm0 of 164 °C was calculated for a perfect crystal of cyclic poly(L-lactide) and a Tm0 of 159 °C for a linear polymer of similar low molecular weight (Mw < 17![[thin space (1/6-em)]](https://www.rsc.org/images/entities/char_2009.gif) 000 g mol−1). The much higher experimental Tm values of linear poly(L-lactide)s reported by other research groups were ignored.7–11 Particular noteworthy in this connection are the isothermal crystallization experiments of Kalb and Pennings, who extrapolated a Tm0 of 215 °C.19 Interestingly, the Pennings group had synthesized their poly(L-lactide)s themselves by polymerization of L-lactide in bulk using neat tin(II) 2-ethylhexanoate as catalyst (SnOct2). This catalyst was not removed nor poisoned. For almost five decades it was believed that polymerization of lactides by means of SnOct2 yields linear polylactides regardless, if an initiator was added or not. Yet, quite recently it was demonstrated by the authors that neat SnOct2 yields in fact cyclic polylactides.20 Hence, it is probable, that the Pennings group observed cyclic poly(L-lactide) by microscope, and that their results were influenced by the presence of the catalyst. Finally, a recent study (2020) of Louisy et al. should be mentioned,21 which describes a comparison of cyclic and linear poly(L-lactides) having identical molar masses (Mw < 50000 g mol−1, respectively <30000 g mol−1 with a correction for THF as SEC solvent). Lanthanum borohydride was used as catalyst, but despite its basicity no information about optical purity was given. For the cyclic polylactide a Tm of 165 °C and ΔHm of 42 J g−1 was reported, whereas a Tm of 171 °C with a ΔHm of 50 J g−1 was found for the linear species. These data were determined from the 2nd heating trace of DSC measurements with a rate of 10 K min−1, a method which underrates the thermal properties of annealed samples.
000 g mol−1). The much higher experimental Tm values of linear poly(L-lactide)s reported by other research groups were ignored.7–11 Particular noteworthy in this connection are the isothermal crystallization experiments of Kalb and Pennings, who extrapolated a Tm0 of 215 °C.19 Interestingly, the Pennings group had synthesized their poly(L-lactide)s themselves by polymerization of L-lactide in bulk using neat tin(II) 2-ethylhexanoate as catalyst (SnOct2). This catalyst was not removed nor poisoned. For almost five decades it was believed that polymerization of lactides by means of SnOct2 yields linear polylactides regardless, if an initiator was added or not. Yet, quite recently it was demonstrated by the authors that neat SnOct2 yields in fact cyclic polylactides.20 Hence, it is probable, that the Pennings group observed cyclic poly(L-lactide) by microscope, and that their results were influenced by the presence of the catalyst. Finally, a recent study (2020) of Louisy et al. should be mentioned,21 which describes a comparison of cyclic and linear poly(L-lactides) having identical molar masses (Mw < 50000 g mol−1, respectively <30000 g mol−1 with a correction for THF as SEC solvent). Lanthanum borohydride was used as catalyst, but despite its basicity no information about optical purity was given. For the cyclic polylactide a Tm of 165 °C and ΔHm of 42 J g−1 was reported, whereas a Tm of 171 °C with a ΔHm of 50 J g−1 was found for the linear species. These data were determined from the 2nd heating trace of DSC measurements with a rate of 10 K min−1, a method which underrates the thermal properties of annealed samples.
Quite recently the authors also have reported22 that syntheses of cyclic poly(L-lactide) by means of ring-expansion polymerization (REP) or by ring-opening polymerization with simultaneous polycondensation (ROPPOC, for definition see ref. 23) may yield high-melting poly(L-lactide) with Tm values up to 196 °C. The formation of this HTm poly(L-lactide)s by isothermal polymerization and crystallization at temperatures between 120 and 160 °C required long reaction times (20–70 h depending on the catalyst). By isothermal crystallization in the same temperature range Pennings et al.19 found Tm values that were 10–15 °C lower than those of the authors.22 In summary, the afore-mentioned data demonstrate that the fundamental physical data of cyclic and linear poly(L-lactide)s published so far do not give a consistent picture yet.
In this context the present work served three purposes. Firstly, it should be found out, if it is possible to transform the normal LTm crystallites into the HTm counterparts by annealing in the solid state when reactive transesterification catalysts are present. Secondly (and more important), it should be confirmed, that the HTm polylactides with Tm values > 190 °C, represent the thermodynamically most stable combination of modification and morphology, regardless if cyclic or linear polylactides are concerned, the combination of the results presented in this work with our recently published results will, in turn demonstrate, that all lower Tm values published in the past do not represent the thermodynamically controlled maximum. Finally, it should be found out, which catalyst is best suited for such a transformation. The formulas and abbreviations of the catalysts used or discussed in this work were summarized in Scheme 1.
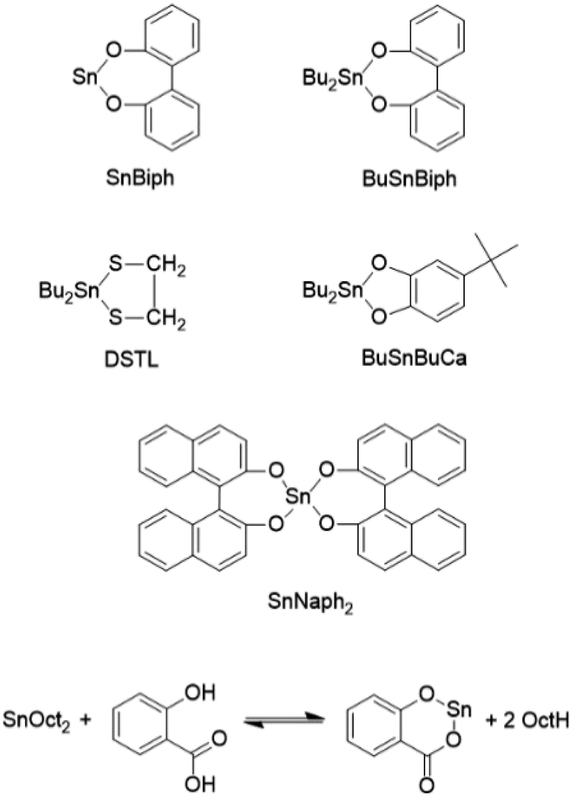 | ||
| Scheme 1 Tin catalysts and their acronyms used or discussed in this work. | ||
Experimental
Materials
L-Lactide, a product of PURAC was kindly supplied by Thyssen-Uhde (Berlin, Germany) and recrystallized from toluene (99.89% extra dry, ACROS Chemicals, Geel, Belgium). Ethyl L-lactate was purchased from Sigma-Aldrich (Taufkirchen, Germany) and used as received, tin(II) 2-ethylhexanoate (>96% purity) was purchased from Alfa Aesar (Karlsruhe, Germany) and used as received. DSTL,24 BuSnBuCa,25 BuSnBiph26 and SnBiph27 were synthesized as described in previous publications dealing with syntheses of cyclic poly(L-lactide)s by means of these catalysts. Those publications also contain the experimental evidence for the cyclic topology of the resulting polylactides.Polymerization and annealing
| Exp. no. | Lac/Cat | T (°C) | t (h) | Mn | Mw | Tm (°C) | ΔHm (−J g−1) | Cryst. (%) |
|---|---|---|---|---|---|---|---|---|
| a L-Lactide was polymerized at 170 °C for 1.5 h, crystallized at 120 °C for 2 h and then annealed under the conditions listed in the table. | ||||||||
| 1 | 1000/1 | 120 | 2 | 73000 |
191000 |
176.4 | 45.0 | 42 |
| 2 | 1000/1 | 170 | 4 | 69000 |
181000 |
182.0 | 65.0 | 62 |
| 3 | 1000/1 | 170 | 8 | 64500 |
174000 |
194.5 | 88.5 | 83 |
| 4 | 1000/1 | 170 | 24 | 60500 |
163000 |
192.7 | 87.7 | 82 |
| 5 | 1000/1 | 170 | 48 | 48500 |
126000 |
193.8 | 91.1 | 86 |
| 6 | 2000/1 | 120 | 2 | 66000 |
168000 |
175.0 | 43.5 | 41 |
| 7 | 2000/1 | 170 | 24 | 65000 |
158000 |
192.8 | 93.7 | 88 |
| 8 | 2000/1 | 170 | 48 | 59500 |
127500 |
192.7 | 93.1 | 88 |
| 9 | 4000/1 | 120 | 2 | 35000 |
101000 |
175.5 | 42.5 | 40 |
| 10 | 4000/1 | 170 | 24 | 27000 |
73500 |
192.7 | 102.2 | 96 |
| 11 | 4000/1 | 170 | 48 | 26000 |
67000 |
194.0 | 101.5 | 95 |
| Exp. no. | T (°C) | t (h) | Mn | Mw | Tm (°C) | ΔHm (−J g−1) | Cryst. (%) |
|---|---|---|---|---|---|---|---|
| 1 | 120 | 2 | 61000 |
174000 |
175.5 | 44.0 | 41 |
| 2 | 160 | 4 | 52000 |
162000 |
181.3 | 64.5 | 61 |
| 3 | 160 | 8 | 51000 |
156000 |
183.0 | 73.5 | 69 |
| 4 | 160 | 24 | 58000 |
128000 |
188.5 | 88.2 | 82 |
| 5 | 160 | 48 | 46000 |
110000 |
187.0 | 82.0 | 78 |
| Exp. Nn. | T (°C) | t (h) | Mn | Mw | Tm (°C) | ΔHm (−J g−1) | Cryst. (%) |
|---|---|---|---|---|---|---|---|
| a Repetition with another batch of L-lactide gave Tm: 177.5 and ΔHm −41.0 J g−1.b Direct polymerization of L-lactide in bulk at 140 °C. | |||||||
| 1 | 120 | 2 | 63000 |
187000 |
176.0a | 42.5 | 40 |
| 2 | 140 | 8 | 35000 |
162500 |
179.0 | 57.0 | 54 |
| 3A | 140 | 24 | 61000 |
172000 |
181.5 | 58.5 | 55 |
| 3Bb | 140 | 24 | 67000 |
170000 |
189.5 | 68.5 | 64 |
| 4 | 140 | 48 | 64000 |
173000 |
183.0 | 68.0 | 64 |
| 5 | 140 | 96 | 70000 |
161000 |
184.5 | 71.5 | 67 |
| 6A | 140 | 192 | 34000 |
88000 |
184.5 | 76.0 | 72 |
| 6Bb | 140 | 192 | 27000 |
68000 |
190.0 | 79.5 | 85 |
The MALDI TOF mass spectra were measured with Bruker Autoflex III mass spectrometer equipped with a Smartbeam laser (λ = 355 nm). All spectra were recorded in the positive ion linear mode. The MALDI stainless steel targets were prepared from chloroform solutions of poly(L-lactide) and doped with potassium trifluoroacetate (2 mg mL−1). Typically, 20 μL of sample the solution, 2 μL of the potassium salt solution and 50 μL of a solution of trans-2-[3-(4-tert-butylphenyl)-2-methyl-2-propenylidene] malononitrile (DCTB, 20 mg mL−1, CHCl3) serving as matrix were mixed in an Eppendorf vial. 1 μL of the corresponding solution was deposited on the MALDI target.
The GPC measurements were performed in a modular system kept at 40 °C consisting of an isocratic pump, 1 mL min−1 and a refractive index detector (RI-501-Shodex). Samples were manually injected (100 μL, 2–4 mg mL−1). For instrument control and data calculation Clarity software (GPC extension, DataApex) was used. The calibration was performed using polystyrene standard sets (Polymer Standards Service – PSS, Mainz) covering the mass range of 500–1200000 g mol−1.
The DSC heating traces were recorded on a (with indium and zinc freshly calibrated) Mettler-Toledo DSC-1 equipped with Stare Software-11 using a heating rate of 10 K min−1. Only the first heating traces were evaluated. The crystallinities were calculated with a ΔHm max of −106 J g−1.
The WAXS and SAXS measurements were performed using our in-house SAXS/WAXS apparatus equipped with an Incoatec™ X-ray source IμS and Quazar Montel optics. The wavelength of the X-ray beam was 0.154 nm and the focal spot size at the sample position was 0.6 mm2. The samples were measured in transmission geometry and were recorded with a Rayonix™ SX165 CCD-Detector. For the WAXS measurements the sample-detector distance was 0.1 m, allowing to detect an angular range of 2Θ = 5°–33°. The recording time for each WAXS pattern was 300 s. The SAXS measurements were performed at sample-detector distance of 1.6 m and the accumulation was 1200 s. DPDAK, a customizable software for reduction and analysis of X-ray scattering data sets was used for gathering 1D scattering curves.28 For the evaluation of the crystallinity of the samples the data were imported in Origin™ and analyzed with the curve fitting module. After subtracting of the instrumental background, the integral intensity of the crystalline reflections was divided by the overall integral intensity to determine the crystallinity Xc. The SAXS curves were converted into Kratky plots. The long periods of the lamellar domains were determined by the q values of the reflection maxima.
Results and discussion
Annealing experiments with the SnBiph catalyst
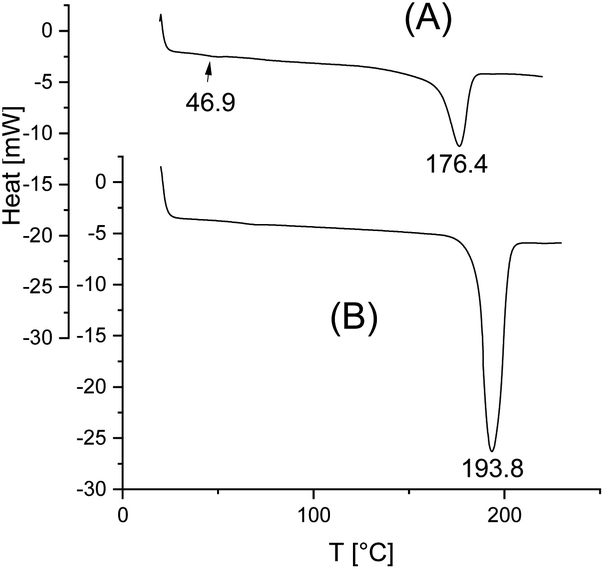
Since it was expected that a transformation of crystallites from LTm into HTm form will be a slow process, the first series of experiments was performed with the most reactive polymerization catalyst, namely SnBiph (see Scheme 1). Furthermore, the highest possible temperature (170 °C) was used for the first experiments, together with a long reaction time of 2 d and a relatively high catalyst concentration corresponding to a Lac/Cat ratio of 1000/1 (No. 5, Table 1). When almost complete transformation (meaning Tm values > 190 °C) was indicated by the DSC measurements, the time was shortened (No. 2–4, Table 1), the catalyst concentration was lowered (No. 6–11, Table 1), and finally the temperature was lowered (see Tables 2 and 3). Shortening of the time at 170 °C revealed that 8 h suffice to achieve nearly complete transformation. The experiments with higher Lac/Cat ratios demonstrated that even at 4000/1 the catalyst is still reactive enough to enable a nearly complete transformation within 1 d (Table 1, No. 10).All DSC traces recorded in the course of this study have in common, that they display a simple monomodal endotherm, as exemplarily illustrated in Fig. 1 and S1 (ESI†). After annealing at 120 °C/2 h the DSC traces still display a glass-transition step and the melting endotherm has a broad “foot” beginning around 130 °C (Fig. 1A and S1A†) indicating that small rather imperfect crystallites are still present. Annealing at 170 °C results in narrowing of the endotherm, and the upper end of the “foot” shifts to temperatures around 210 °C (Fig. 1B and S1B†). This means that a few large and rather perfect crystallites are present melting in the range of 200–206 °C. Interestingly, these high melting points (>200 °C) come relatively close to the maximum Tm of perfect single crystal with infinite layer thickness (Tm0 = 215 °C), calculated by Kalb and Pennings.19 Therefore, these DSC data suggest that the Tm0 calculated by Kalb and Pennings was realistic, and indicate that the guest–host copolymers described by groups of Tezuka [b] and Müller [c] cannot serve as reasonable models of cyclic or linear optically pure poly(L-lactide)s, since their Tm values (and ΔHm values, see below) are much too low.
One noteworthy result of these experiments was the steadily decrease of the molecular weights with increasing annealing time indicating steady thermal degradation. Nonetheless, the weight average molecular weights (Mw) remained above 120000 g mol−1. More information about this aspect was obtained from the MALDI TOF mass spectra discussed below. A second noteworthy result was the increase of crystallinity accompanying thermal degradation. Extremely high values (up to 95%) were achieved, even when calculated with a maximum ΔHm of −106 J g−1, which seems to be the most widely accepted ΔHm max value today.29,30 For a long period of time a ΔHm max of −93.5 J g−1, firstly published by Fischer and co-workers,31 was used by several research groups.32 Later Wunderlich and co-workers33 even published a somewhat lower value (91 J g−1), which was also advocated by DiLorenzo.8 The Colembier/Müller group used a ΔHm0 as low as 44 J g−1 for the calculation of crystallinities.18 However, those values are certainly too low, because several samples obtained in this work and reported in a previous publication22 would have crystallinities around or above 100%, even when calculated with the “Fischer or Wunderlich values”. Increasing crystallinity during thermal degradation may have two reasons. Firstly, shorter chains have higher kinetic and thermodynamic tendency to crystallize, and secondly, the transformation of cyclic into linear chains may also contribute to this phenomenon (see below).
Finally, it should be added that the DSC traces of samples annealed at 120 °C/2 h still display a weak glass-transition step around 50–55 °C in agreement with a relatively low crystallinity (<50%). This glass-transition step was no longer visible in the DSC traces at annealing at 170 °C (or 160 °C and 140 °C see below) in agreement with increasing crystallinity.
When the temperature was lowered to 160 °C (Table 2), one might not expect this small temperature difference to have a significant effect. But, in fact two noteworthy results were obtained. Firstly, even an annealing time of 2 d did not suffice to achieve a complete transformation of LTm into HTm crystallites having a Tm above 190 °C, although the Tm's achieved after 1 d came close to this threshold. This failure is remarkable, because in the previously reported direct polymerization experiments a reaction time of 1 d at 160 °C sufficed to obtain a polylactide having a Tm > 190 °C. Secondly, the SEC measurements indicated that despite the lower temperature thermal degradation was nearly as effective as at 170 °C.
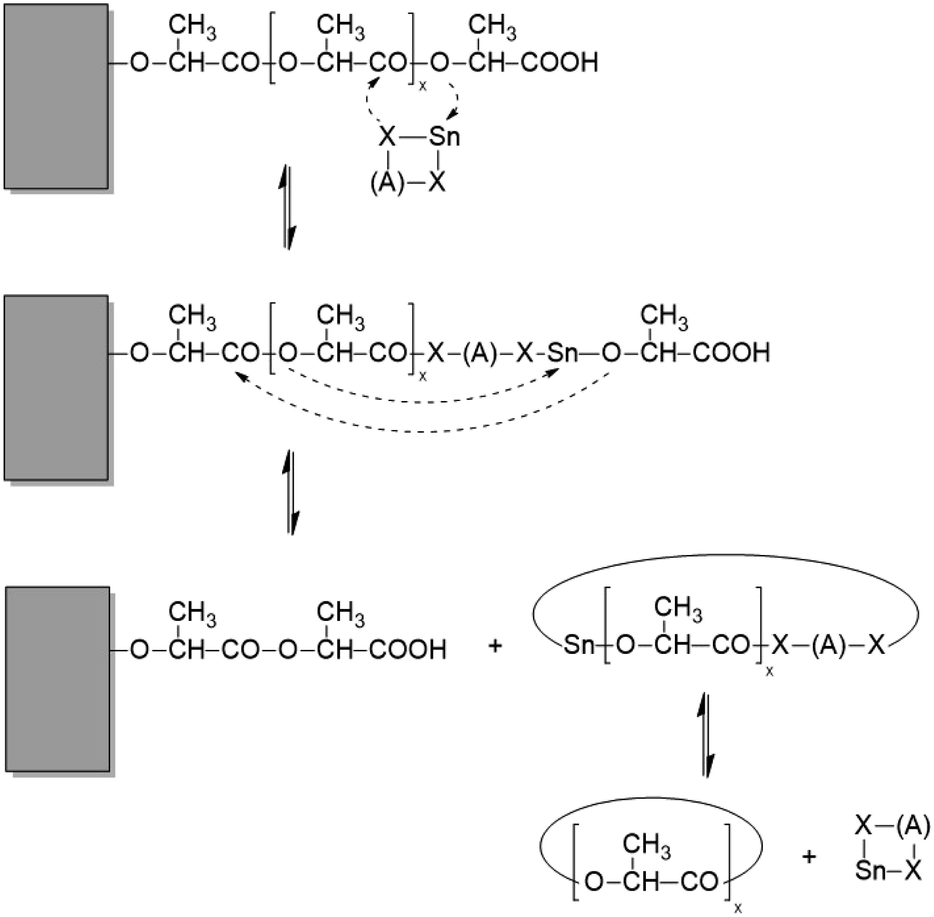
It is interesting to compare these observations with results obtained from annealing experiments with the catalyst SnNaph2 (Scheme 1).34 These experiments were again performed at 160 °C and extended up to 4 d. Using even-numbered species (cycles and/or linear chains) as substrate allowed for monitoring the formation of odd-numbered species. Their detection proved, that the equilibration process involved all chains proceed in solid poly(L-lactide)s. As illustrated in Scheme 2, these transesterification reactions mainly involve the loops on the surface of the crystallites, because of their higher reactivity resulting from energetically unfavourable conformations. It was clearly demonstrated that the chain segments embedded in crystallites were not involved in transesterification reactions. Characteristic for these experiments with the sluggish SnNaph2 catalyst is the finding that despite long annealing times of 4 d, the Tm did not increase beyond 180 °C. Therefore, this comparison of SnBiph and SnNaph2 reveals firstly, that the reactivity of the catalyst is decisive for the transformation of LTm into HTm crystals and, secondly, that transesterification reactions involving all chains are restricted to the disordered phase on the surface of the crystallites and do not involve the interior of the crystallites or a melting of crystallites.
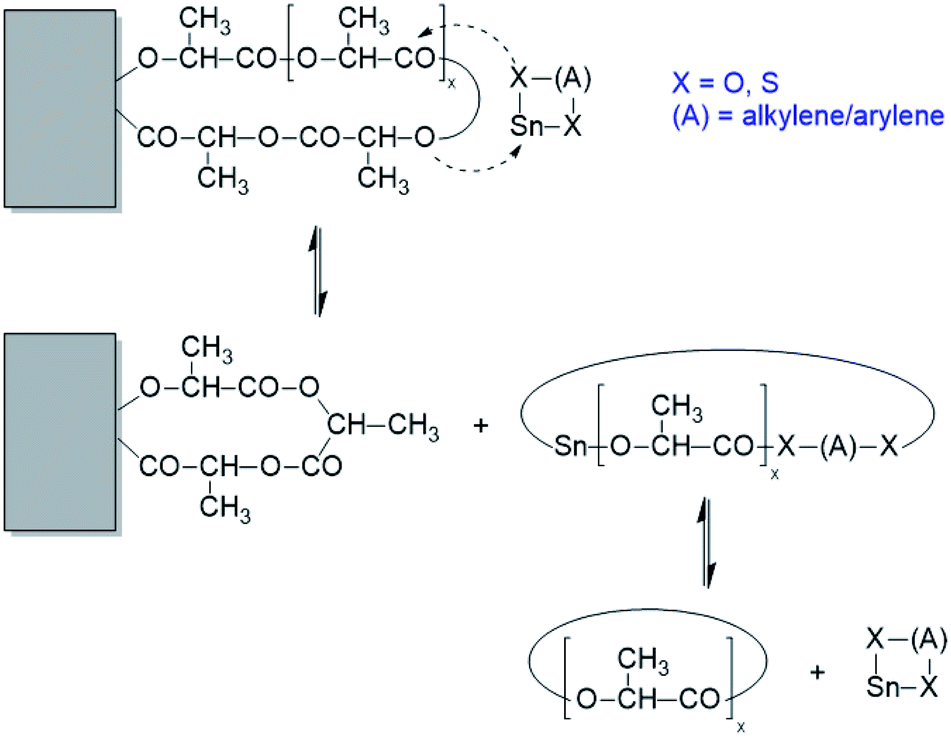 | ||
| Scheme 2 Example of a transesterification reaction shortening (or expanding) a loop on the surface of a crystallite. | ||
Further annealing experiments were performed at 140 °C (Table 3) and 130 °C (see Table S1, ESI†). Since both temperatures gave quite similar results, a separate discussion is not necessary. In both series a Tm > 185 °C was not achieved, despite annealing times up to 8 d (No. 5, Tables 3 and S1†). These results confirmed that an annealing temperature > 160 °C is needed to reach an almost complete transformation of LTm into HTm crystallites with a Tm above 190 °C. The positive effect of the lower temperatures is significantly slower rate of thermal degradation. Up to an annealing time of 4 d (92 h) the Mw values remained above 160000 g mol−1 (from an initial value of 187000 g mol−1) and the MALDI TOF mass spectra confirmed that the cyclic species remained the predominant component of the entire sample. Somewhat surprising was the enormous difference between direct polymerization (B experiments) and annealing (A experiments) performed at identical temperature and time. Regardless, if a temperature of 130 °C or 140 °C was chosen, a polymerization time of 1 d sufficed to obtain a Tm of 189.5–190.5 °C. This enormous discrepancy raises the question, why the crystallization from the reaction mixture is far more effective in creating HTm polylactides. A first-hand hypothesis suggests that the mobility of the catalyst along the surfaces of the crystallites is considerably higher, when the crystallites grow from the melt and are surrounded by a larger mobile amorphous phase. At 170 °C the situation is quite different, because no crystallization occurs during polymerization at this temperature.
Annealing with various cyclic tin catalysts
This part of the work had the purpose to find out to what extent the results obtained with SnBiph can be achieved with the dibutyltin(IV) catalysts DSTL, BuSnBuca and BuSnBiph, which showed a lower reactivity in polymerization experiments (Tables 4 and 5). Furthermore, the combination of SnOct2 and salicylic acid was studied (Table 6). Considering the lower reactivity of the dibutyltin catalysts, and taking into account the results of SnBiph (Tables 1 and 2), all experiments listed in Tables 4–6 were performed at a temperature of 170 °C. A first series of annealing experiments was conducted with DSTL (Table 4), which gave excellent results in direct polymerization experiments despite its lower reactivity (in terms of polymerization rate). When a Lac/Cat ratio of 1000/1 was used (No. 1–5, Table 4), a time of 48 h did not suffice to achieve a Tm around 190 °C. Two more experiments were conducted with a Lac/Cat ratio of 2000/1, and despite the lower catalyst concentration, a Tm of 189.5 °C was reached.| Exp. no. | Lac/Cat | T (°C) | t (h) | Mn | Mw | Tm (°C) | ΔHm (−J g−1) | Cryst (%) |
|---|---|---|---|---|---|---|---|---|
| a Repetition with another batch of L-lactide. | ||||||||
| 1A | 1000/1 | 120 | 2 | 83000 |
157000 |
177.5 | 50.5 | 48 |
| 1Ba | 1000/1 | 120 | 2 | 87000 |
162000 |
176.5 | 48.5 | 46 |
| 2 | 1000/1 | 170 | 4 | 63000 |
137000 |
182.5 | 74.0 | 70 |
| 3 | 1000/1 | 170 | 8 | 33000 |
91000 |
185.0 | 75.0 | 71 |
| 4A | 1000/1 | 170 | 24 | 26000 |
63500 |
187.0 | 59.0 | 56 |
| 4Ba | 1000/1 | 170 | 24 | 28000 |
69000 |
187.5 | 58.0 | 54 |
| 5A | 1000/1 | 170 | 48 | 23500 |
55000 |
187.7 | 58.5 | 54 |
| 5Ba | 1000/1 | 170 | 48 | 22000 |
57000 |
187.0 | 59.0 | 55 |
| 6A | 2000/1 | 170 | 2 | 91000 |
157000 |
178.0 | 64.5 | 61 |
| 6Ba | 2000/1 | 170 | 2 | 99000 |
169000 |
178.5 | 61.0 | 58 |
| 7 | 2000/1 | 170 | 24 | 33000 |
81000 |
189.0 | 86.5 | 81 |
| 8 | 2000/1 | 170 | 48 | 30000 |
65000 |
189.5 | 91.5 | 86 |
| Exp. no. | Catalyst | T (°C) | t (h) | Mn | Mw | Tm (°C) | ΔHm (−J g−1) | Cryst. (%) |
|---|---|---|---|---|---|---|---|---|
| 1 | BuSnBuCa | 120 | 2 | 98000 |
197000 |
176.0 | 52.5 | 49 |
| 2 | BuSnBuCa | 170 | 24 | 28000 |
77000 |
188.0 | 98.0 | 92 |
| 3 | BuSnBuCa | 170 | 48 | 31000 |
65000 |
190.5 | 98.0 | 92 |
| 4 | BuSnBiph | 120 | 2 | 47500 |
107000 |
155.5 | 56.5 | 53 |
| 5 | BuSnBiph | 170 | 24 | 22000 |
67000 |
191.0 | 94.0 | 88 |
| 6 | BuSnBiph | 170 | 48 | 24000 |
62000 |
189.0 | 101.0 | 95 |
| Exp. no. | T (°C) | t (h) | Mn | Mw | Tm (°C) | ΔHm (−J g−1) | Cryst. (%) |
|---|---|---|---|---|---|---|---|
| 1 | 120 | 2 | 143000 |
245000 |
167.0 | 58.5 | 55 |
| 2 | 170 | 4 | 80000 |
175000 |
187.0 | 68.0 | 64 |
| 3 | 170 | 8 | 54000 |
125000 |
187.5 | 80.0 | 75 |
| 4 | 170 | 24 | 32000 |
85500 |
187.0 | 95.5 | 90 |
The same Lac/Cat ratio was used for BuSnBuca and BuSnBiph (Table 5), so that the performance of all three catalysts was comparable with each other and with the SnBiph experiments (Table 1.) at a Lac/Cat ratio of 2000/1. This comparison revealed that these dibutyltin catalyst were also reactive enough for complete transformation of LTm into HTm crystallites. Furthermore, they caused considerable reduction of the molecular weights, when the samples were annealed at 170 °C. An explanation of this phenomenon is provided in the discussion of the MALDI TOF mass spectra below.
SnOct2 plays an extraordinary role in the chemistry of polylactides, since its technical production and most academic research concerning synthesis and properties of polylactides is based on this catalyst.35,36 In a recent study it was shown by three experiments that alcohol-initiated and SnOct2-catalyzed ROPs of L-lactide failed to yield HTm crystallites.13 In this work, four annealing experiments were performed with the equimolar combination of SnOct2 and salicylic acid (Table 6). Salicylic acid is a low toxic cocatalyst, which has been shown in a recent study to form a cyclic tin(II) salicylate which catalyzed a REP of L-lactide.37 The standard procedure was applied, namely polymerization of L-lactide at 170 °C followed by annealing and crystallization at 120 °C for 2 h, whereupon crystallites with Tm's below 175 °C were obtained (No. 1, Table 6). These samples were annealed at 170 °C for 4, 8, and 24 h in analogy to the experiments described for SnBiph in Table 1. Surprisingly, the SnOct2-salicylic acid system yielded a nearly complete transformation of the LTm crystallites into the HTm-crystallites within 8 h in close analogy to SnBiph. Although the Tm's remained below 189 °C this transformation involved a considerable thickness growth of the lamellar crystallites as discussed below.
These experiments allow for two conclusions. First, all catalysts enable transformation of LTm into HTm crystallites at 170 °C. Second, annealing at 170 °C for 24 h or longer results in decreasing molecular weights. This decrease is combined with an increase of crystallinity, but it is somewhat surprising that it occurred in solid polylactides and proceeds without significant loss of mass (Δm < 5%). The SEC elution curves of SnOct2 + salicylic acid-catalyzed polylactides displayed in Fig. 2 and the elution curves of BuSnBuca-catalyzed samples presented in Fig. S2 (ESI†) illustrate this process. All the curves obtained from polylactides have in common that the dispersity increases upon annealing at 170 °C partially due to formation of a larger fraction of oligomers as demonstrated by small maximum at long elution times. A partial alteration of the molecular weight distribution found by MALDI TOF mass spectrometry seems to play a role in the conspicuous decrease of the average molecular weights. Yet another contribution may result from chain scission.
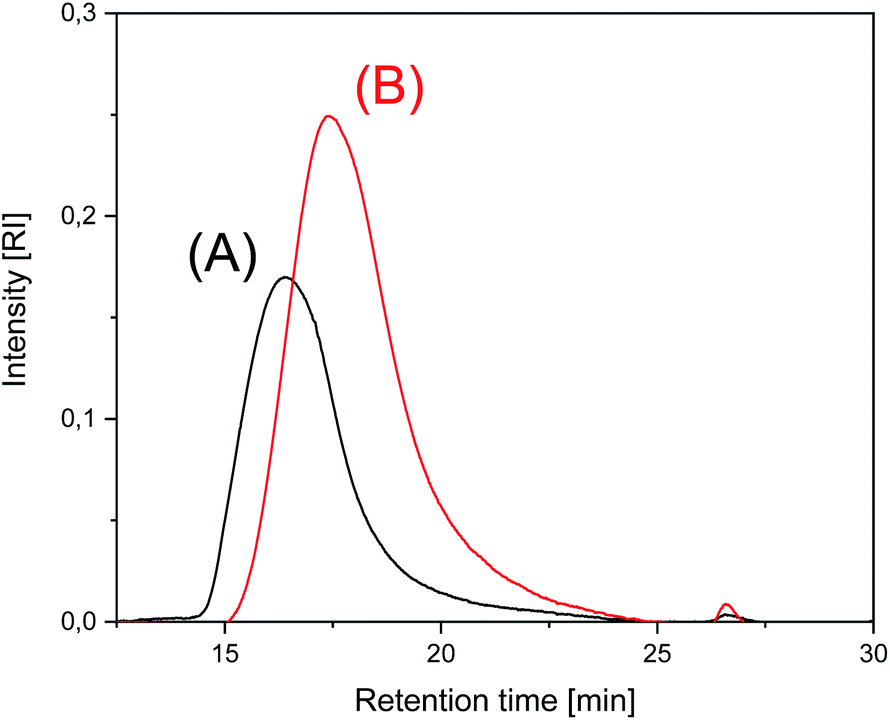 | ||
| Fig. 2 SEC of polylactides prepared and annealed with SnOct2 + salicylic acid: (A) No. 1, Table 6, (B) No. 3, Table 6. | ||
WAXS and SAXS measurements
In the first publication dealing with the preparation of HTm crystallites by direct polymerization of L-lactide it was found, that the WAXS patterns do not allow for differentiation between LTm and HTm crystallites.22 Both kinds of crystallites possess the orthorhombic α-modification first described by DeSantis and Kovacs.12 The α-modification is known to be the thermodynamically most stable crystal modification of poly(L-lactide), which is usually formed at temperatures around and above 120 °C in the absence of mechanical stress. The WAXS patterns of samples No. 1–4, Table 1, presented as Fig. S3(A–D)† in the supplemental part demonstrate that this modification is also formed by the poly(L-lactide)s studied in this work, regardless of annealing temperature and time. Therefore, the WAXS powder patterns do not contribute anything to a differentiation between LTm and HTm crystallites. As usual, they are sensitive to the degree of crystallization, and the WAXS patterns of Fig. S3(B)–(D)† confirmed, that by annealing at 170 °C crystallinities in the range of 80–90% can be reached.It was also previously reported that samples with LTm crystallites show SAXS reflections in the narrow range between 16–22 nm regardless of the molecular weights and if the samples were annealed at 120 °C or 160 °C.13 For poly(L-lactide)s prepared by cyclic tin catalysts L-values (long distance periodicity) in the range of 28–34 nm were found. The L-values listed in Table 7 indicate, that the same correlation also exists for the samples studied in this work, as exemplarily illustrated in Fig. 3 (and Fig. S4 and S5, ESI†). For several samples even L-values in the range of 37–40 nm were found. To get a more accurate insight into the extent of thickness growth the average lamellar thickness (lc) was calculated from L-values by multiplication with the fraction of crystalline phase (see Table 7). These lc values demonstrate that the thickness growth is indeed enormous and corresponds to a factor of 2.5–3.5. In the case of the SnBi and SnSal catalysts most of the thickness growth occurs during the first 8 hours. When the transformation was less complete, as it was characteristic for polylactides prepared with DSTL (Table 4), smaller lc-values were found in combination with Tm's around 184–187 °C. Hence, it may be concluded that an enhanced thickness of the lamellae is one important reason for the higher Tm values. However, a simple proportionality of Tm and L or lc values does not exist, as already observed for the previous polymerization experiments. For example, the Tm values of the samples No. 6, Table 3, No. 3, Table 5, No. 5, Table 5 and No. 3B, Table S1,† all fall into narrow the range of 190–191 °C, whereas the lc values vary between 20 and 34 nm. Therefore, it is unavoidable to assume that homogenization and “smoothing” of the surface is another factor, which contributes to the formation of HTm crystallites. This “smoothing” of the lamellar surfaces reduces the free surface energy (σe) with the consequence that Tm increases. The Gibbs–Thomson eqn (1) presents the correlation of the Tm with the free surface energy (σe), the crystal density (ρ), the melting enthalpy ΔHm and with the average thickness of the crystallites (lc).
| Tm = Tm0[1 − (2σe/ρΔHmlc)] | (1) |
| Exp. no. | Table | Cat. | Temp./time (°C)/(h) | Tm (°C) | L (nm) | Cryst. (%) | lc (nm) | σe (J m−2) |
|---|---|---|---|---|---|---|---|---|
| a No SAXS reflex was detectable. | ||||||||
| 1 | 1 | SnBiph | 120/2 | 176.0 | —a | 40 | — | — |
| 3 | 1 | SnBiph | 170/3 | 194.5 | 37 | 83 | 31 | 24 |
| 5 | 1 | SnBiph | 170/48 | 192.5 | 36 | 96 | 35 | 25 |
| 9 | 1 | SnBiph | 120/2 | 176.5 | 22 | 40 | 9 | — |
| 11 | 1 | SnBiph | 170/48 | 194.0 | 29 | 95 | 28 | 19 |
| 2 | 2 | SnBiph | 160/4 | 181.3 | 23 | 61 | 14 | — |
| 3 | 2 | SnBiph | 160/8 | 183.0 | 24 | 69 | 17 | — |
| 4 | 2 | SnBiph | 160/24 | 188.5 | 25 | 82 | 21 | — |
| 5 | 2 | SnBiph | 160/48 | 187.0 | 25 | 78 | 20 | — |
| 1 | 3 | SnBiph | 120/2 | 176.0 | 21 | 40 | 9 | — |
| 2 | 3 | SnBiph | 140/8 | 179.0 | 28 | 54 | 15 | — |
| 3A | 3 | SnBiph | 140/24 | 181.5 | 26 | 55 | 15 | — |
| 4 | 3 | SnBiph | 140/48 | 183.0 | 26 | 64 | 17 | — |
| 6B | 3 | SnBiph | 140/192 | 190.0 | 28 | 85 | 24 | 22 |
| 1A | 4 | DSTL | 120/2 | 177.5 | 21 | 48 | 10 | — |
| 2 | 4 | DSTL | 170/4 | 182.5 | 25 | 70 | 18 | 25 |
| 4A | 4 | DSTL | 170/24 | 187.0 | 24 | 56 | 13 | — |
| 5A | 4 | DSTL | 170/48 | 187.7 | 23 | 54 | 12 | — |
| 2 | 5 | BuSnBuCa | 170/24 | 188.0 | 29 | 92 | 26 | 25 |
| 3 | 5 | BuSnBuCa | 170/48 | 190.5 | 28 | 92 | 26 | 22 |
| 5 | 5 | BuSnBiph | 170/24 | 191.0 | 39 | 88 | 34 | 30 |
| 6 | 5 | BuSnBiph | 170/48 | 189.0 | 33 | 96 | 32 | 27 |
| 1 | 6 | SnOct2 + Sal | 120/2 | 167.0 | 21 | 55 | 12 | — |
| 2 | 6 | SnOct2 + Sal | 170/4 | 187.0 | 40 | 64 | 26 | 35 |
| 3 | 6 | SnOct2 + Sal | 170/8 | 187.5 | 38 | 75 | 28 | 33 |
| 4 | 6 | Snoct2 + Sal | 170/24 | 187.0 | 32 | 90 | 29 | 28 |
| 2B | S1 (ESI) | SnBiph | 130/24 | 190.5 | 29 | 66 | 20 | 22 |
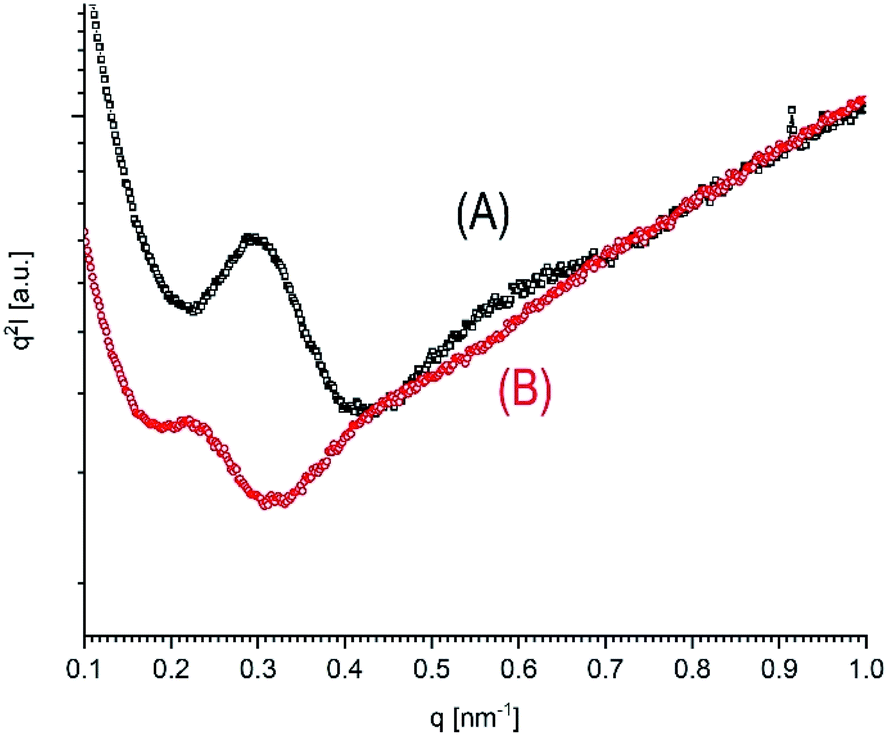 | ||
| Fig. 3 SAXS Kratky plot of polylactides prepared and annealed with SnBiph at 140 °C: (A) 2 d (No. 4, Table 3), (B) directly polymerized for 8 d (No. 6B, Table 3). | ||
Using literature data for Tm0 (215 °C)19 and for ρ (1.285 g cm−2)38 free surface energies of samples having Tm''s above 180 °C were calculated (Table 7), and σe values in the range of 19–35 mJ m−2 were obtained. For the four afore mentioned polylactides (No. 6, Table 3, No. 3 and 5, Table 5, No. 3B, Table S1†) it can indeed be seen that a lower lamellar thickness is combined with lower σe values, meaning a more perfect smooth surface. The σe values of this work have the same order of magnitude as reported by Tezuka and coworkers for their cyclic guest–host copolylactides (24–28 mJ m−2).17 They interpreted the low σe values of their cycles (relative to higher values of the linear counterparts) by a smooth surface mainly resulting from nearly identical loops containing the guest building blocks. This interpretation fits in with the afore-mentioned hypothesis of the authors that the formation of HTm crystals is partially due to smoothing of the surfaces by transesterification.
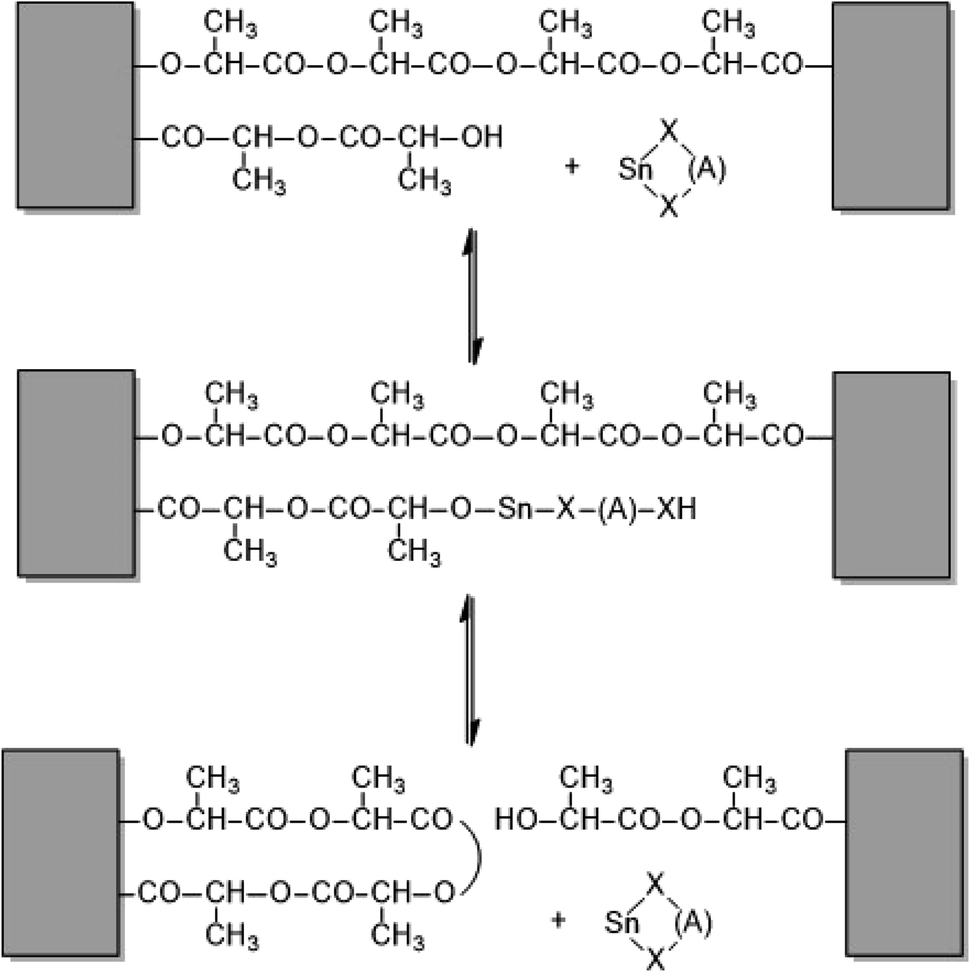
Thickness growth and “smoothing” can be explained by at least three types of transesterification reactions, which are catalyzed by the presence of a reactive catalyst:
(1) depolymerization (and polymerization) of large loops or chains sticking out from the surface of the crystallites,
(2) depolymerization (and chain growth) of linear chain ends, and
(3) cleavage of tie chains connecting neighbouring crystallites.
Schemes 2–4 and Fig. 4 present a simplified illustration of these transesterification processes. The driving force behind all these transesterification reactions is a gain in crystallization enthalpy. The “smoothing” of the surfaces and a removal of tie molecules enable, in turn, a more perfect 3-dimensional arrangement of the crystallites. This conclusion is confirmed by the 2nd order reflex in the SAXS measurements of samples annealed at 170 °C. Hence, the SAXS data and the extremely high degrees of crystallinity clearly support the hypothesis that “smoothing” of the crystallite surfaces plays an important role for the formation of HTm poly(L-lactide)s.
 | ||
| Scheme 3 Example of a transesterification reaction shortening (or lengthening) a linear chain sticking out from the surface of a crystallite. | ||
 | ||
| Scheme 4 Example of a transesterification reaction cleaving (or generating) a tie molecule. | ||
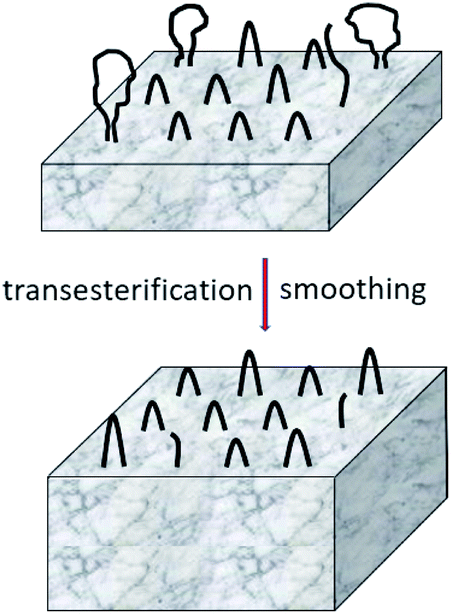 | ||
| Fig. 4 Simplified model of “smoothing” of lamellar surfaces combined with thickness growth. | ||
Optical microscopy
Numerous samples listed in Tables 1–3 and S1† were examined by optical microscopy regarding formation and size of spherulites. Samples annealed at 120 °C for 2 h did not display spherulites. The same negative result was obtained, when samples were annealed at 130 or 140 °C up to 4 d. However, when the annealing at 130 or 140 °C was extended, spherulites with a diameter in the range of 0.7–1.0 mm became detectable. After annealing at 170 °C for 1 or 2 d no spherulites were visible regardless of the Lac/Cat ratio. Yet when the annealing temperature was lowered to 160 °C, nice spherulites appeared having diameters of 1.5–2.0 mm. Unfortunately, these observations do not contribute much to a better understanding of the transformation of LTm into HTm crystallites.MALDI-TOF mass spectrometry
MALDI TOF mass spectrometry enables differentiation between cyclic and linear species, and between even and odd-numbered linear or cyclic polylactides. Hence, mass spectrometry is a powerful tool to detect and identify transesterification reactions in solid polylactides. Two examples for such an application have recently been published by the authors.39,40 The mass spectra of the SnBiph-catalyzed polylactides revealed the following trends. At relatively low temperatures of 130 °C and 140 °C the mass spectra remain unchanged up to 48 h but display a considerable transformation of cyclic into linear chains after annealing for 8 d (Fig. 5). At 160 and even more at 170 °C the transformation based on thermal side reactions is, of course faster as exemplarily illustrated in Fig. 6. After 1 d at 170 °C the peak pattern is similar to that obtained after 8 d at 140 °C (Fig. 6A) and after 2 d at 170 °C the peaks of cycles have almost completely disappeared (Fig. 6B) despite a low catalysts concentration (Lac/Cat ratio 4000/1).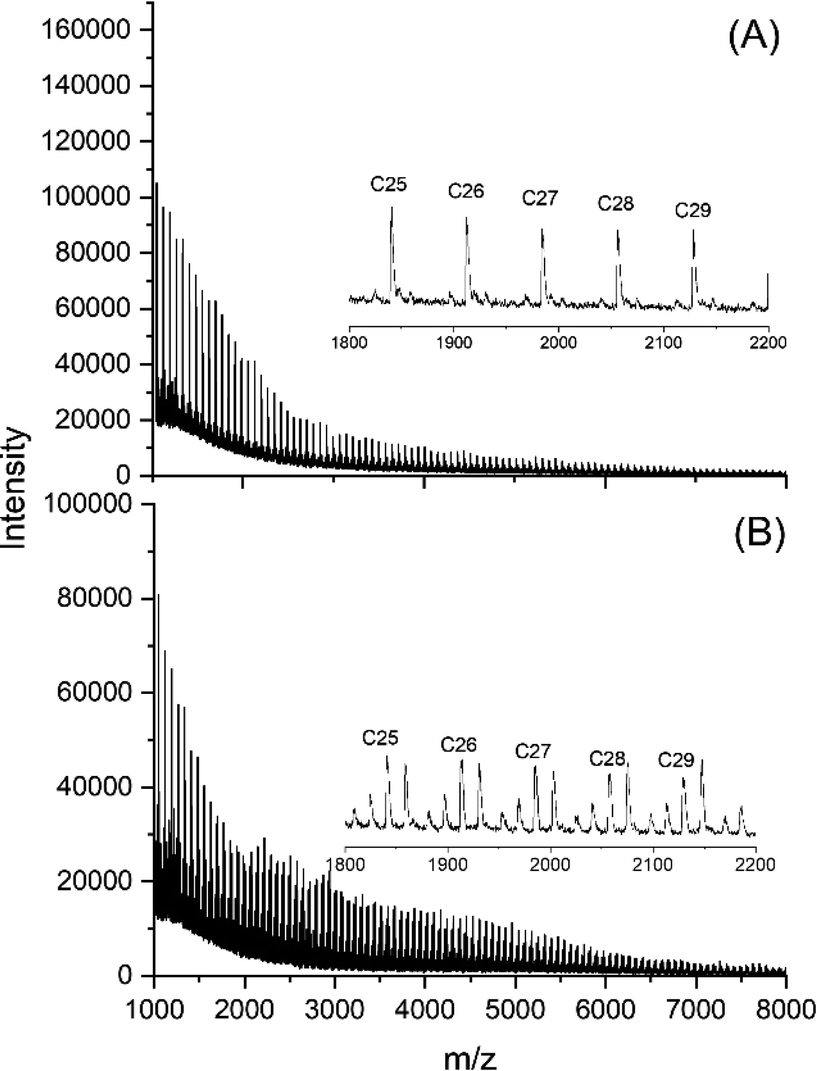 | ||
| Fig. 5 MALDI-TOF mass spectra of polylactides prepared and annealed with SnBiph: (A) at 140 °C/24 h (No. 3A, Table 3), (B) 140 °C/192 h (No. 6A, Table 3.). | ||
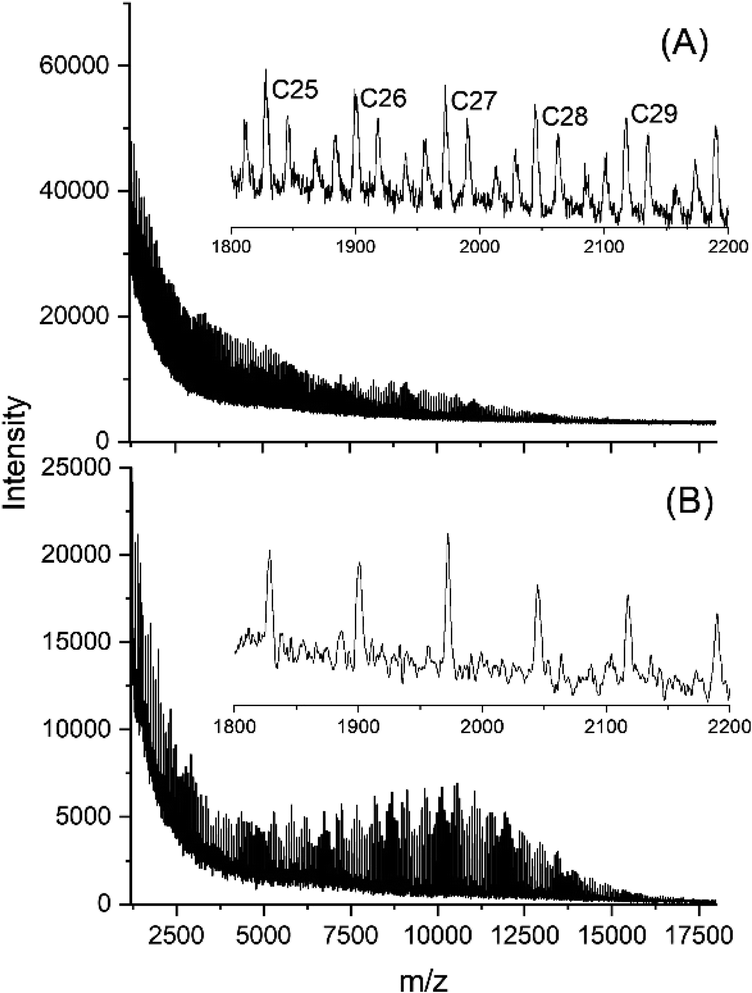 | ||
| Fig. 6 MALDI-TOF mass spectra of polylactides prepared and annealed with SnBiph: (A) 170 °C/24 h (No. 10, Table 1), (B) 170 °C/48 h (No. 11, Table 1). | ||
Taking into account the previous data of cyclic poly(L-lactide)s these observations indicate that high molar mass cyclic and linear chains can adopt the same high melting morphology with Tm values in the range of 193–196 °C in contrast to reports of other research groups.17,18,21 Yet another consequence of this finding concerns the calculation of the equilibrium Tm0 of perfect crystals (215 °C) as described by Kalb and Pennings.19 The present and previous20 experimental Tm values suggest that the extrapolated 215 °C are close to reality, whereas Tm0 values below 205 °C are certainly too low. For this conclusion it does not matter, whether cyclic or linear polylactides were investigated by Kalb et al.,19 as indicated by the above results and by the following consideration. Real crystallites of cycles and linear chains differ in the number of loops on the “flat” surface of the crystallites. Yet, for crystallites of infinite thickness this difference and its influence on Tm vanishes.
A second, quite unexpected trend resulted from the variation of the Lac/Cat ratio of the SnBiph catalyst (No. 5–11, Table 1). At a Lac/Cat ratio of 4000/1 (but not at 1000/1) a flat maximum of the peak intensities with characteristic fine structure appeared around m/z 11000 (Fig. 6A). This maximum and its fine structure became more pronounced after 48 h (Fig. 6B). The third trend was again formation of a new maximum in the distribution of peak intensities, when the three dibutyltin(IV) catalysts were used (Fig. 7 and S6, ESI†). Yet, in contrast to the SnBiph experiments, the new maximum appeared around m/z 5000–5500, the moiety of the maximum found for the SnBiph-catalyzed samples (Fig. 6). A new maximum around m/z 5500 was also found when SnOct2 + salicylic acid was used as catalyst (Fig. 8B).
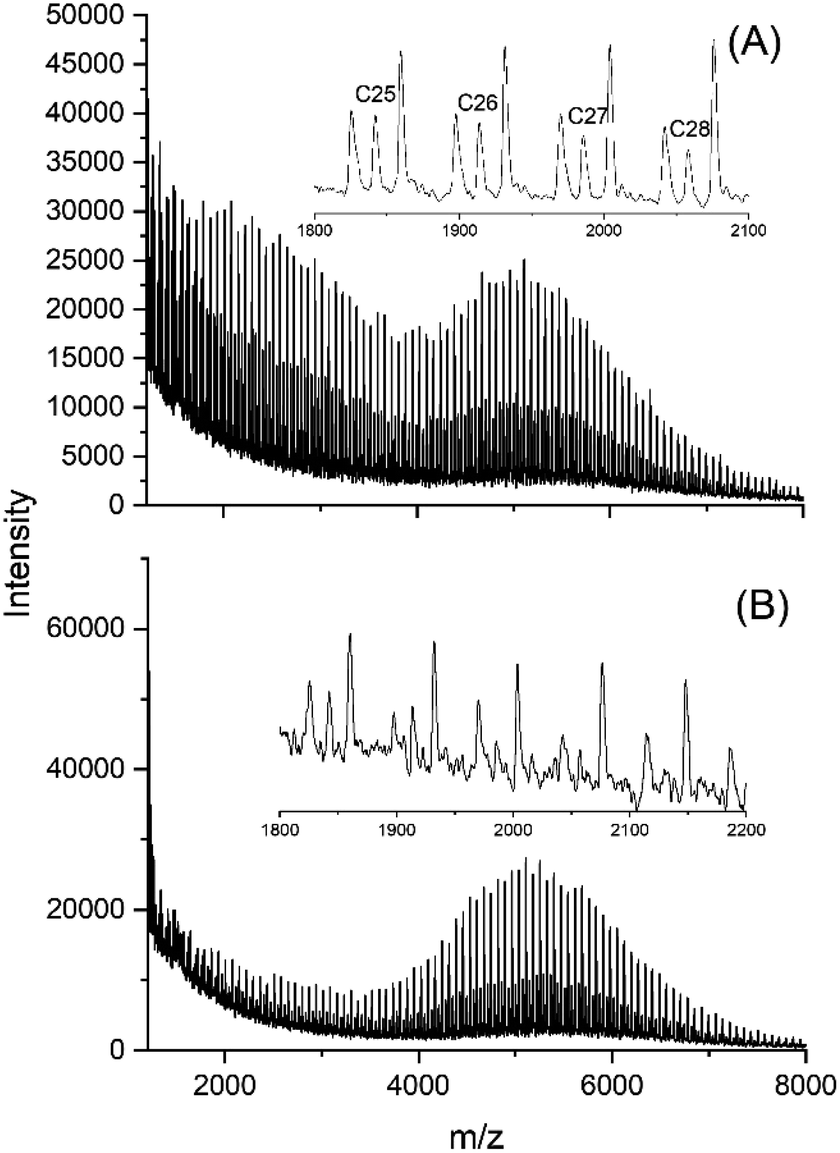 | ||
| Fig. 7 MALDI-TOF mass spectra of polylactides prepared and annealed with DSTL: (A) 170 °C/24 h (No. 4, Table 4), (B) 170 °C/48 h (No. 5, Table 4). | ||
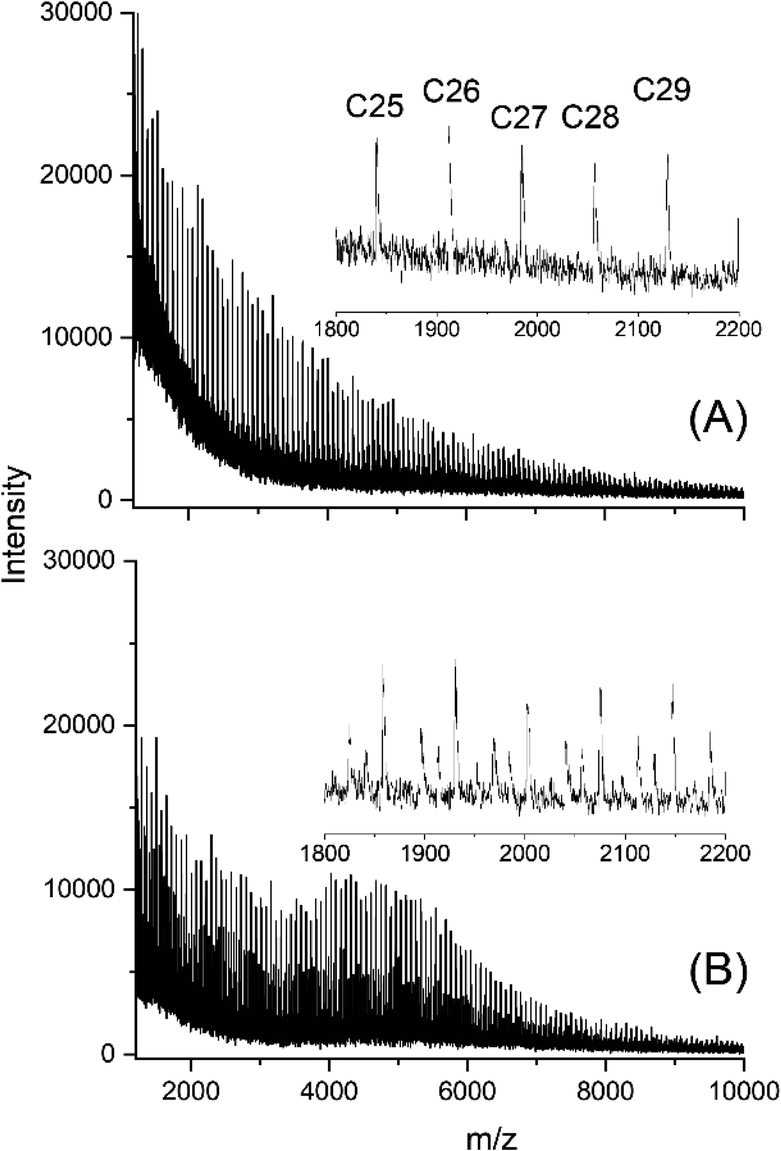 | ||
| Fig. 8 MALDI-TOF mass spectra of polylactides prepared and annealed with SnOct2 + salicylic acid: (A) 120 °C/2 h (No. 1, Table 6), (B) 170 °C/24 h (No. 4, Table 6). | ||
In other words, the mass spectra indicate the beginning of a total reorganization of molecular weight distribution. It is well known and quite logic that transesterification causes broadening of the molecular weight distribution (MWD) when the virgin polyester has narrow MWD (e.g. <1.5). In such cases the MWD tends to approach the “most probable distribution” known from Flory's analyses of polycondensates.41 Characteristic for his MWD is a maximum of the number distribution of cyclic or linear polymers at the first reaction product, usually a dimer or rarely a tetramer. A segment of such a distribution is illustrated in the mass spectrum of Fig. 8A. The formation of such a broader distribution is driven by a gain in entropy. Yet, the mass spectra displayed in Fig. 5–8 demonstrate formation of maxima in the MWD around m/z 5500 or 11000. Since equilibration (transesterification) reactions between polyester chains have a thermal character, a gain in crystallization enthalpy is the most likely explanation for this change. Since the fraction of molecules involved in the formation of a new maximum in the mass spectrum is small, an influence on the SEC elution curves may not be expected.
Conclusion
The results elaborated in this work allow for the following conclusions. First, transformation of LTm crystallites into HTm crystallites with Tm values > 190 °C is feasible, but requires an annealing temperature > 160 °C. Second, this transformation performed by annealing in absence of mechanical stress confirms that the HTm crystals represent the thermodynamically most stable crystalline phase of poly(L-lactide). Third, the most effective polymerization catalysts SnBi and BuSnBi gave the best results in terms of high Tm values and high degrees of crystallinity. Fourth, direct polymerization is the more efficient method for the preparation of HTm crystallites at reaction temperatures < 160 °C, whereas at 170 °C crystallization of the freshly prepared poly(L-lactide)s was not achieved. Therefore, the annealing method is superior at 170 °C. Fifth, the formation of HTm crystallites involves growth of the lamellar thickness by 250–350% during the first 24 h combined with more perfect 3d-order of the crystallites. Sixth, annealing at 170 °C is accompanied by degradation of the molecular weights, by transformation of cycles into linear chains, whereas the degree of crystallinity increases. Seventh, high molar mass linear and cyclic poly(L-lactide)s can reach the same high Tm values in the range of 130–196 °C. Eighth, the Tm0 (215 °C) and ΔHm0 (106 J g−1) of perfect crystallites reported by Kalb et al.,19 Tsuji et al.30 and Sarasua et al.29 are almost correct, whereas lower values reported by several research groups are too low Finally, the decrease of molecular weights and lamellar thickness is to some extent the result of a reorganization of the molecular weight distribution with a predominant formation of crystallites consisting of low molar mass rings and/or linear chains. In summary, in the presence of reactive transesterification catalysts, solid poly(L-lactide)s may be considered as a ‘living system’ with a slow but permanent progress of transesterification reaction entailing a change of various properties.Conflicts of interest
There are no conflicts to declare.Acknowledgements
The authors wish to thank Dr U. Mühlbauer (Thyssen-Uhde, Berlin) for kindly supplying the L-lactide and Mrs A. Myxa (BAM, Berlin) for all SEC measurements.Notes and references
- L. Gay-Lyssac and J. Pelouze, Liebigs Ann. Chem., 1833, 7, 40 Search PubMed.
- J. Pelouze, Liebigs Ann. Chem., 1845, 53, 116 CrossRef.
- C. E. Lowe, US Pat., 2 668 162, Du Pont, 1954 Search PubMed.
- E. E. Schmitt, US Pat., US 32397033, American Cyanamide, 1967 Search PubMed.
- A. K. Schneider, US Pat., 2 703 316, Ethicon Inc., 1971 Search PubMed.
- A. K. Schneider, Ger. Offen., 2162900, Chem. Abstr., Ethicon Inc., 1973, 76, 73051w Search PubMed.
- D. M. Bigg, presented in part at the Annual Technical Conference of the Society of Plastic Engineers, 1996 Search PubMed.
- M. L. Di Lorenzo, J. Appl. Polym. Sci., 2006, 100, 3145–3151 CrossRef CAS.
- K. Jamshidi, S. H. Hyon and Y. Ikada, Polymer, 1988, 29, 2229–2234 CrossRef CAS.
- J. J. Kolstad, J. Appl. Polym. Sci., 1996, 62, 1079–1091 CrossRef CAS.
- J. R. Dorgan, J. Janzen, M. P. Clayton, S. B. Hait and D. M. Knauss, J. Rheol., 2005, 49, 607–619 CrossRef CAS.
- P. DeSantis and A. J. Kovacs, Biopolymers, 1968, 6, 299–306 CrossRef CAS.
- B. Lotz, Adv. Polym. Sci., 2018, 279, 273–302 CrossRef.
- A. V. Prasad, L. P. Stubbs, M. Zhun and Y. H. Zhu, J. Appl. Polym. Sci., 2012, 123, 1568–1575 CrossRef CAS.
- E. J. Shin, A. E. Jones and R. M. Waymouth, Macromolecules, 2012, 45, 595–598 CrossRef CAS.
- G. Si, S. Zhang, W. Pang, F. Wang and C. Tan, Polymer, 2018, 154, 148–152 CrossRef CAS.
- N. Sugai, S. Asai, Y. Tezuka and T. Yamamoto, Polym. Chem., 2015, 6, 3591–3600 RSC.
- N. Zaldua, R. Liénard, T. Josse, M. Zubitur, A. Mugica, A. Iturrospe, A. Arbe, J. De Winter, O. Coulembier and A. J. Müller, Macromolecules, 2018, 51, 1718–1732 CrossRef CAS.
- B. Kalb and A. J. Pennings, Polymer, 1980, 21, 607–612 CrossRef CAS.
- H. R. Kricheldorf and S. M. Weidner, Polym. Chem., 2020, 11, 5249–5260 RSC.
- E. Louisy, G. Fontaine, V. Gaucher, F. Bonnet and G. Stoclet, Polym. Bull., 2020, 1–21 Search PubMed.
- H. R. Kricheldorf, S. M. Weidner and A. Meyer, Polym. Chem., 2020, 11, 2182–2193 RSC.
- H. R. Kricheldorf and S. M. Weidner, Macromol. Rapid Commun., 2020, 2000152 CrossRef CAS.
- H. R. Kricheldorf, S. Weidner and F. Scheliga, Polym. Chem., 2017, 8, 1589–1596 RSC.
- H. R. Kricheldorf, S. M. Weidner and F. Scheliga, Macromol. Chem. Phys., 2017, 218, 1700274 CrossRef.
- H. R. Kricheldorf and S. M. Weidner, Eur. Polym. J., 2018, 105, 158–166 CrossRef CAS.
- H. R. Kricheldorf, S. M. Weidner and F. Scheliga, Eur. Polym. J., 2019, 116, 256–264 CrossRef CAS.
- G. Benecke, W. Wagermaier, C. Li, M. Schwartzkopf, G. Flucke, R. Hoerth, I. Zizak, M. Burghammer, E. Metwalli and P. Müller-Buschbaum, J. Appl. Crystallogr., 2014, 47, 1797–1803 CrossRef CAS.
- J. R. Sarasua, N. L. Rodriguez, A. L. Arraiza and E. Meaurio, Macromolecules, 2005, 38, 8362–8371 CrossRef CAS.
- H. Tsuji, Macromol. Biosci., 2005, 5, 569–597 CrossRef CAS.
- E. Fischer, H. J. Sterzel and G. Wegner, Kolloid Z. Z. Polym., 1973, 251, 980–990 CrossRef CAS.
- L.-T. Lim, R. Auras and M. Rubino, Prog. Polym. Sci., 2008, 33, 820–852 CrossRef CAS.
- M. Pyda, R. Bopp and B. Wunderlich, J. Chem. Thermodyn., 2004, 36, 731–742 CrossRef CAS.
- S. M. Weidner, A. Meyer and H. R. Kricheldorf, Macromol. Chem. Phys., 2020, 221, 2000012 CrossRef CAS.
- G. Schwach, J. Coudane, R. Engel and M. Vert, J. Polym. Sci., Part A: Polym. Chem., 1997, 35, 3431–3440 CrossRef CAS.
- M. L. Di Lorenzo and R. Androsch, Synthesis, Structure and Properties of Poly (lactic acid), Springer, 2018 Search PubMed.
- H. R. Kricheldorf and S. M. Weidner, Eur. Polym. J., 2019, 119, 37–44 CrossRef CAS.
- T. Miyata and T. Masuko, Polymer, 1997, 38, 4003–4009 CrossRef CAS.
- S. M. Weidner and H. R. Kricheldorf, Macromol. Chem. Phys., 2017, 218, 1700114 CrossRef.
- S. M. Weidner and H. R. Kricheldorf, Macromol. Chem. Phys., 2018, 219, 1800445 CrossRef.
- P. J. Flory, Chem. Rev., 1946, 39, 137–197 CrossRef CAS.
Footnote |
| † Electronic supplementary information (ESI) available. See DOI: 10.1039/d0ra10012a |
| This journal is © The Royal Society of Chemistry 2021 |