 Open Access Article
Decontamination of dense nonaqueous-phase liquids in groundwater using pump-and-treat and in situ chemical oxidation processes: a field test
Tian Xie ab,
Zhi Danga,
Jian Zhangc,
Qian Zhangb,
Rong-Hai Zhangbd,
Chang-Jun Liaob and
Gui-Ning Lu*a
aInstitute of Environment and Energy, South China University of Technology, Guangzhou 510006, PR China. E-mail: GNLu@foxmail.com
bNational Technology Center, Guangxi Bossco Environmental Protection Technology Co Ltd, Nanning 530004, China
cInstitute of Light Industry and Food Engineering, Guangxi University, Nanning 53004, PR China
dCollege of Environmental Science and Engineering, Guilin University of Technology, Guilin 541006, PR China
First published on 21st January 2021
Abstract
Groundwater remediation is difficult because of the complexity of the treatment area and the presence of various pollutants, and it is difficult to achieve using a single process. A combined pump-and-treat (P&T) and in situ chemical oxidation (ISCO) system was used to remove dense nonaqueous-phase liquids (DNAPLs) from groundwater at the field scale in this study. The underground water pH, electrical conductivity, dissolved oxygen concentration, and SO42− concentration were used as indirect evidence of in situ chemical reactions. Groundwater remediation using the P&T-ISCO process using 1.5% sodium persulfate and 0.03% sodium hydroxide had a remarkable effect on DNAPLs, and the DNAPL diffusion distance was much higher under pumping conditions than under natural conditions. During groundwater remediation, the pollutant concentration positively correlated with the pH, electrical conductivity, and dissolved oxygen concentration and negatively correlated with the SO42− concentration. In summary, P&T-ISCO can effectively accelerate DNAPL degradation to give efficient groundwater remediation.
1. Introduction
Groundwater contamination with non-aqueous phase liquids and dense non-aqueous phase liquids (DNAPLs) poses one of the most difficult remediation challenges in the environmental engineering field.1 Water extraction occurs at almost all groundwater decontamination sites. Pump-and-treat (P&T) remediation often initially decreases the contaminant concentration in the extracted water, but then the concentration decreases only gradually over decades.2 Conventional P&T processes have a poor record in remediating DNAPL-contaminated aquifers because of the low water solubilities and aqueous diffusivities of DNAPLs.3 The hydrogeological characteristics of a field site (the electrical conductivity (EC), well performance, and contamination distribution) are critical to the performance of a P&T system.4 Cleaning up DNAPLs using P&T processes is challenging because DNAPLs tend to remain as a residue held in place by capillary pressure.1 Long plume tailing (back-diffusion) can release persistent pollutants through molecular diffusion after the primary source of contamination has been decreased.5Surfactant-enhanced remediation has been used to accelerate the solubilization and mobilization of DNAPLs during P&T processes.6 In situ bioremediation using a surfactant foam has been successfully used to mobilize and disperse trichloroethene (TCE), and a bioaugmentation technique was used to remediate the TCE in situ.7 Complete biological dechlorination of chlorinated compounds such as TCE, cis-1,2-dichloroethene, and vinyl chloride (VC) to achieve clean-up objectives takes years.8 The less-permeable zone continues to act as a source of groundwater contamination during the post-bioremediation phase.
In situ chemical oxidation (ISCO) is a remediation technique that was developed to clean up contaminated soil and groundwater in situ. Chemical oxidation is a quicker groundwater decontamination technique than bioremediation. Contaminated solids and groundwater have been remediated in situ using Fenton reagents,9 potassium permanganate,10,11 and persulfate.12 Pollutant degradation during short oxidation periods has been assessed in many laboratory and pilot-scale studies.9,13,14 However, few long-term studies of DNAPL remediation have been conducted.
Remediation using a P&T process has been combined with an advanced oxidation process to remove DNAPLs (e.g., TCE) in a post-extraction (aboveground) step.15 Oxidants such as persulfate used in ISCO have long-term slow oxidation effects on groundwater pollutants.16 This could help control back-diffusion after the expected oxidation period has ended. Persulfate has a half-life of weeks–months underground and is a promising oxidant for use in ISCO.17,18 Activated persulfate is a novel ISCO oxidant that has been combined with activation methods such as heating, adding transition metals ions, and creating alkaline conditions.19 The equations for persulfate activation are shown in eqn (1) and (2).20 Factors such as the pH, oxidation–reduction potential, and EC have been used to predict the mobilities, distributions, and reactivities of ISCO oxidants in the field.21
 | (1) |
 | (2) |
Five types of DNAPL pollutants were continually monitored at a test site during a P&T process for four months. The pollutant concentrations in the monitoring wells fluctuated soon after the P&T system was shut down, making it possible to determine the effect of the ISCO-enhanced P&T process at the pilot scale on back-diffusion of DNAPL pollutants.
The objective of this field-scale study was to evaluate the feasibility of using a P&T-ISCO process using sodium persulfate oxidation to remediate groundwater contaminated with DNAPL pollutants using sodium hydroxide as an alkaline agent.22 Indirect markers (the pH, EC, dissolved oxygen (DO) concentration, and SO42− concentration) were monitored, and a hydraulic dispersion simulation was performed to accurately evaluate the mobility and reactivity of persulfate in the field.
2. Materials and methods
2.1 Field site
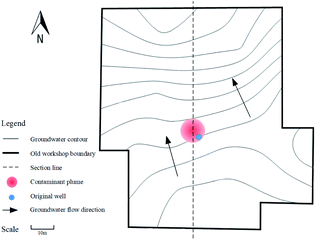
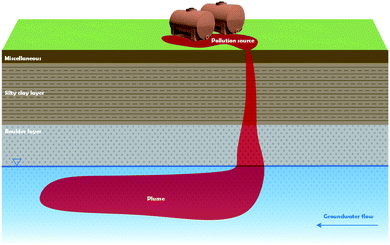
The test site was at a demolished chemical industrial complex in southern China. Improper disposal of chlorinated organic solvents and solid waste at the site over the past few decades has resulted in point-source pollution, and there are large amounts of DNAPLs in the aquifer. A small-scale point pollution plume of five types of DNAPL was remediated in this study.The pollution plume is shown schematically in Fig. 1 and 2. The pollution plume was in the middle of an old workshop, and the strata were, from top to bottom, miscellaneous, sill clay, boulders, and mudstone. The groundwater generally flows from southeast to northwest. The profile along the dashed line in Fig. 1 is shown in Fig. 2. Geological drilling and hydrogeological survey data indicated that the water level was 16.5 m below the surface, the aquifer was 20 m thick, the permeability coefficient was 1.0 × 10⁻² cm s−1, and the hydraulic gradient was 0.002. The VC, 1,1-dichloroethane (1,1-DCA), 1,2-dichloroethane (1,2-DCA), 1,1,2-trichloroethane (1,1,2-TCA), and TCE concentrations in original well were 3350, 59![[thin space (1/6-em)]](https://www.rsc.org/images/entities/char_2009.gif) 120, 965, 917, and 320 μg L−1, respectively. The well was seriously polluted and had good hydraulic connections, which was very useful for this study. Some wells for sampling monitoring would be set around it, and monitoring indicators included the pH, EC, DO, SO42− concentration, and the five pollutions concentration.
120, 965, 917, and 320 μg L−1, respectively. The well was seriously polluted and had good hydraulic connections, which was very useful for this study. Some wells for sampling monitoring would be set around it, and monitoring indicators included the pH, EC, DO, SO42− concentration, and the five pollutions concentration.
2.2 Methods
Various pollutants can be efficiently and cheaply degraded simultaneously using P&T techniques. ISCO can effectively remove refractory pollutants, but it is expensive to treat large plumes. Therefore, combining P&T and ISCO could be efficient and relatively cheap.| Phase | Implementation content |
|---|---|
| I | DNAPL pollutants were restored by P&T Technology, and the concentration of which was continuously monitored. Only when the level of contaminants tended to be stable could the extraction treatment be stopped |
| II | DNAPL pollutants were restored by P&T-ISCO Technology, the extraction treatment and in situ chemical oxidation injection were carried out simultaneously. The pollutant concentration, water quality parameters, and chemical diffusion were continuously monitored. After the pollutant concentration reached the target value and tended to be stable, the extraction treatment was stopped |
| III | The concentration of pollutants and SO42− were monitored continuously until the level of pollutants remained stable for 90 days |
| Name | Parameter |
|---|---|
| a The chemical demand was calculated using the Freundlich linear isothermal adsorption formula.23 | |
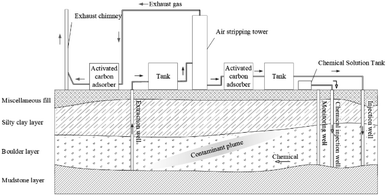
| Extraction well | The diameter was 250 mm and the flow was set as 60 m3 d−1 |
| tank | Two tanks of 70 m3 were set |
| Air stripping tower | Two stripping tower with a diameter of 1.8 m and a height of 5 m were set, equipped with roots fans with a charge of 3 kW and an air volume of 4.23 m3 min−1. The gas water ratio was 100, hydraulic retention time was 120 min, and temperature was 25 °C |
| Activated carbon adsorbers | Two activated carbon adsorbers for wastewater with a diameter of 1 m and a height of 1.3 m were set, and the diameter and height of the activated carbon adsorber for waste gas were 1 m and 1.25 m, respectively. The coal-based activated carbon should be controlled by the following factors: the specific surface area was greater than 900 m2 g−1, the adsorption rate of CCl4 was greater than 50%, the iodine value was more significant than 900 mg g−1, and the loading density distribution was in the range of 550–500 g L−1 |
| Injection well | The diameter was 250 mm and the reinjection flow was consistent with the extraction flow, which was set as 60 m3 d−1 |
| Chemical injection well | The diameter was 200 mm and the injection flow rate was regulated to meet the needs of simultaneous injection and no overflow |
| Chemical solution tank | Two chemical solution tanks of 10 m3 were set. 222.70 m3 of 1.5% sodium persulfate solution and 0.05% sodium hydroxide would be injected into the injection well |
| Monitoring well | The diameter was 250 mm |
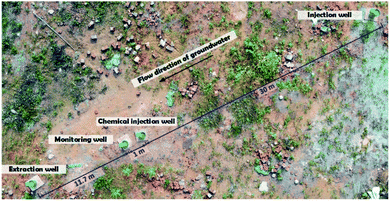 | ||
| Fig. 4 Locations of the wells used in the pump-and-treat and in situ chemical oxidation treatment tests. | ||
| Detection index | Purpose | Sampling time: buried depth (frequency) |
|---|---|---|
| a Analysis of water from the original well indicated that the vertical pollutant distribution was uneven and the highest pollutant concentrations were at 27 m deep. | ||
| Concentration of VC, 1,1-DCA, 1,2-DCA, 1,1,2-TCA, TCE | Analyse the changing trend of pollutants | Phase I: 27 m (every 15 days) |
| Phase II: 27 m (every two days) | ||
| Phase III: 27 m (every 15 days) | ||
| pH, DO, EC | Analyse the change of water quality parameters with injection | Phase II: 19, 22, 25, 27 m (every 2 days) |
| Concentration of Na2S2O8 | Reflect the diffusion of Na2S2O8 after injection | After Na2S2O8 injection: 27 m (every 2 hours) |
| Concentration of SO42- | Analyse whether there was secondary pollution | Phase II: 19, 22, 25, 27 m (every 2 days) |
| Phase III: 19, 22, 25, 27 m (every 15 days) | ||
Parameters including the pH, DO concentration, and EC were measured using an Orion Star A329 multi-meter (Thermo Fisher Scientific, Waltham, MA, USA) and flow-through cells. TCE and the DCAs were extracted by liquid–liquid extraction using hexane and were quantified using an Agilent 7890 gas chromatograph (Agilent Technologies, Santa Clara, CA, USA) equipped with an electron capture detector. Gas-phase compounds such as acetylene, ethane, ethylene, and VC were determined by placing liquid samples in headspace vials and allowing gas–liquid equilibrium to be reached, then analyzing the headspace gases using a gas chromatograph equipped with a flame ionization detector. The sulfate concentrations were determined using a Dionex ICS-5000 ion chromatograph (Thermo Fisher Scientific).
3. Results and discussion
3.1 DNAPL removal
| Name | Target value (μg L−1) | Time (d) | |||||||||
|---|---|---|---|---|---|---|---|---|---|---|---|
| 0 | 60 | 105 | 120 | 180 | 204 | 208 | 224 | 228 | 318 | ||
| VC | 90 | 3350 | 60 | 65 | 66 | 73 | 58 | 57 | 60 | 56 | 61 |
| 1,1-DCA | 565 | 59![[thin space (1/6-em)]](https://www.rsc.org/images/entities/char_2009.gif) 122 122 |
12![[thin space (1/6-em)]](https://www.rsc.org/images/entities/char_2009.gif) 701 701 |
915 | 864 | 1187 | 712 | 396 | 390 | 362 | 379 |
| 1,2-DCA | 147 | 964 | 141 | 116 | 104 | 107 | 101 | 97 | 93 | 100 | 94 |
| 1,1,2-TCA | 71 | 917 | 660 | 248 | 234 | 405 | 182 | 276 | 47 | 45 | 48 |
| TCE | 300 | 321 | 213 | 237 | 222 | 225 | 210 | 189 | 204 | 201 | 186 |
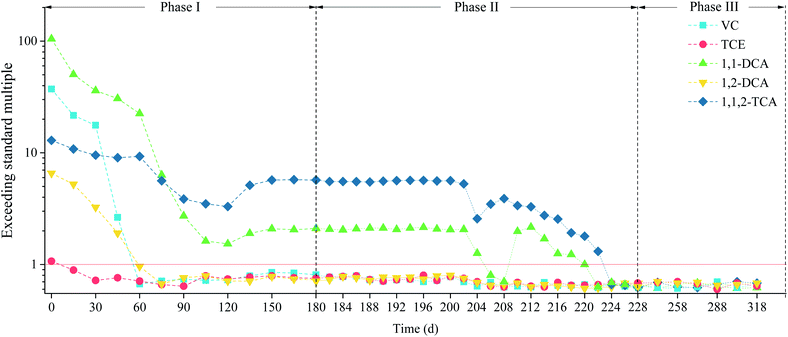 | ||
| Fig. 7 Dense nonaqueous-phase liquid concentrations exceeding the relevant standards during the 318 d operating period. | ||
The 1,2-DCA, TCE, and VC concentrations reached the target values on the 60th day. The 1,1-DCA and 1,1,2-TCA concentrations had decreased by 21.5% and 71.9%, respectively, but the ESMs were still high (22.48 and 9.29, respectively). The initial VC and 1,2-DCA concentrations were relatively low, and the target value was easily reached. The boiling point of VC is −13.8 °C, so VC could readily be separated as a gas from the liquid phase at the stripping temperature of 25 °C.
The P&T process was unable to bring the 1,1-DCA and 1,1,2-TCA concentrations to the target values by the 120th day, and the ESMs at that point were 1.53 and 3.30, respectively. The 1,1-DCA concentration decreased at a markedly higher rate than the 1,1,2-TCA concentration. The high initial concentration meant that the 1,1-DCA and 1,1,2-TCA removal rates were proportional to the Henry's law coefficients (0.0059 and 0.0012, respectively).27–29 This meant that 1,1-DCA was separated from the water more efficiently than 1,1,2-TCA.
The P&T process was stopped from the 120th to the 180th day. The concentrations of the five pollutants increased and became stable, and the 1,2-DCA, TCE, and VC concentrations (which had reached the target values) remained below the target values. Increasing pollutant concentrations after treatment stops is a common phenomenon in P&T processes.30 This is because the aquifer will contain large amounts of pebbles, coarse sand, and loose sediment with large specific surface areas31,32 and adsorption and desorption strongly affects the removal of pollutants at high concentrations.33 It was therefore particularly important to perform follow-up processing and ISCO.
The test well was well connected to the aquifer, so the pollutant concentrations were stable from the 180th to the 200th days and were not affected by the two-day pre-pump episodes.
Large amounts of pharmaceuticals entered the aquifer between the 202nd and 210th days, and the pollutant concentrations in the groundwater decreased sharply. Convection and diffusion then caused the pollutants gradually to become uniformly distributed throughout the groundwater environment.
After the 212nd day, the 1,1-DCA and 1,1,2-TCA curves both followed downward trends. The 1,1-DCA and 1,1,2-TCA ESMs were 2.16 and 3.29, respectively, but the 1,1-DCA concentration was much higher than the 1,1,2-TCA concentration, and 1,1-DCA reached the target value earlier than 1,1,2-TCA. The pollutant concentration fell below the target value by the 224th day.
The concentrations of the five pollutants fluctuated over time during the remediation process. This would have been because the density of all five DNAPLs was greater than water and would have been unevenly distributed in the aquifer.34,35 It would also have been caused by transformations between halogenated organic compounds.36–38 These factors would have caused small changes in the pollutant concentrations.
The results described above indicated that the P&T process directly affected various DNAPLs. The P&T process brought the concentrations of three pollutants down to meet the target values in 120 d. The 1,1,2-TCA and 1,1-DCA ESMs had decreased by 78.5% and 28.6%, respectively, by the 120th day. The ISCO process combined with the P&T process was very efficient and appropriate, and the 1,1,2-TCA and 1,1-DCA concentrations reached the target values within 22 d of the oxidant being added. In summary, to use the P&T-ISCO process, the phase I duration should be set according to the difficulty of degrading the pollutants present. In particular, the phase I period should be prolonged as appropriate when there are many pollutants and the pollutant concentrations are much higher than the target values. The amount of oxidant added should be increased when the pollutant concentrations increase in phase II to ensure that the pollutants are effectively degraded.
3.2 Water quality parameters
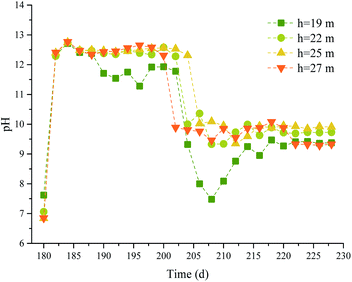
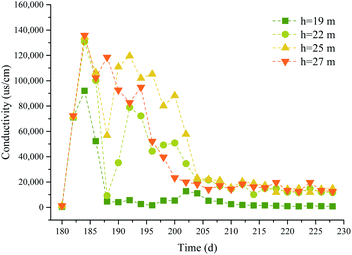
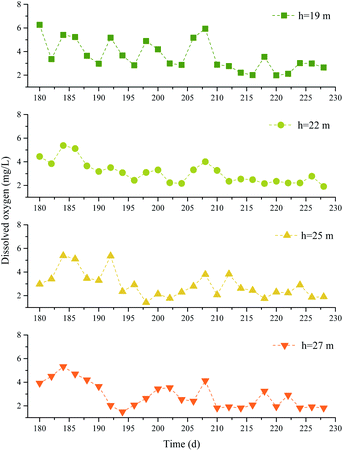
In phase II, the effect of Na2S2O8 activated by NaOH on the removal of pollutants was affected by the groundwater environment.39 The pH, DO concentration, and EC were monitored at different depths, and the results are shown in Fig. 8–10.It can be seen from the figures that the groundwater at different depths in the test well before the chemical was injected had pH values of 6.85–7.62, ECs of 326–1293 μS cm−1, and DO concentrations of 2.98–6.26 mg L−1. After 0.05% NaOH was added to the test well, the pH of the groundwater in the test well increased, reaching a maximum of pH 12.65 at 27 m deep. The ECs also increased sharply, and the maximum ECs at 19, 22, 25, and 27 m deep were 9.20 × 10³, 1.31 × 10⁵, 1.34 × 10⁵, and 1.36 × 10⁵ μS cm−1, respectively. The DO concentrations fluctuated. After 1.5% Na2S2O8 was added to the test well, the pH values first decreased and then became stable in the range pH 9.33–9.93. The ECs fluctuated and became stable after 206 d. The ECs on the 222nd day at 19, 22, 25, and 27 m deep were 734, 11![[thin space (1/6-em)]](https://www.rsc.org/images/entities/char_2009.gif) 640, 14
640, 14![[thin space (1/6-em)]](https://www.rsc.org/images/entities/char_2009.gif) 840, and 12
840, and 12![[thin space (1/6-em)]](https://www.rsc.org/images/entities/char_2009.gif) 500 μS cm−1, respectively. The DO concentrations decreased over time, and the concentrations at 19, 22, 25, and 27 m deep were 57.7%, 57.1%, 35.9%, and 53.6% lower, respectively, than before the Na2S2O8 was added.
500 μS cm−1, respectively. The DO concentrations decreased over time, and the concentrations at 19, 22, 25, and 27 m deep were 57.7%, 57.1%, 35.9%, and 53.6% lower, respectively, than before the Na2S2O8 was added.
Correlations between the parameters and the ESMs for 1,1-DCA and 1,1,2-TCA were assessed using SPSS software (IBM, Armonk, NY, USA). The Pearson correlation coefficients are shown in Table 5. For 1,1-DCA, the EC positively correlated with the ESM. For 1,1,2-TCA, the EC extremely positively correlated with the ESM. For 1,1,2-TCA, the pH and DO concentration positively correlated with the ESM.
| Parameter | 1,1-DCA | 1,1,2-TCA |
|---|---|---|
| a ** means that the correlation coefficient was significant at the 1% level, * means that the correlation coefficient was significant at the 5% level. | ||
| pH | 0.36 | 0.467* |
| EC | 0.447* | 0.556** |
| DO | 0.23 | 0.496* |
The groundwater pH directly affected the chemical oxidant reactivity, the DO concentration determined the activity and activation ability of the water and gases, and the EC correlated strongly with the ion concentrations.40,41 The pollutant concentrations decreased as the pollutants reacted with Na2S2O8, and the free energy at the interface of the chemical system and the diffusion capacity decreased, so the EC and DO concentration in the groundwater became less variable. The pH, EC, and DO concentration eventually became stable when the Na2S2O8 was consumed and the reaction was completed because of groundwater excretion and recharge. In summary, the pH, EC, and DO concentration were closely related to the ESMs of the pollutants.
3.3 Hydraulic dispersion
Migration of S2O82− in the aquifer was simplified to a two-dimensional dispersion problem in a one-dimensional stable flow field42 and the analytical expression of the S2O82− concentration in the observation well at (x0, y0) could be written
 | (3) |
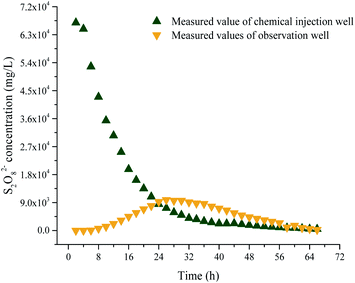
The S2O82− concentrations at (0,0) and (1,0) were determined. The data were processed using eqn (3), and a curve was fitted to give the parameters αL, αT, u, and λ. The M value was 3768 mg m−1, n was 0.37, and αL, αT, u, and λ were 0.17 m, 0.035 m h−1, 0.009, and 0.02 m, respectively. The relationships between the S2O82− concentration and time in the chemical injection well and the observation well are shown in Fig. 11.
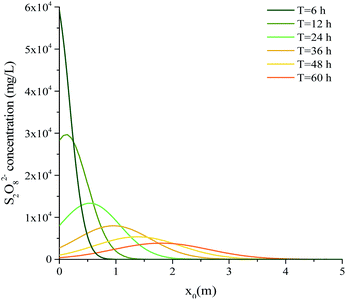
These parameters were processed using eqn (3), and the S2O82− diffusion distances under pumping and natural conditions are shown in Table 6. The relationship between the S2O82− concentration and x0 is shown in Fig. 12.
| Time (h) | The diffusion distance (m) | |
|---|---|---|
| Pumping condition (u = 0.035 m h−1) | Natural condition (u = 0.0041 m h−1) | |
| 6 | 1.17 | 0.20 |
| 12 | 1.85 | 0.40 |
| 24 | 2.92 | 0.70 |
| 36 | 3.83 | 0.93 |
| 48 | 4.67 | 1.14 |
| 60 | 5.45 | 1.33 |
It can be seen from Fig. 12 that the maximum S2O82− concentration decreased as time increased and the S2O82− concentration decreased markedly as the diffusion distance increased. After 24 h, the maximum concentration was <20% of the initial concentration. The S2O82− consumption rate in the groundwater was therefore very high and should have been sufficient for S2O82− injection to cause effective diffusion and ensure remediation. It can see from Table 6 that the S2O82− diffusion distances under pumping and natural conditions were 1.17–5.45 and 0.20–1.33 m, respectively. In other words, the diffusion distance was 3.1–5 times higher under pumping conditions than natural conditions and the S2O82− diffusion distance was much higher at the pumping velocity than at the natural speed. ISCO was therefore enhanced by increasing the flow rate.
In practice, ISCO often requires large investments of time and money.43,44 Slow chemical diffusion also causes high chemical concentrations in the local groundwater-soil environment. As mentioned above, the P&T-ISCO process could cause a fast and stable groundwater flow field to form and could increase the migration speeds of chemicals through hydraulic drive. This would cause the distances chemicals would diffuse and the effective scope to increase, meaning the groundwater remediation efficiency would be considerable.
The P&T-ISCO process gave a higher remediation efficiency and shorter remediation time than the ISCO process. The advantages of the ISCO process were retained and the side effects were weakened, so the P&T-ISCO process was much more efficient than the ISCO process.
3.4 SO42− variations
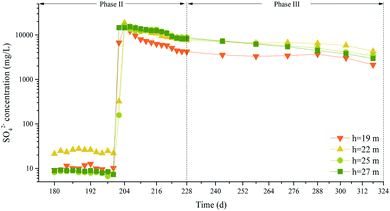
The P&T-ISCO process strongly positively affected groundwater remediation, but the high SO42− concentration remaining in the groundwater after remediation meant that temporal variations in the SO42− concentrations needed to be assessed.It can be seen from Fig. 13 that, from the 200th to the 204th days, the SO42− concentration increased almost linearly after Na2S2O8 was injected and that the maximum SO42− concentrations at 19, 22, 25, and 27 m deep were 1.58 × 10⁴, 1.86 × 10⁴, 1.68 × 10⁴, and 1.45 × 10⁴ mg L−1, respectively. As the reaction proceeded, the SO42− concentrations at different depths first decreased and then gradually stabilized. The SO42− concentration at 19 m decreased most markedly. When Na2S2O8 was activated by NaOH, the S2O82− concentration decreased as the pollutants decomposed and the SO42− concentration increased. During the chemical oxidation process, the SO42− concentration negatively correlated with the contaminant concentrations.
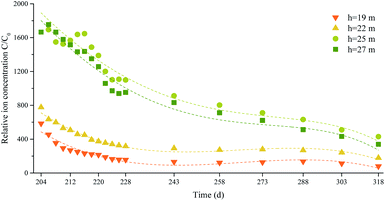
For the samples from different depths, the mean SO42− concentration between days 180 and 200 was used as the initial concentration C0, the SO42− concentration at another time was labeled C, and the relative SO42− concentration was expressed as C/C0. Regression analysis of the SO42− concentration over time was performed using SPSS software. The correlation coefficients for the models decreased in the order polynomial model, power function model, compound model, exponential model, logarithmic model, linear model, meaning the polynomial model fitted the data better than the other models. Even though the polynomial model fitted the data best (had a correlation coefficient R closest to 1), the serious variations in the high-order model at the end of the data interval meant that the model was not suitable for making predictions. The third-order polynomial fitting model was therefore used to decrease the sensitivity of the model to small variations in the data. The curves are shown in Fig. 14 and the curve fitting equation parameters are shown in Table 7.
| Groundwater depth | Fitting equation: C/C0 = −A1t3 + A2t2 + A3t + B | Correlation coefficient R | |||
|---|---|---|---|---|---|
| A1 | A2 | A3 | B | ||
| 19 m | −3.49 × 10⁶ | 2.54 × 10⁶ | −6.16 × 10⁶ | 4.97 × 10⁶ | 0.910 |
| 22 m | −3.89 × 10⁶ | 2.83 × 10⁶ | −6.85 × 10⁶ | 5.53 × 10⁶ | 0.973 |
| 25 m | −3.87 × 10⁶ | 2.82 × 10⁶ | −6.91 × 10⁶ | 5.62 × 10⁶ | 0.936 |
| 27 m | −4.28 × 10⁶ | 3.13 × 10⁶ | −7.63 × 10⁶ | 6.21 × 10⁶ | 0.967 |
According to the correlation coefficient test table,45 the number of degrees of freedom was 6, and the minimum R values at the confidence levels of 0.10, 0.05, and 0.01 were 0.62149, 0.70673, and 0.83434, respectively. It can be seen from Table 7 that the third-order fitting correlation coefficients for 19, 22, 25, and 27 m deep were 0.910, 0.973, 0.936, and 0.967, respectively. These R values were all higher than the minimum R value. The third-order polynomial equation fitted the data well, and some curves partly predicted variability in the SO42− concentration. The relative SO42− concentration in groundwater decreased slowly over time.
High SO42− concentrations after remediation using ISCO groundwater processes have concerned many researchers. In many ISCO processes, sodium persulfate is activated using an alkali, potassium permanganate, a Fenton reagent, or ozone. All of these oxidizing chemicals give good remediation effects. However, ozone is expensive to produce in practice, potassium permanganate will markedly increase the MnO4− concentration in groundwater, Fenton reagents will harm the soil environment at very low pH values and add large amounts of ferrous ions, and sodium persulfate activated by an alkali will leave large numbers of SO42− ions. Our results and the results of many previous studies indicate that the large numbers of SO42− ions remaining in groundwater after using sodium persulfate activated using an alkali will not be readily degraded because they will be involved in few chemical reactions. However, dilution, recharging, excretion, and biological activities in groundwater will slowly decrease the SO42− concentration in groundwater decreases. The SO42− concentration will usually return to the concentration before remediation after 6 months. Using sodium persulfate activated using an alkali will not generally cause long-term adverse effects on the environment and offers more advantages than other oxidizing agents in practice.
4. Conclusions
The removal of DNAPLs from groundwater using combined P&T and ISCO processes was studied, and variations in the pH, EC, DO concentration, and SO42− concentration were assessed. The practical use of the P&T-ISCO process was simulated. The results are summarized below.(1) The effect on groundwater remediation of P&T-ISCO using 1.5% sodium persulfate and 0.05% sodium hydroxide was remarkable. As the DNAPL concentrations decreased the pH, EC, and DO concentration tended to become stable and ESM was strongly related to these parameters.
(2) The reaction–diffusion of oxidants and DNAPLs in groundwater was similar to two-dimensional dispersion in a one-dimensional steady flow field. The vertical and horizontal distributions in the aquifers were 0.17 and 0.02 m, respectively. The P&T-ISCO process increased the migration speed through hydraulic driving, which was conducive to diffusion of the chemicals.
(3) During the groundwater restoration process, the SO42− concentration negatively correlated with the pollutant concentration. A cubic polynomial curve was fitted to the relative SO42− concentration. The correlation coefficient R was higher than the critical value, and the curve fitted the data better than the other models that were used. The relative SO42− concentration decreased slowly over time after the groundwater remediation process was stopped.
Conflicts of interest
The authors declare there is no conflicts of interest regarding the publication of this paper.Acknowledgements
This research was supported by the Science and Technology Major Project of Guangxi (No. AB18281002) and Natural Science Foundation of Guangxi Province (2019GXNSFAA185019).Notes and references
- T. Oolman, S. T. Godard, G. A. Pope, M. Jin and K. Kirchner, Groundwater Monit. Rem., 2010, 15, 125–137 CrossRef.
- D. M. Mackay and J. A. Cherry, Environ. Sci. Technol., 1989, 23, 630–636 CrossRef CAS.
- K. S. Udell, D. G. Grubb and N. Sitar, Cent. Eur. J. Public Health, 1995, 3, 67–76 CAS.
- S. Suthersan, E. Killenbeck, S. Potter, C. Divine and M. LeFrancois, Ground Water Monit. Rev., 2015, 35, 23–29 CAS.
- F. Tatti, M. P. Papini, V. Torretta, G. Mancini, M. R. Boni and P. Viotti, J. Contam. Hydrol., 2019, 222, 89–100 CrossRef CAS.
- R. W. Wunderlich, J. C. Fountain and R. E. Jackson, J. Soil Contam., 1992, 1, 361–378 CrossRef CAS.
- R. K. Rothmel, R. W. Peters, E. St. Martin and M. F. DeFlaun, Environ. Sci. Technol., 1998, 32, 1667–1675 CrossRef CAS.
- A. A. Haluska, C. E. Schaefer, J. Cho, G. M. Lavorgna and M. D. Annable, J. Contam. Hydrol., 2019, 103516, DOI:10.1016/j.jconhyd.2019.103516.
- R. J. Watts and A. L. Teel, J. Environ. Eng., 2005, 131, 612–622 CrossRef CAS.
- X. D. Li and F. W. Schwartz, J. Contam. Hydrol., 2004, 68, 269–287 CrossRef CAS.
- X. D. Li and F. W. Schwartz, J. Contam. Hydrol., 2004, 68, 39–53 CrossRef CAS.
- A. Tsitonaki, B. Petri, M. Crimi, H. Mosbaek, R. L. Siegrist and P. L. Bjerg, Crit. Rev. Environ. Sci. Technol., 2010, 40, 55–91 CrossRef CAS.
- J. D. Bryant and J. T. Wilson, Remediation J., 2010, 9, 13–25 CrossRef.
- R. Baciocchi, L. D'Aprile and I. Innocenti, J. Cleaner Prod., 2014, 77, 47–55 CrossRef CAS.
- A. K. Boal, C. Rhodes and S. Garcia, Ground Water Monit. Rev., 2015, 35, 93–100 CrossRef CAS.
- S. H. Liang, C. M. Kao, Y. C. Kuo, K. F. Chen and B. M. Yang, Water Res., 2011, 45, 2496–2506 CrossRef CAS.
- ITRC, Overview of Groundwater Remediation Technologies for MTBE and TBA, The Interstate Technology & Regulatory Council, 2005 Search PubMed.
- ITRC, Technical and Regulatory Guidance for In Situ Chemical Oxidation, The Interstate Technology & Regulatory Council, 2005 Search PubMed.
- A. Long, Y. Lei and H. Zhang, Prog. Chem., 2014, 26, 898–908 CAS.
- C. Liang and C. J. Bruell, Ind. Eng. Chem. Res., 2008, 47, 2912–2918 CrossRef CAS.
- D. W. Elliott and W. X. Zhang, Environ. Sci. Technol., 2001, 35, 4922–4926 CrossRef CAS.
- C. Liang and Y. Y. Guo, Water, Air, Soil Pollut., 2012, 223, 4605–4614 CrossRef CAS.
- J. Kuo, Practical Design Calculations for Groundwater and Soil Remediation, CRC Press, 2nd edn, 2014 Search PubMed.
- Technical Guideline for Site Soil and Groundwater Sampling of Volatile Organic Compounds HJ 1019-2019.
- Technical guidelines for risk assessment of contaminated sites HJ 25.3-2014.
- Standard for groundwater quality GBT 14848-2017.
- J. H. Smith, D. C. Bomberger and D. L. Haynes, Environ. Sci. Technol., 1980, 14, 1332–1337 CrossRef CAS.
- S. Pradhan, P. Kumar and I. Mehrotra, J. Environ. Eng., 2016, 142, 04016034 CrossRef.
- H. U. So, D. Postma, M. L. Vi, T. K. T. Pham, J. Kazmierczak, V. N. Dao, K. Pi, C. B. Koch, H. V. Pham and R. Jakobsen, Geochim. Cosmochim. Acta, 2018, 225, 192–209 CrossRef.
- A. T. Besha, D. N. Bekele, R. Naidu and S. Chadalavada, Environ. Technol. Innov., 2017, 9, 303–322 CrossRef.
- D. Oconnor, D. Hou, Y. S. Ok, Y. Song, A. K. Sarmah, X. Li and F. Tack, J. Controlled Release, 2018, 283, 200–213 CrossRef CAS.
- P. Min, Environ. Eng., 2017, 35, 6–10 Search PubMed.
- M. A. Guilbeault, B. L. Parker and J. A. Cherry, Ground Water, 2005, 43, 70–86 CrossRef CAS.
- C. Power, J. I. Gerhard, P. Tsourlos, P. Soupios, K. Simyrdanis and M. Karaoulis, J. Appl. Geophy., 2015, 112, 1–13 CrossRef.
- P. M. Jeffers and N. L. Wolfe, Environ. Toxicol. Chem., 1996, 15, 1066–1070 CAS.
- H. F. Stroo and C. H. Ward, Environmental Remediation Technology, 2010 Search PubMed.
- J. L. Liu, W. Lu, F. J. Zhang, X. S. Su and C. Lü, Environ. Sci., 2015, 35, 2677–2681 CAS.
- L. Chen, X. Hu, T. Cai, Y. Yang, R. Zhao, C. Liu, A. Li and C. J. Jiang, Chem. Eng. J., 2019, 369, 344–352 CrossRef CAS.
- A. Taylor, N. Zrinyi, S. P. Mezyk, J. M. Gleason, L. Mackinnon, A. Przepiora and A. L. Pham, Water Res., 2019, 162, 78–86 CrossRef CAS.
- A. Santos, J. Fernandez, S. Rodriguez, C. M. Dominguez, M. A. Lominchar, D. Lorenzo and A. Romero, Sci. Total Environ., 2018, 615, 1070–1077 CrossRef CAS.
- S. H. Liang, C. M. Kao, Y. C. Kuo, K. Chen and B. M. Yang, Water Res., 2011, 45, 2496–2506 CrossRef CAS.
- X. Yu-Qun, Z. Xue-Chun and W. Ji-Chun, Groundwater Dynamics, Geological Publishing House, Beijing, PRC China, 1997 Search PubMed.
- Y. Ji, L. Wang, M. Jiang, J. Lu, C. Ferronato and J. Chovelon, Water Res., 2017, 123, 249–257 CrossRef CAS.
- F. J. Krembs, R. L. Siegrist, M. Crimi, R. Furrer and B. G. Petri, Ground Water Monitoring Remediation Journal, 2010, 30, 42–53 CrossRef.
- M. A. Lominchar, D. Lorenzo, A. Romero and A. Santos, J. Chem. Technol. Biotechnol., 2018, 93, 1270–1278 CrossRef CAS.
| This journal is © The Royal Society of Chemistry 2021 |

