DOI:
10.1039/D0RA10008K
(Paper)
RSC Adv., 2021,
11, 5815-5831
Engineering defect clusters in distorted NaMgF3 perovskite and their important roles in tuning the emission characteristics of Eu3+ dopant ion†
Received
26th November 2020
, Accepted 21st January 2021
First published on 2nd February 2021
Abstract
An attempt has been made to explore various new defect clusters in distorted NaMgF3 perovskite and their important role in tuning optical properties. We have tried to tailor the defect clusters and to understand the impact on the luminescence of the lanthanide, for example the Eu3+ ion. Defect engineering has been carried out by doping aliovalent dopant ions to create a charge imbalance in the matrix, which in turn led to the creation of various mono-, di- and new cluster vacancies. Such vacancies have been characterized by Electron Para-magnetic Resonance (EPR), Positron Annihilation Lifetime Spectroscopy (PALS) and Photoluminescence (PL) studies. The PALS data of both undoped and Eu3+ doped compounds confirmed that in addition to Mg mono vacancies, cluster vacancies with different configurations comprising Mg, Na and F atom vacancies also exist in the matrix. The PL study revealed that depending on the surrounding defect structure, three different types of Eu3+ components can be created. The position of the Eu3+ ion with respect to these cluster vacancies determines the respective emission profiles and the decay kinetics. It has been found that when Li+ ions are co-doped with Eu3+, there is a sudden change in the decay kinetics and the emission profiles. The PALS study revealed that Li+ co-doping modified the configuration of the vacancy clusters, which in turn changes the emission characteristics. The EPR study confirmed the presence of different types of F-centers (F, F2, etc.) which are responsible for the host emission. Overall, this new study will be very helpful for a detailed understanding of the defect structures, in particular the cluster vacancies in distorted NaMgF3 perovskite, which have a direct or indirect impact on many physical properties.
1. Introduction
Lighting materials are an in-demand topic in materials science, in particular the lanthanide based light-emitting diodes (LEDs).1–3 There is high demand for highly luminescent red phosphors for phosphor converted white light emitting diodes (WLEDs). Eu3+-doped phosphors are well-suited for this because of the intense red emission emanating from their 4f → 4f transition, characterized by good quantum efficiency and high color purity. An intense red-emitting phosphor also helps to avoid limitations such as a high correlated-color-temperature (CCT > 5500 K) and low color rendering index (CRI) in WLEDs.4,5 Thus highly luminescent red phosphor is much required for phosphor converted white LEDs in addition to its own application as a red phosphor material. In the case of dopant induced red emission, Eu3+ doped phosphors are well-suited because of their narrow and intense red emission between 605 and 630 nm along with their high quantum efficiency.6 They also give high color purity over other phosphors.7 Further the red colored Electric Dipole (ED) transition (i.e. 5D0 → 7F2 transitions) of the Eu3+ ion at ∼615 nm is very sensitive to the surrounding local structure and thus the Eu3+ ion is being widely exploited as a probe for site symmetry.8–10
AMF3 (A = K, Na, Li; M = divalent-metal) perovskite class of complex metal fluorides compounds are an important class of inorganic functional materials with many interesting optical and magnetic properties, which led to their potential applications in many areas such as luminescent materials, pressure and gas sensor materials, radiation detectors, optical laser materials, optoelectronics, medical applications and so on.11–14 In addition, the very low phonon energy of fluorides based compounds make them ideal hosts to design rare earth doped fluoride based down-conversion phosphors materials.15,16 Generally in the perfect cubic perovskite structure (ABX3), there is an corner sharing of BX6 octahedron and the hole created by these octahedron is occupied by the A cations, which are surrounded by 12 X anions. However, when A and X atom differs significantly in size, the structure becomes distorted to a lower symmetry and results in tilting of the octahedron. Sometimes due to structural distortion there is a significant change in the metal–halide bond length or halide–metal–halide bond angles, which leads to formation of defect related color centers.17
Among AMF3 (A = K, Na; M = Mg) class of fluoride based perovskite compounds KMgF3 is reported to have cubic perovskite structure. On the contrary NaMgF3 has distorted perovskite structure18 wherein MgF6 octahedrons are tilted and not aligned on a perfect line as shown in Fig. 1a. AMF3 based compounds are always associated with anionic vacancies such as F-vacancies (also known as F-centers) with different charges (VF+, VF0) and cationic vacancies (VNa−, VMg2−).19,20 These F vacancies may combine and form many cluster vacancies such as F2 (VF + VF), F3 etc. They may also combine with the cationic vacancies and form cluster vacancies such as (VF+–VNa−), (2VF+–VMg2−) etc. Pictorial presentations of the pure crystal structure and the possible defect centers are shown in Fig. 1b and c. These defect centers will have significant impact on the emission properties of the dopant ion, especially on rare earth ion (such as Eu3+ ion) since defects induce distortion surrounding the Eu3+ ion and thereby changes the characteristics emission profile which is highly sensitive to site symmetry.8–10 Unlike transition metal ions, whose energy gap between the excited state and ground state depend on the crystal filed environment,21 tuning of emission characteristics of rare earth ion is not possible by changing the crystal filed due to shielding of the valance shell 4f orbital. Therefore proper defect engineering may help to achieve tunable characteristics of Eu3+ ion. Further the defect centers themselves act as a luminescence centers and impart the materials with interesting optical properties. However, it is also worth to mention here that defect may provide nonradiative pathways to the excited state which decreases the quantum efficiency of the phosphor materials and change the decay kinetics. Recently, we have reported various defect centers and their cluster forms in perfect cubic KMgF3 perovskite compound.22 However NaMgF3 has distorted perovskite structure, where the MgF6 octahedrons are tilted and leads to significant change in the metal–halide bond length or halide–metal–halide bond angles.17 Due to such distorted structure, the number and amount of defect centers along with their configuration is totally different in NaMgF3 perovskite and they have a different impact on the optical properties. Thus, it is of immense importance to understand the defect structure in such a distorted perovskite structure. However to date not a single report is available on the detail analysis of the defect structure in NaMgF3 perovskite and their immediate consequence on the optical properties of an important red color emitting Eu3+ ion dopant ion. Electron Paramagnetic Resonance (EPR) and Positron Annihilation Lifetime Spectroscopy (PALS) techniques are the two widely accepted techniques to study the defect structure in any kind of matrix and a combined study would give evidence about both positive and negatively charged vacancies. EPR is sensitive to a paramagnetic defect centers (such as one electron trapped at positively charged fluoride or oxygen ion vacancy)23–26 while PALS is useful to understand various different negatively charged cationic vacancies or neutral cluster vacancies.27,28 However, such combined study is yet to be carried out in this matrix and no information related to defect structure and their configuration is available in literature. Further, if we calculate the positron lifetime values in the matrix theoretically using first-principle methods and then match with the experimental values then it will provide concrete evidences about the presence of various cluster vacancies.
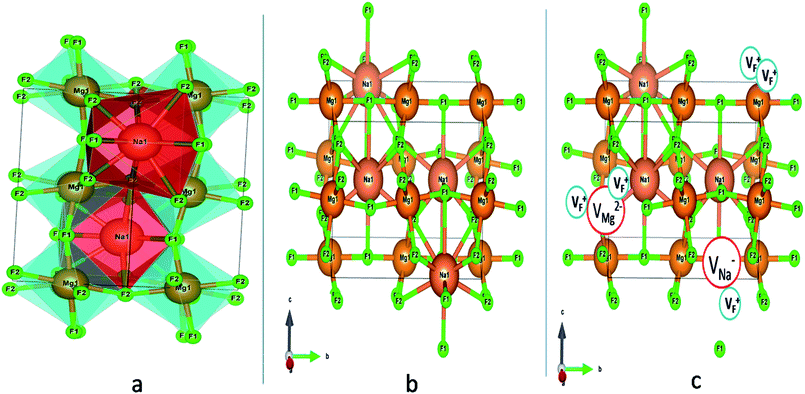 |
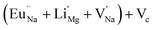
| | Fig. 1 (a) Distorted crystal structure of NaMgF3, wherein the tilted MgF6 octahedron is shown by bluish color and the NaF12 polyhedra is shown by red color. (b) Pure ball-stick representation of pure NaMgF3 and (c) defective NaMgF3 crystal structure where VMg2− represents Mg2+ ion vacancy, VNa1− represents Na+ ion vacancy and VF+ represents F− ion vacancy. | |
Defect centers may either be present already in the host matrix or may be created due to the charge imbalance when an aliovalent dopant ion is used. Their concentration can also be controlled by changing the dopant/co-dopant ion's composition. For example, if we dope a co-dopant ion (such as Li+ ion) with different charge compared to the dopant ion then depending on the charge difference (either reduced or increased after using the co-dopant ion) the amount of a particular type of defect centers may change. This will definitely distort the adjacent lattice site's symmetry. In addition, the introduction of an impurity ion with different size will further introduce more distortion into the matrix. As stated earlier, this will be highly beneficial for the luminescence properties of Eu3+ ions, since the forbidden f–f transitions are only become allowed in a distorted or asymmetric environment and the intensity of the red electric dipole (i.e. 5D0 → 7F2 transitions) used to be higher in such environment leading to more pure red color emitting phosphor material. Further, since defect centers tend to form cluster vacancies at high concentration, the configuration of such cluster vacancies will also depend on the co-dopant ion. All these changes will have direct impact on the materials properties. Once the defect centers are characterized by both experimental and theoretical studies the next task would be to correlate them with the optical properties and to understand the immediate impact. Unlike our previous report on perfect cubic KMgF3 perovskite,22 we have observed different defect clusters with different configuration in distorted NaMgF3 perovskite. It was also observed that the impact on the emission properties is different. To the best our knowledge, work in this direction in distorted NaMgF3 perovskite compounds is not reported yet and a new report will be very much helpful in the design of not only phosphor materials, but a wide range of multifunctional materials whose physical properties are directly or indirectly influenced by the defect structure. Therefore, in this work our main motivation is to present a detail description of the defect structures (both single and cluster vacancies) in NaMgF3, the defect induced emission characteristics, the changes in the configuration of the defect clusters upon Eu3+ and Li+ doping and to established a correlation between the configuration of defect structure and the emission and decay characteristics of Eu3+ ion.
2. Experimental
2.1. Synthesis
2.1.1. Materials. Synthesis of NaMgF3(s) requires heating of NaF(s) and MgF2(s). For preparation of Eu3+ doped NaMgF3(s), EuF3(s) has been used along with NaF(s) and MgF2(s). Similarly for synthesis of Li+ and Eu3+ co-doped NaMgF3(s), LiF(s) and, EuF3(s) has been heated along with NaF(s) and MgF2(s). LiF(s), NaF(s) and MgF2(s) were purchased from M/s Alpha Aesar, Germany with 99.98% purity and EuF3(s) has been procured from Sigma-Aldrich. The phase purity of the starting compounds was confirmed by X-ray analysis and was stored inside a glove box in argon atmosphere because of high hygroscopic nature of the fluoride compounds.
2.1.2. Synthesis of NaMgF3. NaMgF3(s) was prepared by heating (1![[thin space (1/6-em)]](https://www.rsc.org/images/entities/char_2009.gif) :1) mol mixture of NaF(s) and MgF2(s). The mixture of NaF(s) and MgF2(s) was thoroughly mixed and pressed into cylindrical pellets and heated subsequently under high pure argon atmosphere [argon gas was passed through several getters; uranium (for oxygen removal) and silica gel and P2O5 (for moisture removal)] at 1000 K for 10 h in a platinum crucible through intermediate grinding and re-pelletization. The heating of the sample mixture has also been carried out in a number of steps and in each step temperature enhancement is 200 K.
:1) mol mixture of NaF(s) and MgF2(s). The mixture of NaF(s) and MgF2(s) was thoroughly mixed and pressed into cylindrical pellets and heated subsequently under high pure argon atmosphere [argon gas was passed through several getters; uranium (for oxygen removal) and silica gel and P2O5 (for moisture removal)] at 1000 K for 10 h in a platinum crucible through intermediate grinding and re-pelletization. The heating of the sample mixture has also been carried out in a number of steps and in each step temperature enhancement is 200 K.
2.1.3. Synthesis of Eu3+ doped NaMgF3. 1.0 mol% Eu3+ doped NaMgF3(s) (Eu0.013+:NaMgF3) has been synthesized by heating of a homogeneous mixture of NaF(s), MgF2(s) and EuF3(s) in their corresponding stoichiometric amount in high pure argon atmosphere with same experimental steps as discussed for NaMgF3(s).
2.1.4. Synthesis of Li+–Eu3+ co-doped NaMgF3. 0.5 mol% Li+ and 1.0 mol% Eu3+ co-doped NaMgF3(s) (Eu0.013+ Li0.005+:NaMgF3) was prepared by heating of stoichiometric amount of LiF(s), NaF(s), MgF2(s) and EuF3(s) at 1000 K in high pure argon atmosphere for 12 h. During this synthesis process, same experimental precaution has been maintained as described in the synthesis of NaMgF3(s).
2.2. Instrumentation
The details of the instruments used for characterization are given in ESI.†
3. Results and discussion
3.1. Characterization
3.1.1. Powder X-ray diffraction (XRD). The experimentally obtained XRD pattern of undoped NaMgF3 compounds matches well with that of JCPDS file no. 81-0952 as represented by Fig. 2a. NaMgF3(s) has GdFeO3 type perovskite structure with space group of Pbnm and cell parameters a = 5.53 Å, b = 5.55 Å, c = 7.85 Å, α = β = γ = 90°. The XRD pattern of NaMgF3(s), Eu3+ doped NaMgF3(s) and Li+–Eu3+ co-doped NaMgF3(s) has been shown in Fig. 2b and c, respectively. It can be seen that with respect to the undoped NaMgF3, the peaks are shifted towards higher two theta side, when Eu3+ ions are doped, which indicates that there is a decrease in the cell volume due to doping of Eu3+ ion. If we compare the respective ionic radii of Na+ (1.39 Å for 12 coordinated), Mg2+ (0.72 Å for 6- coordinated) and Eu3+ ions (0.94 Å for 6- coordinated and 1.12 Å for 9- coordinated (size of maximum co-ordination of Eu3+ reported)) then the shirking of the unit cell volume must be due to replacement bigger size Na+ ions by smaller size Eu3+ ion. In Li+–Eu3+ co-doped NaMgF3, the respective ionic radii of Li+ (0.76 Å for 6 coordinated) is close to that of Mg2+, hence Li+ ions prefer to go Mg2+ site while Eu3+ ions will go to the large size Na+ site. It is worth to mention here that there is another possibility that both the Li+ and Eu3+ ion may go to the Na+ site and in such case there should significant change in the lattice parameters, which is not observed in present case. Therefore the shrinking of unit cell parameters is purely due to substitution of Eu3+ ion at Na+ site. Although, with a lower concentration of dopant ions in such phosphor materials XRD data may not give a accurate interpretations about the structural distortion we may calculate the Goldschmidt's tolerance factor “t”, which is defined as t = RA–X/√2(RB–X), where RA–X and RB–X are A–X and B–X bond lengths in ABX3 perovskite. t = 1 indicates the structure is perfect fit but when t lies in the range 0.8 ≤ t ≤ 1 then the structure become distorted due to tilting of the BX6 octahedra, which results in lowering of the symmetry. When the A site cation is too large then t > 1, which prevent the formation of a perovskite. Similarly if the A cation is too small then t < 0.8 which also results in different structure other than perovskite. For NaMgF3 we have calculated t = 0.93, which indicates that it has a distorted perovskite structure unlike KMgF3, for which t ∼ 1 and posses a perfect cubic structure. Now if Eu3+ ions replace the Na+ ions then t = 0.845 while if the Mg2+ ions are replaced by Eu3+ ions then t = 0.839. Therefore the t value will be less when Eu3+ ions go to Mg-site and there will always be a tendency for the Eu3+ ions to go to Na-site preferably.
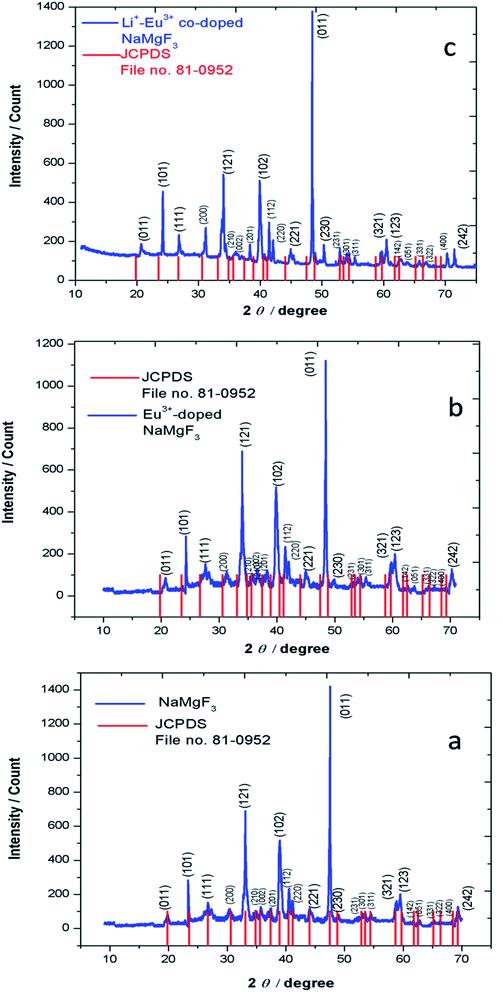 |
| | Fig. 2 XRD pattern of (a) NaMgF3, (b) Eu0.013+:NaMgF3 and (c) Eu0.013+ Li0.005+:NaMgF3. | |
3.1.2. FTIR study of NaMgF3. The FTIR spectra of NaMgF3 and Eu3+ doped NaMgF3 were recorded using a diamond single reflection ATR probe Alfa Brucker-500 spectrometer. The FTIR spectras have been shown in Fig. 3. For both the ternary NaMgF3 and Eu3+ doped NaMgF3, compounds, the characteristic peaks obtained are due to Mg–F bond stretching mode of vibration. The spectral bands near 870 cm−1 and 960 cm−1 are due to Mg–F bond.29 Though the compound contain Na–F bond, but all the Na–F bond vibrations are below 500 cm−1,30 which is beyond the detection limit of the instrument. For Li+–Eu3+ co-doped NaMgF3 compound, we have observed similar FTIR pattern as that of Eu3+ doped NaMgF3.
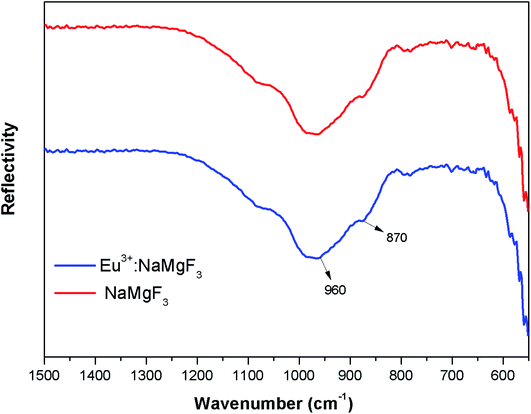 |
| | Fig. 3 FTIR spectra of NaMgF3 and Eu0.013+:NaMgF3. | |
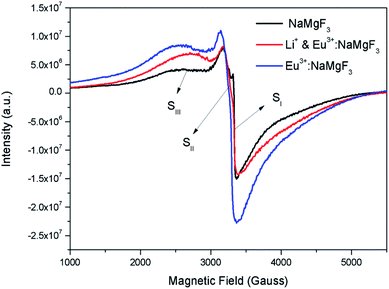
3.1.3. Scanning electron microscope (SEM) and energy-dispersive X-ray spectroscopy (EDX) study. The SEM images of 1 mol% Eu3+ doped NaMgF3 in Fig. 4a and b shows a flake-like morphology for the compound. The flakes are about 100 nm in thick, 300–400 nm wide and 400–700 nm in length. The SEM images of undoped NaMgF3 and Eu0.013+ Li0.005+:NaMgF3 are provided in ESI as Fig. S1a and b.† It was observed that both NaMgF3 and Eu0.013+Li0.005+:NaMgF3 particle are bigger in size in the range 1000–1500 nm. EDX study has been carried out for the elemental study of this compound which showed presence of peaks due to Na, Mg, F and Eu as given in ESI represented by Fig. S2.†
 |
| | Fig. 4 SEM images of Eu0.013+:NaMgF3 (a) front view and (b) side view of the particle. | |
3.2. Photoluminescence study: excitation, emission, lifetime and time resolved emission spectra analysis
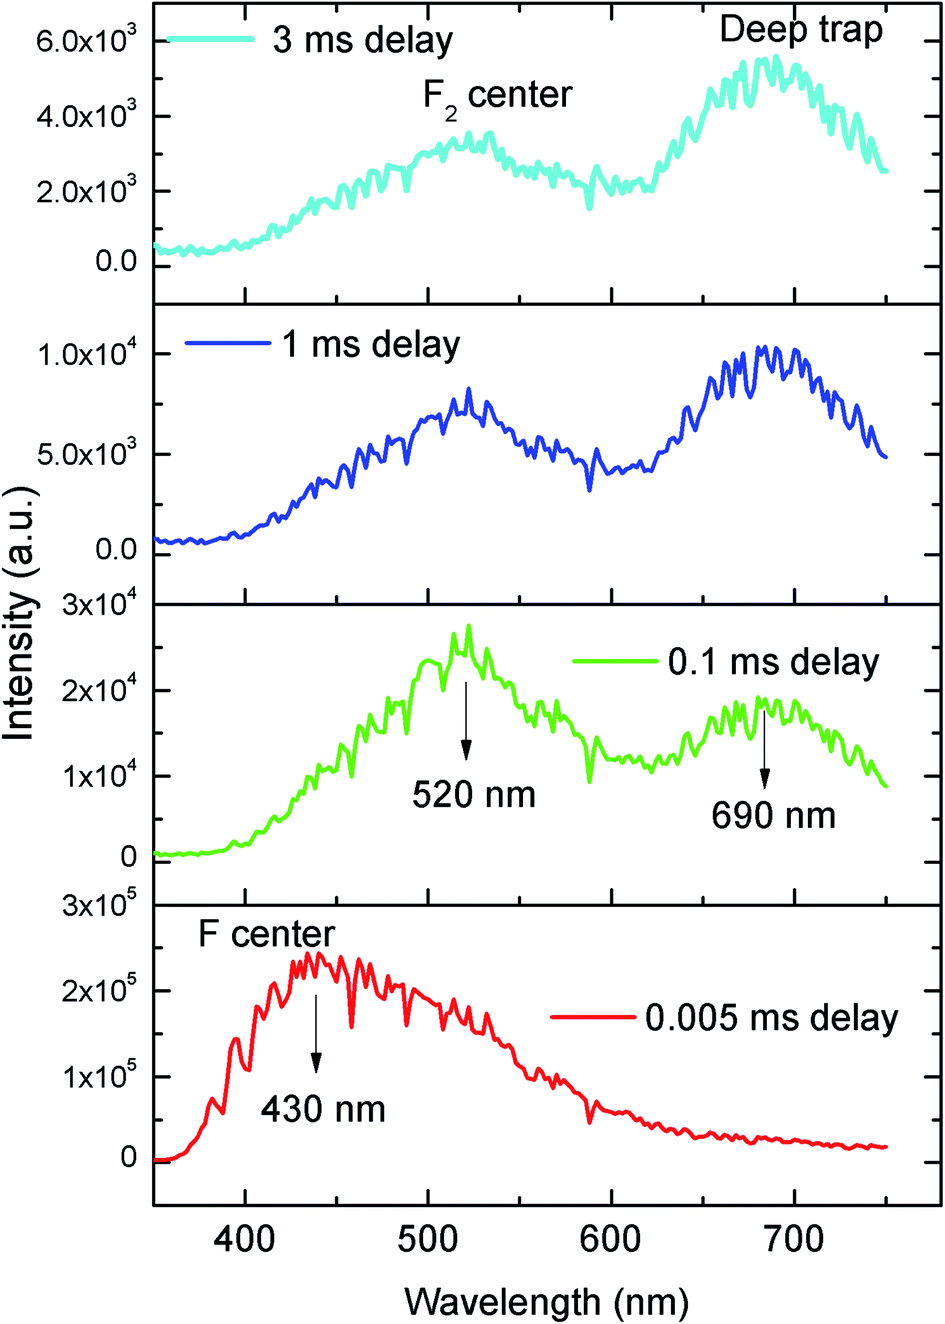
The emission spectra of the undoped compound i.e. NaMgF3 at 250 nm excitation is shown in Fig. 5, which showed a broad emission profile consisting of several peaks; with major peaks at around 430 nm and 520 nm. The CIE color coordinates diagram is shown in the inset of the Fig. 5, which showed that the compound is bluish green emitting phosphor. The around 430 nm and 520 nm peaks must be due to various defect centers. Earlier report on nanocrystalline NaMgF3 showed that a peak around 400 nm can be attributed to surface defect.31 However, in present case the emission spectrum is composed of multiple emission peaks and hence different type of defects exist in the compound. Later we shall correlate all these emission peaks with different defect centers. The best way to indentify and isolate these multiple color centers is to record their lifetime values and then do their Time Resolved Emission Spectra (TRES) analysis.32,33 Due to difference in their respective lifetime values a change in the emission spectra will be observed at different delay time in the TRES study as shown in Fig. 6.
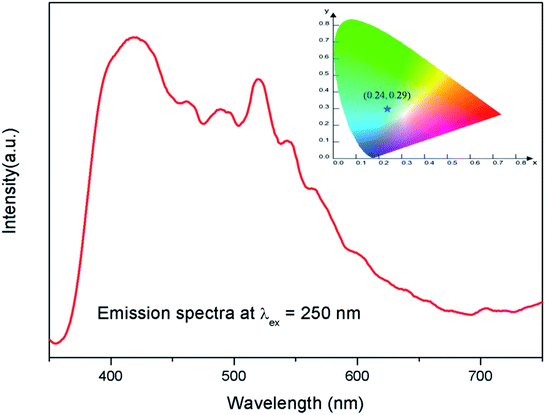 |
| | Fig. 5 Emission spectrum of pure NaMgF3 compound at 250 nm excitation. The corresponding CIE color coordinates are shown by the star mark in CIE color diagram in the inset. | |
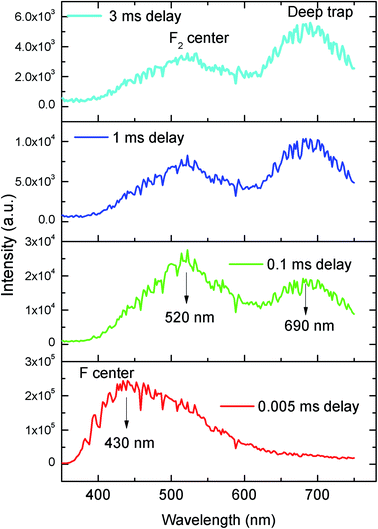 |
| | Fig. 6 Time resolved emission spectra of pure NaMgF3 compound at different delay time at 250 nm excitation. | |
From the TRES spectra at different delay time a continuous change in the emission profile can be seen in Fig. 6. At 5 μs (0.005 ms) delay time the TRES spectra is composed of all the color components and the 430 nm component has the maximum intensity. However as we increased the delay time the 430 nm component found to be disappeared and the remaining spectra were found to be composed of two broad peaks with maximum at 520 nm and 690 nm respectively. Interestingly, upon increasing the delay time such as at 3 ms the 520 nm component was found to be disappeared gradually. We have recorded the lifetime value of these emission components which are 12.89 μs for 430 nm, 85.90 μs for 530 nm and 2.096 ms for 690 nm components respectively.
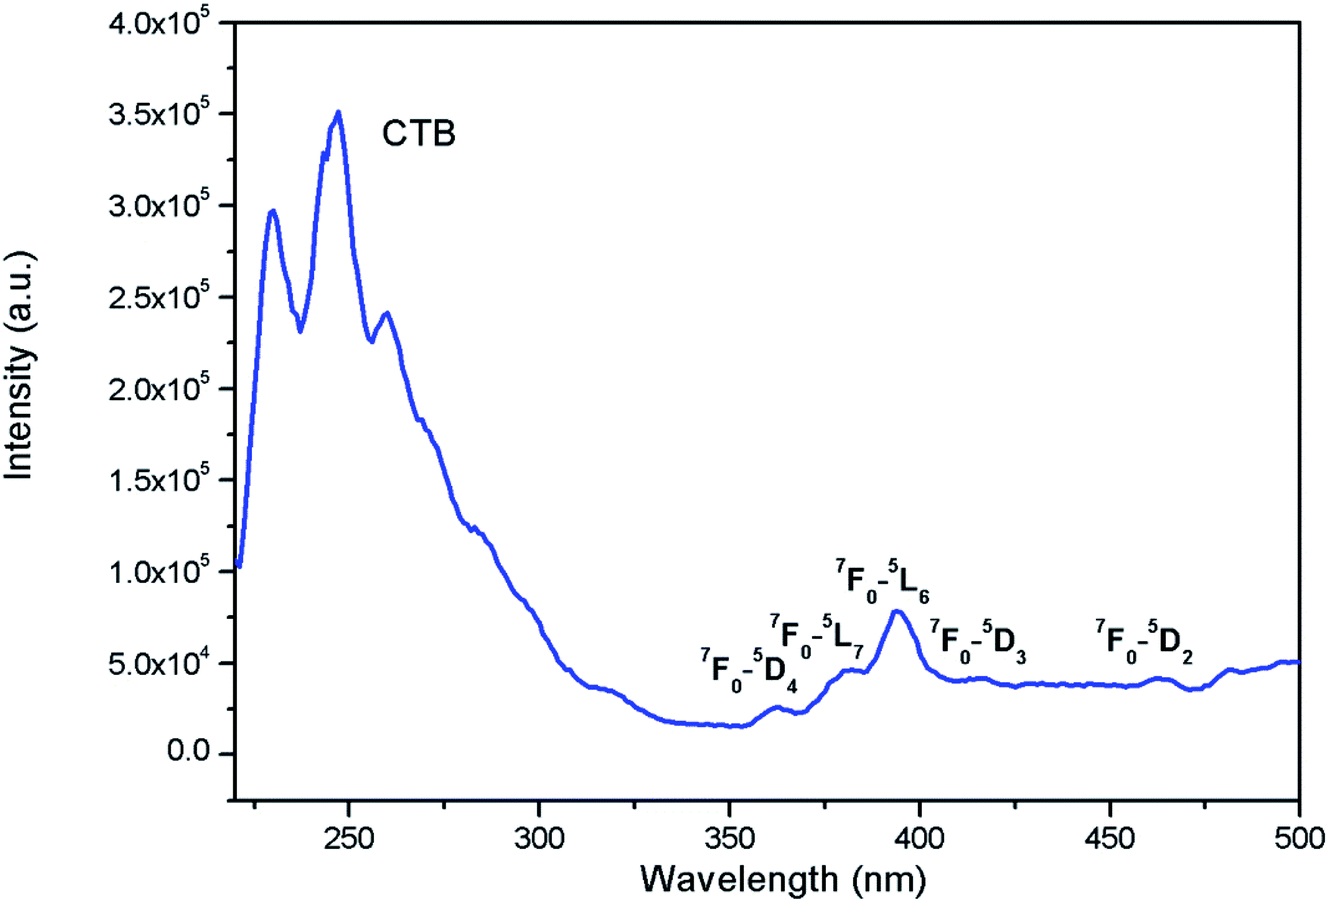
Fig. 7 shows the photoluminescence excitation (PLE) for Eu0.013+:NaMgF3. The PLE spectra is composed of two excitation bands in the region 210–320 nm and 350–490 nm regions with the 1st band as the most intense one. The 2nd band of excitation peaks are due to characteristic excitation band of Eu3+ ion32–36 and the associated transitions are marked in the figure, while the very broad 1st band of excitation is due to charge transfer band (CTB) between Eu3+ and the surrounding fluoride anions.37 Since the CTB transition are allowed one while the f–f transition are forbidden in nature, in most of the cases CTB transitions are more intense one. The PLE for Eu0.013+Li0.005+:NaMgF3 compound is given in ESI as Fig. S3,† wherein the ratio of intensity f–f transition to that of CTB transition further decreases. This indicates that the surrounding local structure of Eu3+ ion is less distorted one and Li+ ions may have modified the local structure of Eu3+ ion.
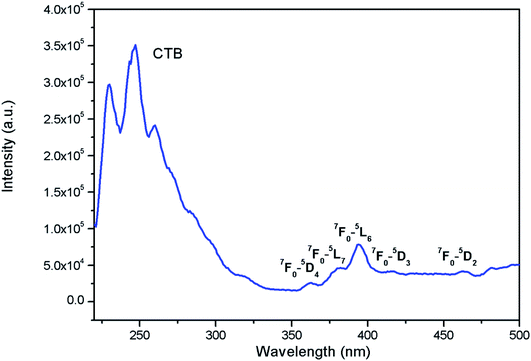 |
| | Fig. 7 Excitation spectra of Eu0.013+:NaMgF3 at an emission wavelength of 615 nm. | |
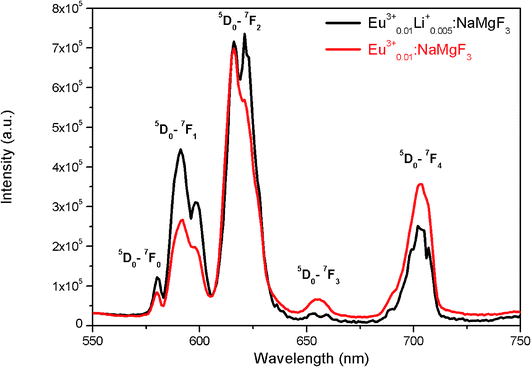
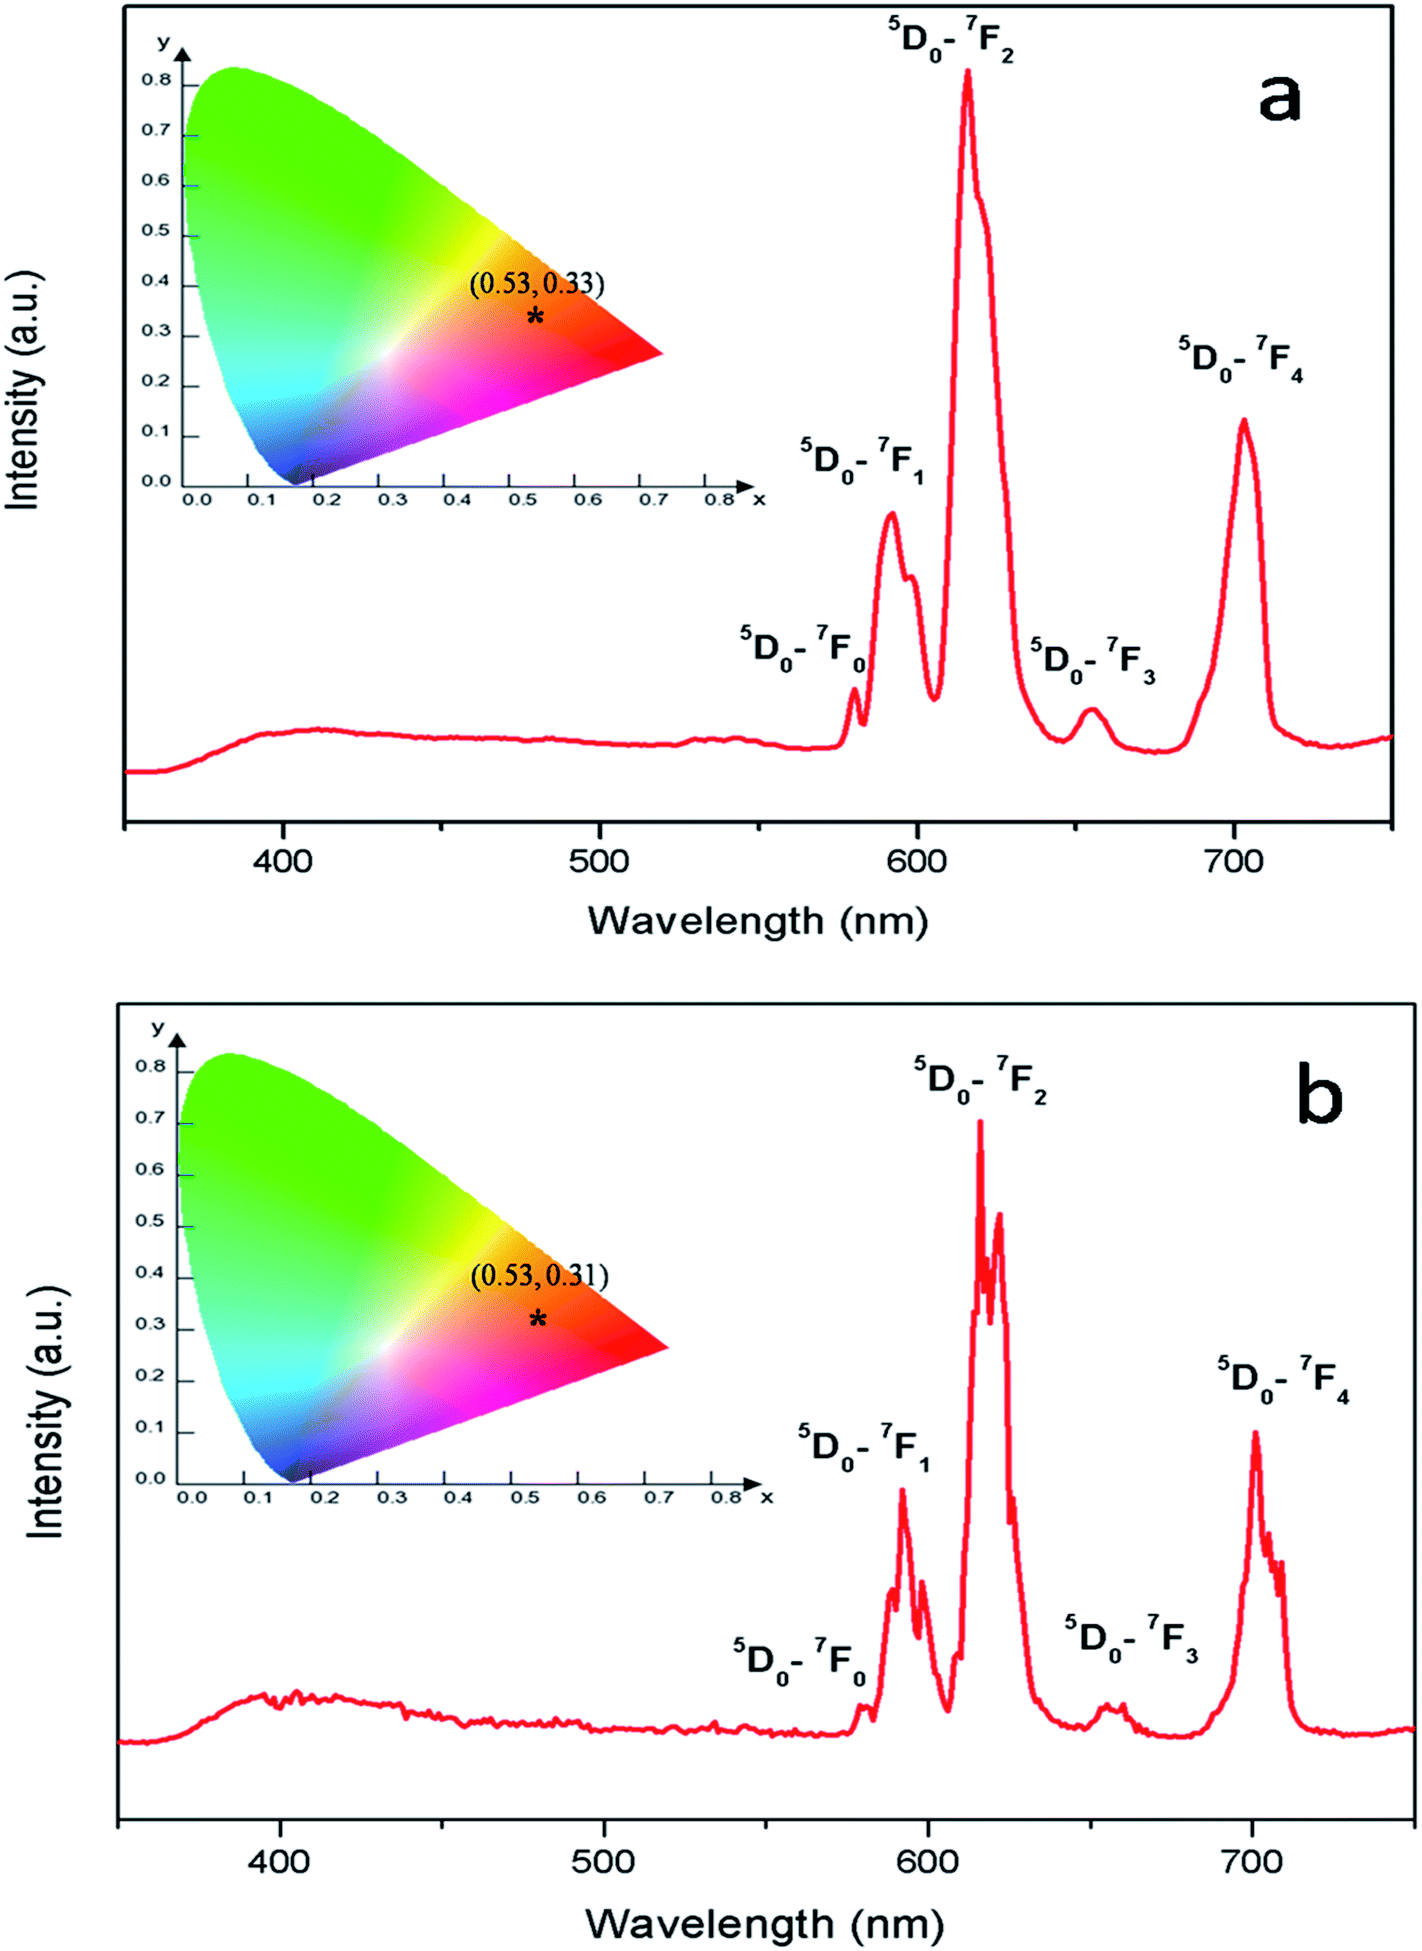
Fig. 8 represents the emission spectra of Eu0.013+:NaMgF3 and Eu0.013+ Li0.005+:NaMgF3 compounds with CTB excitation, which showed various sharp emission bands at 579, 590, 615, 652 and 700 nm which correspond to 5D0 → 7Fj (j = 0, 1, 2, 3 and 4) transitions respectively. From the spectra it can be found that the most intense line is around 615 nm, which is the electric dipole (ED) transition of (5D0 → 7F2 (ΔJ = ±2)) of Eu3+ ion and hypersensitive to local site symmetry. On the other hand the orange color magnetic dipole (MD) transition 5D0 → 7F1 (590–600 nm) is not sensitive to local site symmetry. The ratio of intensity of these two lines i.e. ED/MD, also termed as asymmetric ratio (A) gives a measure about the degree of distortion from the inversion symmetry surround the Eu3+ ion in the host matrix.32,33 It is also worth to note here that this asymmetric ratio will also decide the final output color of the samples. In a highly asymmetric environment hypersensitive red line i.e. 5D0 → 7F2 (ΔJ = ±2) (∼610–630 nm) will be more intense and the color output will be reddish in nature, while in a symmetric environment the color will be orange in nature due to EDT is suppressed here and the orange MDT is the prominent one. In our earlier works we have demonstrated clearly how the emission color output can be changed from orange to red for various Eu3+ doped phosphors just by changing Eu-site occupancy from a symmetric lattice site to an asymmetric site.32 For both the compounds, the CIE color coordinates have been shown in the inset of the figures and represented by the asterisk “*”. It can be seen that both of them are orange-red emitting however the CIE color coordinates is slightly more shifted towards the red region in case of Eu0.013+:NaMgF3 compound.
 |
| | Fig. 8 Emission spectra and CIE color coordinate of (a) Eu0.013+:NaMgF3 and (b) Eu0.013+Li0.005+:NaMgF3 compounds with their respective CTB as excitation. | |
To get clearer picture about the changes in the emission characteristics of Eu3+ upon co-doping Li+ ion, the combined figure of these two compounds in the 550–750 nm regions is shown in Fig. 9. It can be seen that for Li+ and Eu3+ co-doped NaMgF3 compound, there are several changes in the characteristics lines of Eu3+ ion. The intensity of the orange color magnetic dipole transition (MDT) 5D0 → 7F1 (590–600 nm) was found to be enhanced while that of the 5D0 → 7F4 was decreased. The intensity of the electric dipole transition (EDT) of 5D0 → 7F2 was almost same as that of Eu3+:NaMgF3 compound. The asymmetry ratio A is 2.61 for 1 mol% Eu3+ doped NaMgF3 compound and 1.59 for 0.5 mol% Li+ & 1.0 mol% Eu3+ co-doped NaMgF3 compound. Therefore it seems that the asymmetric environment surrounding the Eu3+ ion was decreased. This can also be correlated with the decrease in intensity of the 5D0 → 7F4 line which is generally highly intense in a distorted lattice environment as observed in other compound.38 This is also responsible for the slight shifting of the CIE color coordinates towards red region. Thus upon Li+ co-doping the surrounding local environment of Eu3+ ion must have become less asymmetric. However, since for both the compounds, A ≥ 1, the environment surrounding Eu3+ ion is more or less asymmetric in both cases. Now let us see whether there is a single type of Eu3+ ion or different. If there is more than one kind of Eu3+ ions, then it must be due to different adjacent defect structures, since from XRD study it has been confirmed that Eu3+ ions are most probably substituting the Na-lattice site. Photoluminescence lifetime study is the best technique in this context in order to determine the number of different Eu3+ ions exist in the system.
 |
| | Fig. 9 Emission spectra of (a) Eu0.013+Li0.005+:NaMgF3 (black color) and (b) Eu0.013+:NaMgF3 (red color) compound at CTB excitation. | |
3.2.1. Photoluminescence (PL) lifetime studies. Fig. 10 represents the photoluminescence decay profile for Eu0.013+:NaMgF3 compound and Eu0.013+Li0.005+:NaMgF3 compounds at CTB excitation and at 615 nm emission wavelengths. In both cases, the decay curves obey a tri-exponential eqn (1).| |
 | (1) |
where I(t) is intensity, τ1, τ2 and τ3 are PL lifetime values with A1, A2 and A3 as their relative weightage. The PL lifetime values are given in Table 1. The relative percentage of these two lifetime values can be obtained using the formula| |
 | (2) |
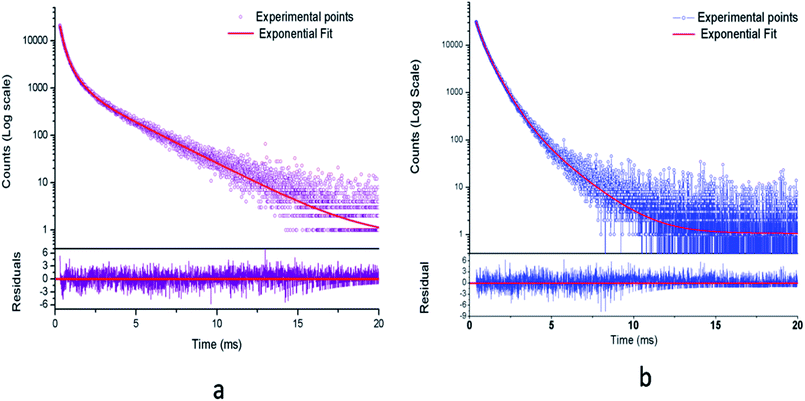 |
| | Fig. 10 Photoluminescence decay curve for (a) Eu0.013+:NaMgF3 and (b) Eu0.013+Li0.005+:NaMgF3 at CTB excitation. | |
Table 1 Lifetime values of Eu3+ doped NaMgF3 and Eu3+, Li co-doped NaMgF3 compounds
| Compound |
Lifetime value of 1st component in μs (T1) |
Lifetime value of 2nd component in μs (T2) |
Lifetime value of 3rd component in μs (T3) |
| Eu0.013+:NaMgF3 |
197.18 (30%) |
606.40 (36%) |
2499 (34%) |
| Eu0.013+Li0.005+:NaMgF3 |
261.46 (24%) |
649.04 (66%) |
1595.20 (10%) |
From the Table 1, it can be seen that for Eu0.013+:NaMgF3, the 1st and 2nd components are short-lived in nature while 3rd component is long lived. The existence of 3 components indicate that Eu3+ ions exist in three different environment, which may be due to distribution of Eu3+ ions in different lattice sites or due to Eu3+ ion in the same lattice site but in different surrounding caused by the defect structure. It is also worth to mention here that unlike in cubic KMgF3, where we have found two different Eu3+ components,22 here we have observed three components, indicating three different local structures surrounding the Eu3+ ions. Since f–f transition are allowed only in an asymmetric environment, the two short lived components τ1 and τ2 must be originated from a highly asymmetric environment, while the long lived component τ3 is originated from an environment where Eu3+ ions have comparatively more symmetric environment. Interestingly, upon Li+ co-doping, the lifetime value of 1st and 2nd components were found to be increased while that of the long live component (τ3) was decreased. The percentage of the 2nd component τ2 was found to be more. Therefore there must be a change in the defect structure upon Li+ co-doping.
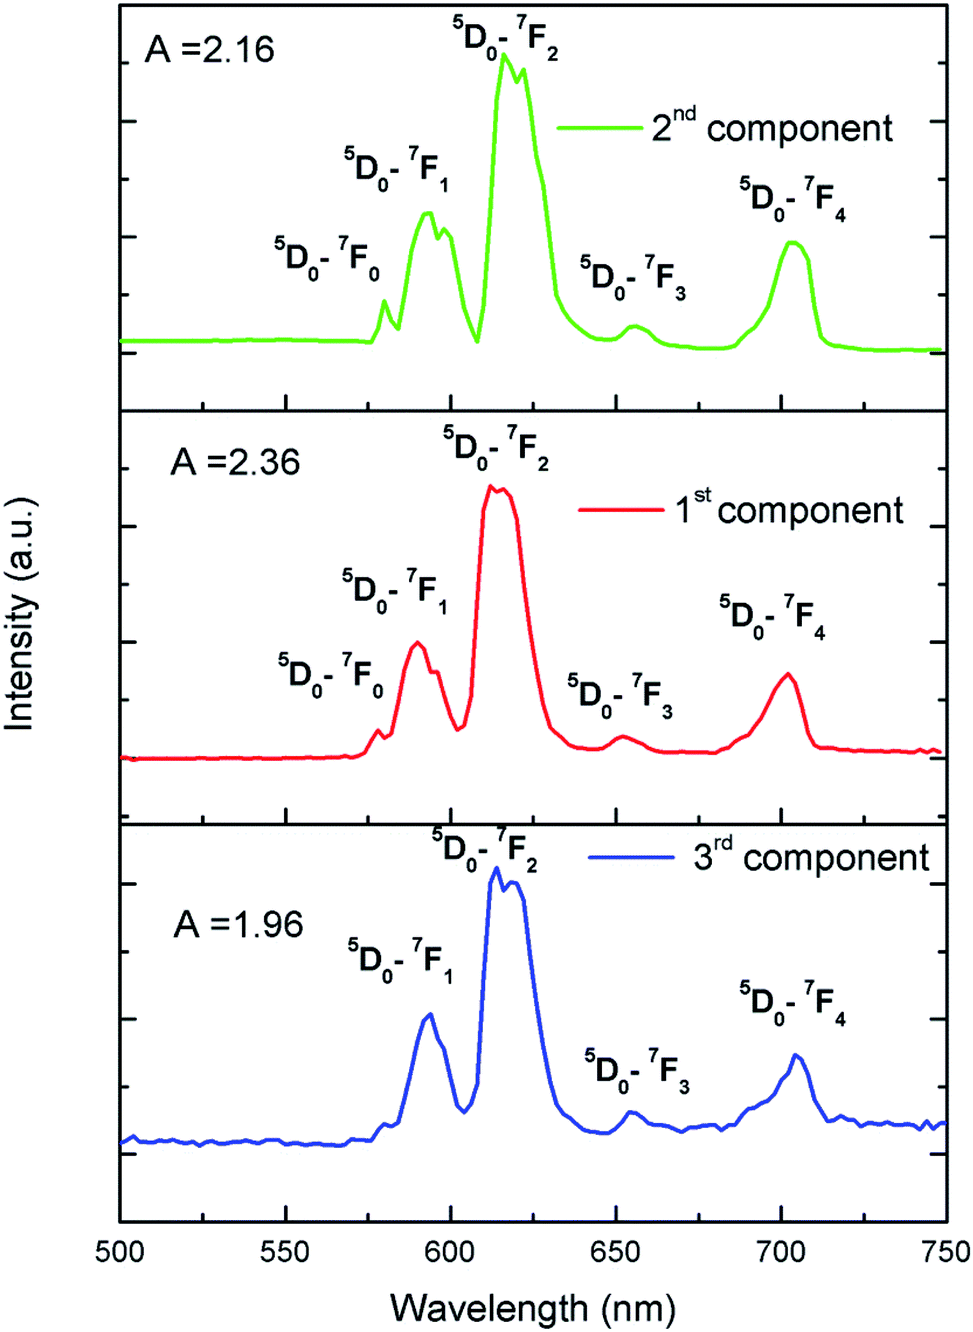
To further confirm that there are three different kind of Eu3+ ion, we have carried out Time Resolved Emission Spectra analysis study at different delay time, which can isolate the individual emission spectrum of Eu3+ ions exist in different lattice and crystal environment. We have followed the similar procedure of analysis as before39,40 and the different TRES spectra at different delay time are given in ESI (Fig. S4†). After analyzing the TRES spectra at different delay time we have isolated individual emission spectra of the three different components as shown in Fig. 11. It can be seen that the ratio (A) of the 5D0 → 7F2 and 5D0 → 7F1 lines is different for the three respective spectra.
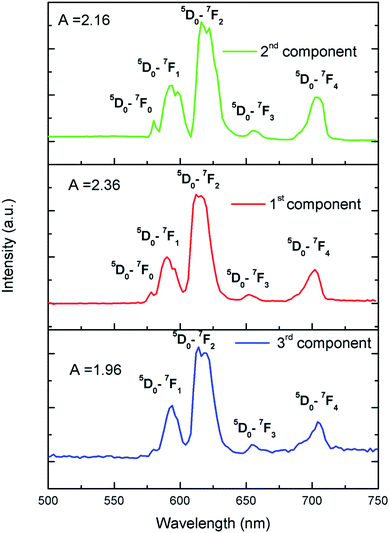 |
| | Fig. 11 Time resolved emission spectra of for Eu0.013+:NaMgF3 compound at different delay time. | |
3.3. Positron annihilation lifetime study
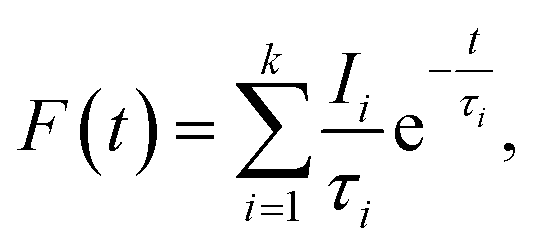
Positron annihilation lifetime spectroscopic (PALS) measurements have been carried out in the sample before and after doping. The total area of the PALS histograms for each sample was ∼106. The area normalized PALS histograms in all three samples are shown in Fig. 12. The nature of the PALS histogram is multi-exponential with the following decay equation| |
 | (3) |
where F(t) is the number of counts at time t, k is the number of exponential decay components, τi is lifetime of the ith component having intensity Ii. The instrumental resolution R(t) is convoluted with the multi-exponential curves. In the present positron lifetime setup the value of R(t) is around 220 ps. The experimental spectra were best fitted into three discrete lifetime components with the variance of fit within 1–1.1. The values of these three lifetime components along with their corresponding intensities are given in Table 2.
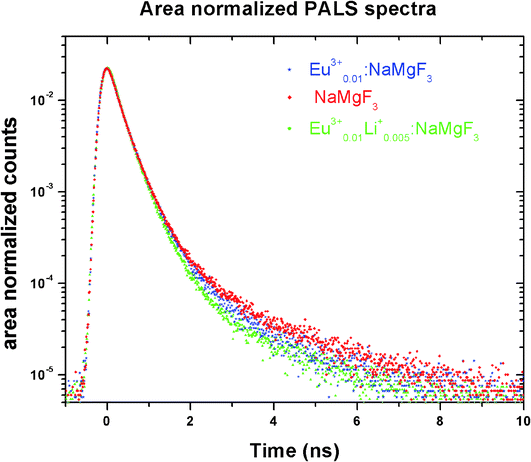 |
| | Fig. 12 PALS decay profile of NaMgF3, Eu0.013+:NaMgF3 and Eu0.013+Li0.005+:NaMgF3. | |
Table 2 Lifetime values of Eu3+ doped NaMgF3 and Eu3+, Li co-doped NaMgF3 compounds
| Sample |
τ1 (ns) |
I1 (%) |
τ2 (ns) |
I2 (%) |
τ3 (ns) |
I3 (%) |
| NaMgF3 |
0.211 ± 0.003 |
61.39 ± 1.71 |
0.451 ± 0.009 |
35.66 ± 1.65 |
2.28 ± 0.05 |
2.94 ± 0.09 |
| Eu0.013+:NaMgF3 |
0.239 ± 0.002 |
73.89 ± 1.08 |
0.527 ± 0.009 |
24.88 ± 1.04 |
2.95 ± 10 |
1.23 ± 0.05 |
| Eu0.013+Li0.005+:NaMgF3 |
0.206 ± 0.002 |
65.38 ± 1.00 |
0.418 ± 0.007 |
33.74 ± 1.66 |
2.21 ± 11 |
0.88 ± 0.06 |
Among the three lifetime components, the third component (τ3) with very less intensity (I3 ∼ 1–3%) having lifetime value in the range of 1–2 ns is attributed to the ortho-positronium (o-Ps) pick-off annihilation in the matrix. Since the intensity of this o-Ps component is very small, it will not be considered further for discussion as it does not carry any information regarding the optical properties of the samples. The second component (τ2) is attributed to trapped positron annihilation from defects present either in the surface or in the bulk of the compounds. The first component (τ1) generally represents positron annihilation from the free state in the bulk, as well as trapping of positron into the defects through the following equation
where
τb is the free positron lifetime in the bulk crystal and
κ is the trapping rate of positron into the defect. The value of
τb in the sample can be determined from the experimental value of
τ1 and
τ2 through two-step trapping model using the relation
41| | |
τb = (τ1τ2)/(I1τ2 + I2τ1)
| (5) |
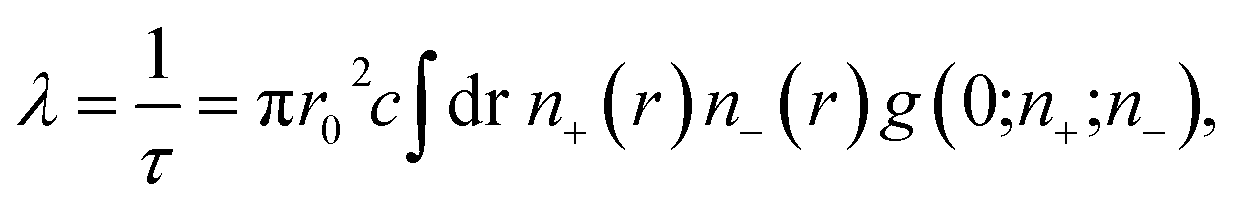
In order to understand the origin of the first two lifetime components (τ1 and τ2) in both un-doped and doped samples, positron lifetime has been calculated in the matrix through first-principle methods implemented in the MIKA/DOPPLER Package.42 The inverse of positron lifetime i.e. positron annihilation rate (λ = 1/τ) is proportional to the electron density at the site of annihilation and is calculated from the overlap integral
| |
 | (6) |
where
r0 is the classical electron radius,
c is the velocity of light,
n+ and
n− are positron and electron densities and
g(0;
n+;
n−) is the electron–positron pair correlation function/enhancement factor evaluated at the position of positron.
43 Electron and positron densities are calculated using two-component generalization of the density functional theory.
43 The electron and positron densities have been calculated from their respective wave function
ψ−(
r) and
ψ+(
r) through the equation
| | |
n−(r) = ∑|ψi(r)|2 and n−(r) = ∑|ψi+(r)|2,
| (7) |
where the summation for the electron states is up to the Fermi level and usually only one positron state is considered. The average electron density has been calculated without the influence of positron using ‘Conventional Scheme Approximation’.
44 A further simplification has been made to calculate electron density and the Coulomb potential through atomic superposition (ATSUP) method [c]. The exchange and correlation potential are described by the Generalized Gradient Approximation (GGA). Arponen–Pajanne scheme is used for accounting the enhancement factor ‘
g’.
45 A 4 × 4 × 4 super cell of NaMgF
3 in perovskite structure having a lattice constant of
a = 5.5382 Å has been considered for the calculation. The calculated positron annihilation lifetime values in un-doped and doped samples with various vacancies are given in
Table 3.
Table 3 Calculated positron lifetime in NaMgF3, Eu0.013+:NaMgF3 and Eu0.013+ Li0.005+:NaMgF3 compounds
| System |
Calculated Lifetime (ps) |
| Un-doped NaMgF3 |
| Bulk |
215.0 |
Na monovacancy  |
315.9 |
Mg monovacancy  |
240.9 |
Mg divacancy  |
243.2 |
 |
318.8 |
 |
468.3 |
|
| Eu0.013+:NaMgF3 |
Bulk:  |
241.1 |
 |
338.7 |
 |
523.1 |
|
| Eu0.013+Li0.005+:NaMgF3 |
Bulk: 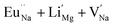 |
315.9 |
 |
241.7 |
 |
465.1 |
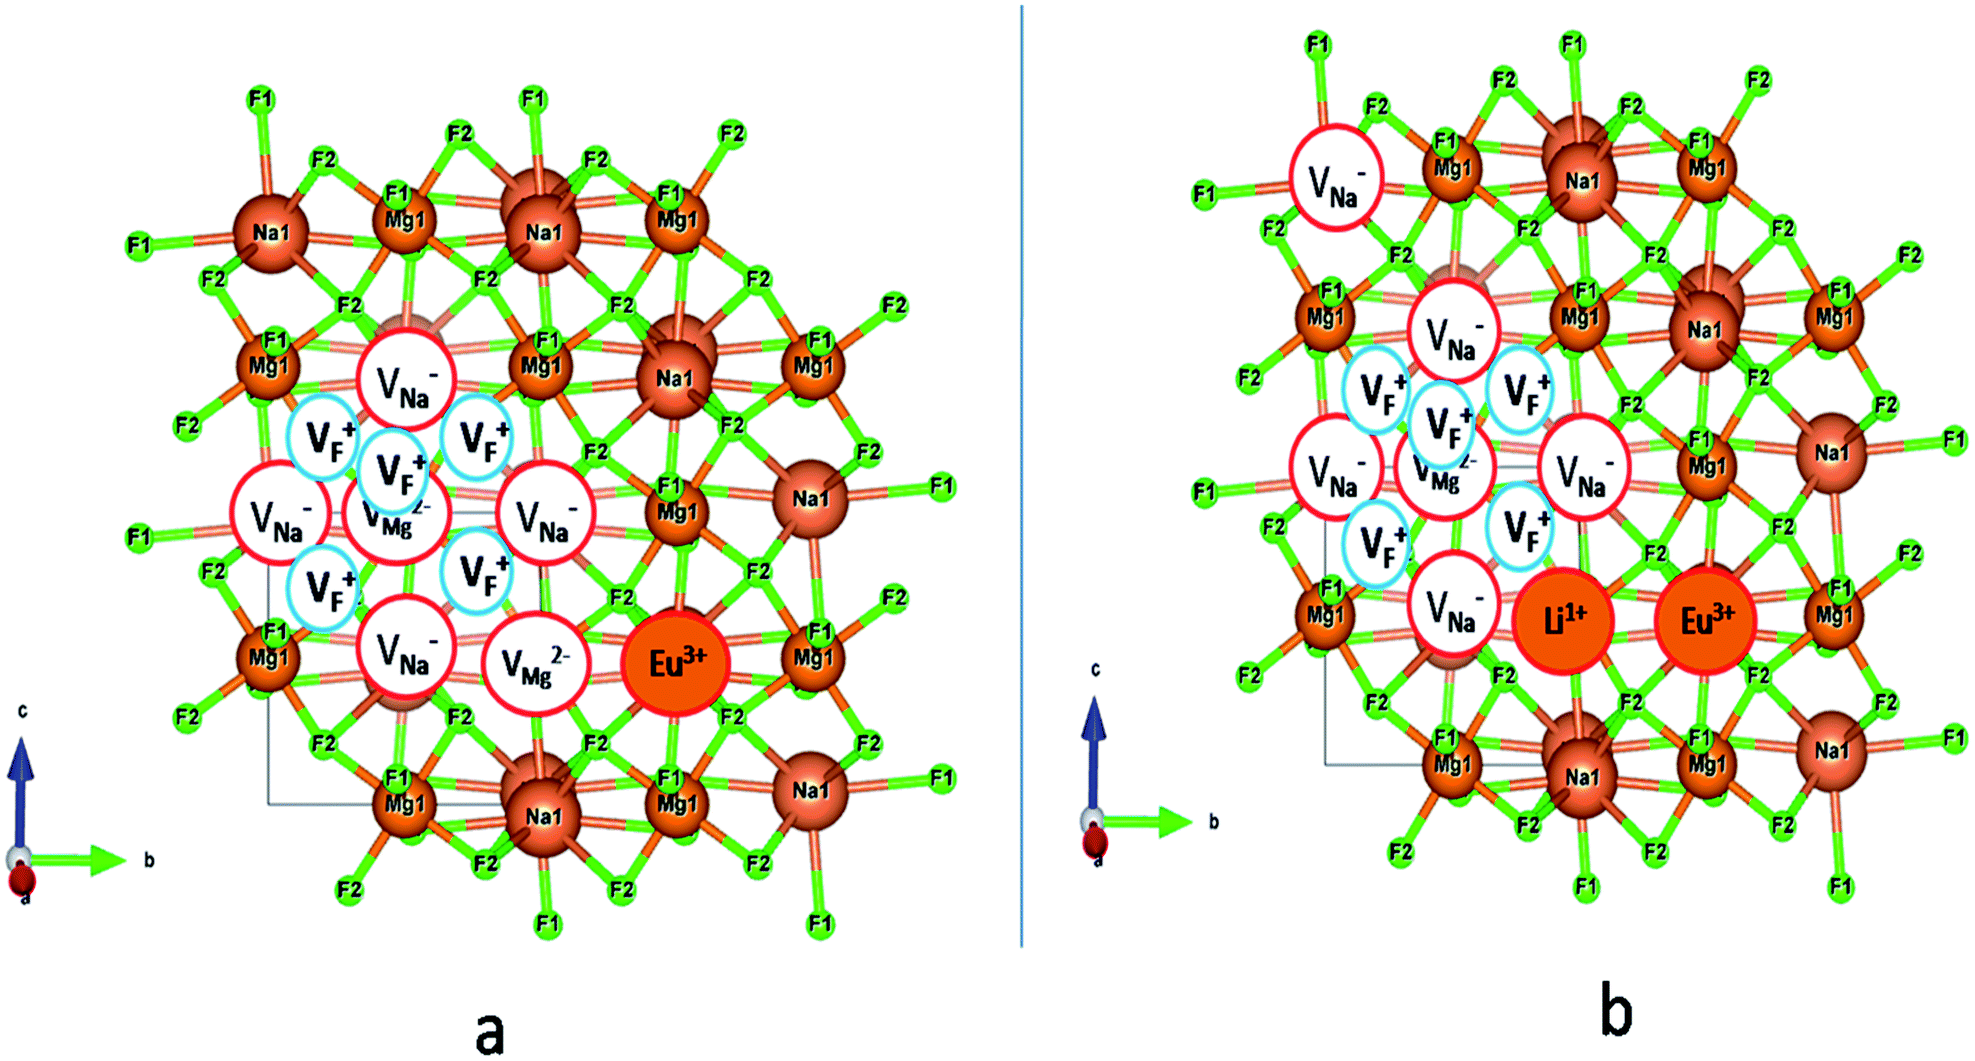
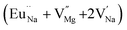
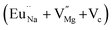
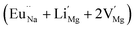
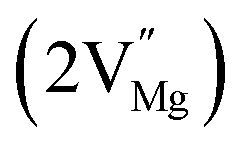
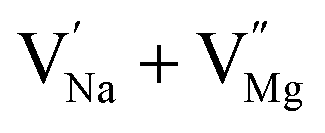
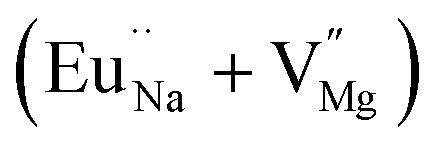
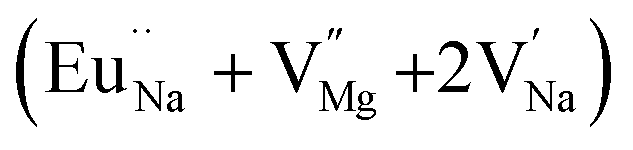
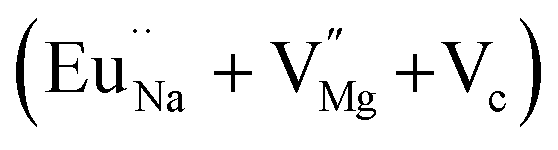
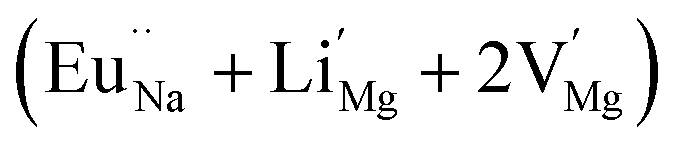
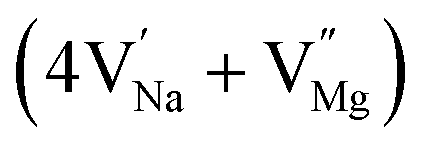
In the un-doped NaMgF3 matrix the respective experimental values for τ1 and τ2 are 0.211 and 0.451 ns. The calculated bulk lifetime (τb) using eqn (3) comes around 0.272 ns, which is too longer than the bulk lifetime value (τbc = 0.215 ns) as calculated using first principle method (Table 3). The value of τbc is rather close to the experimental first component lifetime (τ1). This suggests that τ1 represents the free positron lifetime in the bulk of the un-doped NaMgF3 matrix. The higher intensity (I1 ∼ 61%) of the first component indicates that the bulk of the un-doped sample is mostly defect-free or having shallow trapping centre with negligible trapping rate for positron. Inside the matrix a larger fraction of positron annihilates from the free state in the bulk of the medium, a smaller fraction (∼35%) may diffuse into the grain surface and annihilates from large vacancy clusters present at the grain surface. The large value of τ2 (0.451 ns) supports this argument. Table 3 shows that the calculated positron lifetime values in mono-vacancy, di-vacancy of Na+ and Mg2+ in the bulk of the matrix are much shorter than the experimental value of τ2. The vacancy cluster (VC), which is made of 4 Na+ vacancies and one Mg++ vacancy  with neighboring 6 F− vacancy shows the positron lifetime ∼0.463 ns which is very close to the experimental value of τ2. A representation of this vacancy cluster along with the undoped NaMgF3 is given in Fig. 13. After doping with Eu3+, the experimental τ1 value (0.239 ns), which is very close to the theoretically calculated value of Mg mono vacancy (0.240 ns) along with its high intensity (∼74%) indicates the possibility that Eu3+ ion sits at the Na+ position and one extra Mg2+ vacancy (VMg2−) is created to balance the electron charge as shown in Table 3. The τ2 value (0.527 ns) is larger than the calculated positron lifetime in Na or Mg mono- or di-vacancies; rather it is very close to the vacancy cluster (Vc) in the Eu3+ doped matrix (0.525 ns) as shown in Fig. 14a, which signifies the presence of large surface defects as in the un-doped sample producing large value of τ2. The scenario is different when the matrix is co-doped with Li+ and Eu3+ ions. The comparison of experimental τ1 value (0.206 ns) with the calculated positron lifetime in Table 3 suggests the possibility that Eu3+ ion sits in the position of Na+ and Li+ in the position of Mg2+ along with creation of a Mg2+ mono-vacancy or two Na+ vacancy in the matrix. The experimental τ2 value is very close to the value of calculated positron lifetime in the vacancy clusters (Vc) in the co-doped matrix. Therefore the vacancy cluster retained its configuration but a slight change in surrounding as shown Fig. 14b. The calculated lifetime value for this vacancy cluster (Vc) as shown in Table 3 is 0.448 ns. From Fig. 14, it can be said that the configuration of defect cluster in distorted NaMgF3 is different from that of perfect cubic KMgF3 perovskite.22
 |
| | Fig. 13 Representation of (a) undoped NaMgF3 and (b) defective NaMgF3 with a vacancy cluster. | |
 |
| | Fig. 14 Modification of the vacancy cluster (VC) when Eu3+ and Li+ ions are doped in NaMgF3. (a) With an additional Mg vacancy directly linked to VC when Eu3+ ion is only doped, (b) no additional Mg vacancy, but one Li+ ion is placed adjacent to VC and a Na vacancy is formed a bit far away from it when Li+ is co-doped with Eu3+ ion. | |
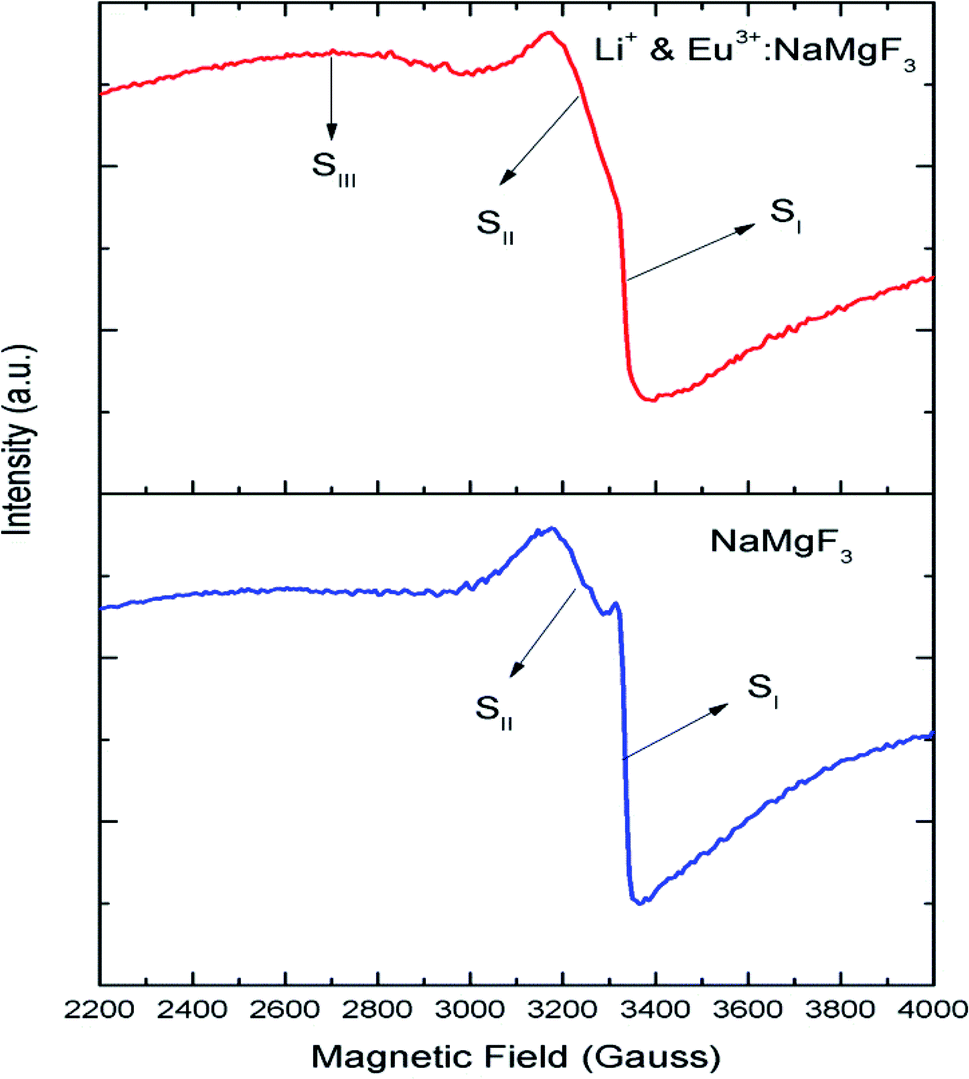
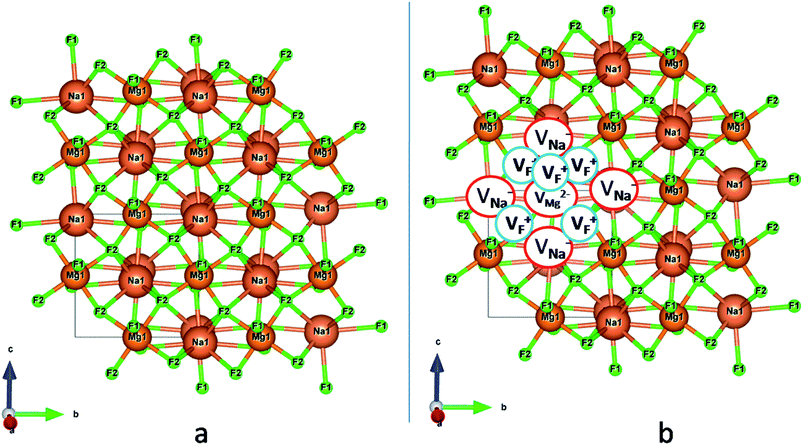
3.4. EPR study
Although positron annihilation lifetime spectroscopy gives an in details information about various negatively charged cationic vacancies and neutral or negatively charged defect cluster vacancies consisting of both positively charge anionic and negatively charged cationic vacancies, it does not give information about positively charged mono anionic vacancies. In fluoride based matrices one such vacancies is F-center (VF), which formed when an electron is trapped at a positively charged fluoride ion vacancies (VF+). Fig. 15 represent the EPR spectra of both NaMgF3, and Eu0.013+Li0.005+:NaMgF3 compounds, which showed that all of them are consisting of three resonance signals with g values 2.04 (S1), 2.07 (S2) and 2.10 (S3) respectively. The S3 signal can be more clearly seen in Fig. 16.The S1 signal can be attributed to F center as reported for many alkali halide based compounds.46 The polycrystalline nature of the sample may have prevented the hyperfine nature of this signal, which results due to isotropic interaction of the electron with fluorine nuclei in the second shell. From positron study we have confirmed that in the undoped compound is mostly defect-free and there is a possibility of having large vacancy clusters present at the particle surface. We believe that the S1 signal is related to F center present at the surface of the particle. Earlier report based on different fluoride matrices doped with Eu3+ ion also repot a similar type S2 signal to be due to cluster vacancy composed of Eu2+ ion and cationic vacancy such as (Eu2+–Vc).47 However, for the present case since the signal also exist in case of the Undoped NaMgF3, and in the Eu3+ doped compound the position of this signal remain same with only a slight change in the relative intensity was observed, it can be concluded that the signal is purely related to an intrinsic defect and not linked to any cluster consisting of Eu2+ ion. We believe that this signal can be related to paramagnetic cationic vacancies such as when a positively charged hole is trapped at doubly negative charged Mg vacancies (VMg2−). It is also quite noticeable that the S3 signal is quite broad in nature. This use to happen when the lifetime of exited electron after absorbing microwave radiation becomes less, which depends on two things; spin–spin interaction and spin–lattice interaction. Spin–spin interaction depends on the concentration of paramagnetic species and more the concentration more the species will be closer to each other, which will definitely increase this interaction. Therefore, a cluster of two paramagnetic species may also increase this interaction and in that case the peak may become broad.25,27 We believe that the S3 signal originated from F2 center which is nothing but a pair of two paramagnetic F centers, which exist side by side. Further, as observed in our earlier reports on defect related magnetism, when the concentration of such paramagnetic vacancies increases there is a possibility of local exchange interaction which may leads to dilute ferromagnetism.25,27 In such cases there used to be a change in the local magnetic field also, which results in a change in the position of the resonance signal towards lower field. If we critically see Fig. 12, then it can be seen that there is a constant change in the position of the S3 towards lower field in the order Eu0.013+Li0.005+:NaMgF3 → Eu0.013+:NaMgF3. From Fig. 16, it can also be seen that upon doping Eu3+ and Li+ in, there is an enhancement of all the signal's intensity following the trend NaMgF3 → Eu0.013+Li0.005+:NaMgF3 → Eu0.013+:NaMgF3. Interestingly, for both the doped samples, the relative intensity of S2 signal was found to be more than the S1 signal, which might be due to the fact that upon Eu3+ and Li+ doping, the concentration of negatively charged cationic vacancies increases. From positron study we have observed that for Eu0.013+:NaMgF3 compound, there is possibility of formation of Mg vacancies. Therefore this S2 signal can be attributed to Mg vacancy. This is due to fact that since Eu3+ has two more positive charges than Na+, hence a substitution at Na+ site may induce 2 additional positive charges in the matrix and to compensate that there will be creation of negatively charged Mg vacancy (VMg2−) or Na vacancy (VNa−). From positron study we have seen that there is formation of VMg2− and also a cluster vacancy consisting of both VMg2− and VNa−. Now in a perfect scenario proportional number of Mg and Na vacancies should be formed to compensate the charge difference, however in real case it may happen that due to this substitution there might be creation of additional Mg vacancies and to compensate the additional negative charge there will be further creation of positively charged F vacancies. All these possibilities will lead to an enhancement of S1 and S3 signal's intensity as observed in Fig. 16. Now let us think about the possible scenarios in Eu0.013+Li0.005+:NaMgF3 compound. In XRD results we have confirmed from ionic radius comparison that Eu3+ ion most preferably substitutes the Na+ site in Eu0.013+Li0.005+:NaMgF3 compound while the co-dopant Li+ ion will prefer to go Mg2+ site due to close ionic radii. For Eu3+ substitution at Na+ site, there will be introduction of two additional positive charges in the system which can be compensated by creation of one doubly negative charged Mg vacancy (VMg2−) or two single negative charged Na vacancies (VNa−). On the other hand if Li+ goes to Mg2+ site, there will be one negative charged left in the lattice site which can be compensated by formation of positively charged F vacancies (VF+) two. This justifies the enhancement of intensity for S1, S2 and S3 signals in Eu0.013+Li0.005+:NaMgF3 compound in comparison to the undoped compound. There is another scenario that if Li+ site goes to surface of the particle and Eu3+ goes to Na+ lattice site. In such case there is complete charge balance and no additional vacant site should be formed and Eu3+ will occupy the Na+ site. However, it is confirmed from both PALS and EPR study that there is a creation of new defect centers and hence rules out this possibility.
 |
| | Fig. 15 Room temperature EPR spectra of NaMgF3 and Eu0.013+Li0.005+:NaMgF3. | |
 |
| | Fig. 16 Room temperature EPR spectra of NaMgF3, & Eu3+:NaMgF3(Eu0.013+:NaMgF3) and Li+–Eu3+:NaMgF3(Eu0.013+Li0.005+:NaMgF3) compounds. | |
3.5. Explanation of emission properties and the correlation with the evolving defect structure
From EPR study it can be conclude that F center might be responsible for the emission characteristics of undoped NaMgF3. These F center may exist either as single vacancies (VF+ or VF0) or cluster vacancies (F2, F2+ etc.). Different F centers create different electronic states inside the band gap, and thus give rise multicolor emission.48 An earlier report on nanocrystalline NaMgF3 showed that a peak around 400 nm can be attributed to surface defect.49,50 Thus the 430 nm can be attributed F center. The emission around 520 nm can be attributed to F2 center. The emission peak at 690 nm might be due to a deep trap state. Now let us correlate the defect structure with the emission properties of Eu3+ which is main part of the interest in this project. As observed in the PL lifetime measurements there are three lifetime components for both Eu0.013+:NaMgF3 and Eu0.013+Li0.005+:NaMgF3 compounds at an emission wavelength of 615 nm which corresponds to the ED transition of Eu3+ ion. The short lived components viz. T1 and T2 (in Table 1) must be due to Eu3+ ion in lattice sites which are very close to a defect structure. Both from reported literature and from our experiences we believe that since the f–f transition of Eu3+ ions are forbidden in nature and the excited state does not come back easily to the ground state, the lifetime values in such order (in case of T1 and T2), must be due to Eu3+ ion exist in a highly asymmetric or distorted environment. From the crystal structure in Fig. 1a, it can be seen that among the two lattice sites of NaMgF3, Mg site with MgF6 octahedron has a symmetrical coordination sphere while that of Na atom has an asymmetrical polyhedron. Further from the shift of the XRD peaks it can be confirmed that most of the Eu3+ ions prefer to be substituted at larger size Na-site. Therefore these two components viz. T1 and T2 must be linked to Na sites. Since Na site has an asymmetric environment, the f–f transition becomes allowed due to mixing of opposite parity to the wave function of the excited state and the ED transition becomes allowed. This is also reflected in the higher intensity of the ED lines. The higher percentage of the T1 and T2 components therefore indicate that Eu3+ ions mostly prefer to go to the Na site. Now the next question arise is why two different lifetime values if Eu3+ goes to the Na-site and why their value and the relative percentage varies (in Table 1) when Li+ ion is co doped? Further T1 component is having lifetime value in the order of few hundreds of microseconds. This indicates that there must be two different kind environments of the Na-lattice sites, wherein Eu3+ ions were being substituted and such different kind of local environment is only possible when the nearby surroundings co-ordination is different. This might be possible either due to existence of different impurity ions or due to different defect centers. We have explained earlier in PALS study that there are two different types of defect centers; Mg mono vacancies and a vacancy cluster consisting of Na, Mg and F vacancies (in Table 2). Being bigger in size the direct impact on the Eu3+ ion emission characteristics will be more by the vacancy cluster (VC) compared to that of the Mg-mono vacancy. Further this vacancy cluster exists in the surface or grain boundaries. Thus the T1 component is due to Eu3+ ion which is close to the VC and exists in the surface or grain boundaries while T2 is due to Eu3+ ions close to Mg mono vacancies. Interestingly, when Li+ is co-doped with Eu3+ ion, the lifetime value of both the two component was increased but with a greater percentage of contribution from the T2 component. This indicates that there must be a change in the configuration of the defect structure when Li+ is co-doped compare to case where only Eu3+ is doped. From positron study it can be seen that when Li+ is co-doped then the size of the vacancy cluster is close to that of the undoped compound, while for the solo Eu3+ doped compound, there is a significant change. Now as we have theoretically calculated various possibilities of the cluster vacancies we have seen that there is an addition of extra Mg-vacancy (created due to charge imbalance) to the vacancy cluster when only Eu3+ is doped as represented by Fig. 14a. However when Li+ ion is co-doped, there is no additional cationic vacancy directly associated with this vacancy cluster but an addition Na-vacancy can be formed a bit far from this vacancy cluster as represented by Fig. 14b, where Li+ and Eu3+ ions are substituting the Mg2+ and Na+ sites near to this vacancy cluster. It is worth to note here that Eu3+ is also not in immediate contact with the vacancy cluster. Therefore the increase in lifetime value for T1 (in Table 1) can be explained based on the fact that the vacancy cluster is decreased in size and Eu3+ ion is also not directly linked to VC and exist in the bulk of the particle. From positron study it was also observed that the percentage of the Mg- mono vacancy was found to decrease along with its size. This may lead to an increase in lifetime value. Now before explaining why the percentage of this T2 component is more among all when Li+ ion is co-doped, let us explain the origin of the T3 component. For both the Eu0.013+Li0.005+:NaMgF3 and Eu0.013+:NaMgF3 compounds, the percentage of this component was found to be less compare to the combined contribution of T1 and T2. Since there is significant difference in lifetime value of the T3 component compare to T1 and T2 components, it is very much possible that T3 originates from a different lattice site with more symmetrical environment such as at Mg-site. Although shifting of the XRD peaks suggest that Eu3+ ions preferably going to Na+ site, however a small percentage of Eu3+ ions at Mg2+ site may not be reflected by the shifting of the XRD peaks. Therefore, we believe that T3 component is due to Eu3+ ion substituting a more symmetrical Mg2+ site. The fact that the size criteria do not prefer Eu3+ ions to go to this site also reflected in their lower percentage for both the compounds. Now the sudden decrease of the lifetime value and its percentage from Eu0.013+:NaMgF3 → Eu0.013+Li0.005+:NaMgF3 can be explained if we see Fig. 14b. It can be seen that when Li+ ion is co-doped, then there is an addition Na+ vacancy which is neighbor to the Mg site. Therefore this new adjacent Na+ vacancy will have a direct impact on the emission properties of Eu3+ ion at Mg site and reduced the lifetime value. In addition to the size mismatch, the additional Na+ vacancies may further do not favor any substitution of Eu3+ ion, when Li+ ion is doped, which is also reflected in the decrease in percentage of the T3 component in Table 1. Now let us explain why the percentage of T2 is more among all. It is now clear that all the three different Eu3+ components are more or less close to defect centers. From positron study, the relative percentage of the 1st component which is due to Mg-mono vacancy is found to decrease when Li+ ion is co-doped while that of the 2nd component i.e. that of VC was found to increase. This decrease in Mg-vacancy's concentration increase the lifetime value of the 2nd PL lifetime component i.e. T2 since less is the defect centers adjacent to Eu3+ ion at Na-site less will be the quenching of the excited state. Further the decrease in concentration of the Mg-vacancy adjacent to Na-site will also energetically favor more substitution at such site as reflected in the relative percentage. As we have already concluded that the T2 component originates from the bulk of the particle, it is obvious that here Eu3+ ions are mostly going to the lattice sites in the bulk of the particle rather than at surface. Finally, we can also conclude that the number and the configuration of the defect clusters are completely different in distorted NaMgF3 perovskite, compared to the perfect cubic KMgF3 perovskite,22 which led to different emission characteristics of Eu3+ ion in NaMgF3.
4. Conclusion
In conclusion, for the first time we have tried to do defect engineering in distorted NaMgF3 perovskite to change the local structure surrounding the Eu3+ dopant ion so that the emission characteristics of Eu3+ ion can be tune, which has a direct impact on the phosphor characteristics. To do the defect engineering, we have doped aliovalent dopant ions with varied concentration to create a charge difference, which in turn led to creation of different defect centers and their cluster. The different Eu3+ and Li+ co-doped samples were synthesized through solid state method and the sintering of the compound has been carried out at inner atmosphere. Various defect centers and their cluster have been characterized by EPR and PALS study. From PL study it has been found that defect and their cluster can create three different local environment surrounding Eu3+ ion and their emission and decay kinetics are completely different. Further, when Li+ ions are co-doped with Eu3+ it has been found that there is a sudden change in the decay kinetics and the emission profile. EPR study confirmed the presence of different type of F-centers and Mg vacancies. The F-centers are responsible for the host emission. From PALS study it was confirmed that the cluster of the defect centers or vacancy cluster (VC) have different positron lifetime values in Eu3+ doped and Li+ co-doped samples. With the help of theoretical calculation based on first principle calculation, we have calculated the theoretical lifetime values for different configured vacancy clusters in addition to the mono vacancies, and found that the configuration of the vacancy clusters changes upon changing the dopant composition. The experimental positron lifetime values are well aligned with the theoretically calculated ones. Finally from the position and configuration of the mono and cluster vacancies, we have concluded that different lifetime and emission profile of Eu3+ ions depend on the relative distance with respect to the cluster and mono vacancies and also their existence on the surface or in the bulk of the particles. More close is the Eu3+ ion to the cluster vacancies; more asymmetric environment will be surrounding the Eu3+ ion, which in turn will reduce the lifetime value. A little more distance from the cluster vacancy changed both the emission profile and lifetime value. It was also observed that the number and the configuration of the defect clusters are completely different in distorted NaMgF3 perovskite, compared to the perfect cubic KMgF3 perovskite.
Author contribution statement
The authors confirm contribution to this work is as follows.
Sumanta Mukherjee: preparation of compounds, characterization of the compounds using XRD, FTIR and SEM, writing – XRD and FTIR part.
Nimai Pathak: conceptualization, methodology, supervision, visualization, resources, PL and EPR investigation, data analysis, writing – initial draft, reviewing and editing.
Debarati Das: positron lifetime calculation using MIKA/DOPPLER package.
Dhanadeep Dutta: positron lifetime measurements and the relative data analysis, writing – positron lifetime part and reviewing it.
Conflicts of interest
There are no conflicts to declare.
Acknowledgements
Authors thank to Dr P. K. Pujari, Director, Radiochemistry and Isotope group for his encouragement and help during the course of this project. Authors thank Dr R. M. Kadam, RCD, for his guidance during EPR experiments. Aauthors also thank Dr Bal Govind Vats and Rahul Agarwal, FCD, for their help during FTIR and SEM experiments. No external funding agency has been involved and all the research expenses have been borrowed from our institute that is BARC, Mumbai.
References
- T. Jüstel, H. Nikol and C. Ronda, Angew. Chem., Int. Ed., 1998, 37, 3084–3103 CrossRef.
- H. A. Höppe, Angew. Chem., Int. Ed., 2009, 48, 3572–3582 CrossRef.
- C. C. Lin and R. S. Liu, J. Phys. Chem. Lett., 2011, 2, 1268–1277 CrossRef CAS.
- Y. Hu, W. Zhuang, H. Ye, D. Wang, S. Zhang and X. Huang, J. Alloys Compd., 2005, 390, 226–231 CrossRef CAS.
- X. Yan, W. Li, X. Wang and K. Sun, J. Electrochem. Soc., 2011, 159, H195 CrossRef.
- R. S. Yadav, R. K. Dutta and M. K. Pandey, J. Lumin., 2009, 129, 1078–1082 CrossRef CAS.
- K. Das, A. Marathe, X. Zhang, Z. Zhao and J. Chaudhuri, RSC Adv., 2016, 6, 95055–95061 RSC.
- P. Das, N. Pathak, P. Modak and B. Modak, J. Hazard. Mater., 2020, 411, 125025 CrossRef.
- P. Das, N. Pathak, B. Sanyal, S. Dash and R. M. Kadam, J. Alloys Compd., 2019, 810, 151906 CrossRef CAS.
- K. Sanyal, N. Pathak, A. K. Yadav, B. Kanrar, R. M. Kadam, S. N. Jha, D. Bhattacharya and N. L. Misra, Dalton Trans., 2016, 45, 7650–7664 RSC.
- Z. Song, J. Zhao and Q. Liu, Inorg. Chem. Front., 2019, 6, 2969–3011 RSC.
- D. J. Daniel, O. Annalakshmi, U. Madhusoodanan and P. Ramasamy, J. Rare Earths, 2014, 32, 496–500002E CrossRef CAS.
- J. Barzowska, T. Lesniewski, S. Mahlik, H. J. Seo and M. Grinberg, Opt. Mater., 2018, 84, 99–102 CrossRef CAS.
- J. Cao, H. Guo, F. Hu, L. Li, S. Xu and M. Peng, J. Am. Ceram. Soc., 2018, 101(9), 3890–3899 CrossRef CAS.
- S. Li, X. Zhang, Z. Hou, Z. Cheng, P. Ma and J. Lin, Nanoscale, 2012, 4, 5619–5626 RSC.
- R. X. Yan and Y. D. Li, Adv. Funct. Mater., 2005, 15, 763–770 CrossRef CAS.
- D. Cortecchia, S. Neutzner, A. R. S. Kandada, E. Mosconi, D. Meggiolaro, F. D. Angelis, C. Soci and A. Petrozza, J. Am. Chem. Soc., 2017, 139(1), 39–42 CrossRef CAS.
- E. Rönnebro, D. Noréus, K. Kadir, A. Reiser and B. Bogdanovic, J. Alloys Compd., 2000, 299, 101–106 CrossRef.
- C. R. Riley, S. I. Yun and W. A. Sibley, Phys. Rev. B: Solid State, 1972, 5, 3285–3292 CrossRef.
- C. R. Riley and W. A. Sibley, Phys. Rev. B: Solid State, 1970, 1, 2789–2798 CrossRef.
- N. Pathak, S. K. Gupta, P. S. Ghosh, A. Arya, V. Natarajan and R. M. Kadam, RSC Adv., 2015, 5, 17501–17513 RSC.
- N. Pathak, S. Mukherjee, D. Das, D. Dutta, S. Dash and R. M. Kadam, J. Mater. Chem. C, 2020, 8, 7149–7161 RSC.
- P. Das, N. Pathak, S. Mukherjee, M. Shafeeq, S. Dash and R. M. Kadam, ChemistrySelect, 2019, 4, 2766–2773 CrossRef CAS.
- N. Pathak, S. K. Gupta, A. Prince, R. M. Kadam and V. Natarajan, J. Mol. Struct., 2014, 1056, 121–126 CrossRef.
- B. Kanrar, N. Pathak, C. Nayak, C. L. Prajapat, R. M. Kadam, S. N. Jha, D. Bhattacharyya, G. Ravikumar and N. L Misra, J. Mater. Chem. C, 2017, 5, 8836–8846 Search PubMed.
- S. K. Gupta, N. Pathak, P. S. Ghosh, B. Rajeshwari, V. Natarajan and R. M. Kadam, Temperature dependent electron paramagnetic resonance (EPR) of SrZrO3, J. Magn. Magn. Mater., 2015, 391, 101–107 CrossRef CAS.
- N. Pathak, S. K. Gupta, C. L. Prajapat, S. K. Sharma, P. S. Ghosh, B. Kanrar, P. K. Pujari and R. M. Kadam, Phys. Chem. Chem. Phys., 2017, 19, 11975–11989 RSC.
- N. Pathak, P. S. Ghosh, S. Saxena, D. Dutta, A. K. Yadav and D. Bhattacharyya, Inorg. Chem., 2018, 57(7), 3963–3982 CrossRef CAS.
-
(a) C. H. Perry and E. F. Young, J. Appl. Phys., 1967, 38, 4616 CrossRef CAS;
(b) M. L. Lesiecki and J. W. Nibler, J. Chem. Phys., 1976, 64, 871 CrossRef CAS.
- G. W. Chantry, E. A. Nicoi, H. A. Willis and M. E. A. Cudby, Int. J. Infrared Millimeter Waves, 1981, 2, 97–105 CrossRef CAS.
- X. Zhang, Z. Quan, J. Yang, P. Yang, H. Lian and J. Lin, J. Colloid Interface Sci., 2009, 329, 103–106 CrossRef CAS.
- R. Phatak, N. Pathak, S. Muhammed, S. K. Sali and A. Das, ChemPlusChem, 2018, 83, 1144–1152 CrossRef CAS.
- R. Phatak, N. Pathak, S. Muhammed, A. Das and S. K. Sali, J. Am. Ceram. Soc., 2020, 103, 2617–2629 CrossRef CAS.
-
(a) N. Pathak, S. Mukherjee, B. P. Mandal, A. K. Yadav, S. N. Jha and D. Bhattacharyya, Mater. Adv., 2020, 1, 2380–2394 RSC;
(b) N. Pathak, P. S. Ghosh, S. Mukherjee and B. P. Mandal, RSC Adv., 2020, 10, 31070–31086 RSC.
- D. Hebbar, K. S. Choudhari, N. Pathak, S. A. Shivashankar and S. D. Kulkarni, J. Alloys Compd., 2018, 768, 676–685 CrossRef.
- S. K. Gupta, P. S. Ghoshb, N. Pathak and R. M. Kadam, RSC Adv., 2016, 6, 42923–42932 RSC.
- Y. W. Wang, L. Zhou, H. Xu, Q. Xia, L. Liu, X. Liu and L. Li, Ceram. Int., 2017, 43, 13089–13093 CrossRef.
- M. Xie, Y. Li and R. Li, J. Lumin., 2013, 136, 303–306 CrossRef CAS.
- N. Pathak, P. S. Ghosh, S. K. Gupta, S. Mukherjee, R. M. Kadam and A. Arya, J. Phys. Chem. C, 2016, 120, 4016–4031 CrossRef CAS.
- N. Pathak, P. S. Ghosh, S. K. Gupta, R. M. Kadam and A. Arya, RSC Adv., 2016, 6, 96398–96415 RSC.
- M. Bertolicini, A. Bisi, G. Gambarini and L. Zappa, J. Phys. C: Solid State Phys., 1974, 4, 830 Search PubMed.
- T. Torsti, T. Eirola, J. Enkovaara, T. Hakala, P. Havu, V. Havu, T. Höynälänmaa, J. Ignatius, M. Lyly, I. Makkonen, T. T. Rantala, J. Ruokolainen, K. Ruotsalainen, E. Räsänen and H. Saarikoski, Phys. Status Solidi B, 2006, 243, 1016 CrossRef CAS.
- Doppler: A program to model positron states and annihilation in solids, Laboratory of Physics, Helsinki University of Technology, September 2003 Search PubMed.
- M. J. Puska and R. M. Nieminen, Rev. Mod. Phys., 1994, 66(3), 841–897 CrossRef CAS.
- B. Barbiellini, M. J. Puska, T. Torsti and R. M. Nieminen, Phys. Rev. B: Condens. Matter Mater. Phys., 1995, 51, 7341 CrossRef.
- L. Kaplan and P. J. Bray, Phys. Rev., 1963, 129, 1919–1935 CrossRef.
- V. S. Singh, C. P. Joshi, G. T. K. Rao and S. V. Moharil, J. Alloys Compd., 2016, 657, 848–854 CrossRef CAS.
- J. J. Schuyt and G. V. M. Williams, Opt. Mater.: X, 2019, 1, 100010 CAS.
- G. V. M. Williams, S. Janssens, C. Gaedtke, S. G. Raymond and D. Clarke, J. Lumin., 2013, 143, 219–225 CrossRef CAS.
- G. V. M. Williams, J. J. Schuyt and A. S. Madathiparambil, Opt. Mater., 2018, 84, 763–770 CrossRef CAS.
Footnote |
| † Electronic supplementary information (ESI) available. See DOI: 10.1039/d0ra10008k |
|
| This journal is © The Royal Society of Chemistry 2021 |
Click here to see how this site uses Cookies. View our privacy policy here. 
 Open Access Article
 This Open Access Article is licensed under a Creative Commons Attribution-Non Commercial 3.0 Unported Licence
 *b,
Debarati Dasb and
Dhanadeep Duttabc
*b,
Debarati Dasb and
Dhanadeep Duttabc


 with neighboring 6 F− vacancy shows the positron lifetime ∼0.463 ns which is very close to the experimental value of τ2. A representation of this vacancy cluster along with the undoped NaMgF3 is given in Fig. 13. After doping with Eu3+, the experimental τ1 value (0.239 ns), which is very close to the theoretically calculated value of Mg mono vacancy (0.240 ns) along with its high intensity (∼74%) indicates the possibility that Eu3+ ion sits at the Na+ position and one extra Mg2+ vacancy (VMg2−) is created to balance the electron charge as shown in Table 3. The τ2 value (0.527 ns) is larger than the calculated positron lifetime in Na or Mg mono- or di-vacancies; rather it is very close to the vacancy cluster (Vc) in the Eu3+ doped matrix (0.525 ns) as shown in Fig. 14a, which signifies the presence of large surface defects as in the un-doped sample producing large value of τ2. The scenario is different when the matrix is co-doped with Li+ and Eu3+ ions. The comparison of experimental τ1 value (0.206 ns) with the calculated positron lifetime in Table 3 suggests the possibility that Eu3+ ion sits in the position of Na+ and Li+ in the position of Mg2+ along with creation of a Mg2+ mono-vacancy or two Na+ vacancy in the matrix. The experimental τ2 value is very close to the value of calculated positron lifetime in the vacancy clusters (Vc) in the co-doped matrix. Therefore the vacancy cluster retained its configuration but a slight change in surrounding as shown Fig. 14b. The calculated lifetime value for this vacancy cluster (Vc) as shown in Table 3 is 0.448 ns. From Fig. 14, it can be said that the configuration of defect cluster in distorted NaMgF3 is different from that of perfect cubic KMgF3 perovskite.22