 Open Access Article
Integrated all-solid-state sulfite sensors modified with two different ion-to-electron transducers: rapid assessment of sulfite in beverages
Hisham S. M. Abd-Rabboh ab,
Abd El-Galil E. Amr
 *cd,
Ayman H. Kamel
 *a,
Mohamed A. Al-Omarb and
Ahmed Y. A. Sayedc
aDepartment of Chemistry, Faculty of Science, Ain Shams University, Cairo 11566, Egypt. E-mail: ahkamel76@sci.asu.edu.eg; Tel: +20-1000361328
bChemistry Department, Faculty of Science, King Khalid University, Abha 61413, Saudi Arabia. E-mail: habdrabboh@kku.edu.sa
cPharmaceutical Chemistry Department, College of Pharmacy, King Saud University, Riyadh 11451, Saudi Arabia. E-mail: malomar1@ksu.edu.sa; ahmedyahia009@gmail.com; aamr@ksu.edu.sa; Tel: +966-565-148-750
dApplied Organic Chemistry Department, National Research Center, Dokki 12622, Giza, Egypt
First published on 19th January 2021
Abstract
An integrated all-solid-state screen-printed ion-selective potentiometric sensor for rapid assessment of sulfite ion in beverages, based on analytical transduction, is described. The constructed potentiometric cell incorporates a polymeric membrane sulfite ion-selective electrode based on cobalt(II) phthalocyanine (CoPC) as a recognition material and an Ag/AgCl reference electrode with a polyvinyl butyral reference membrane. Two different solid-contact transducers, namely multi-walled carbon nanotubes (MWCNTs) and polyaniline (PANI) were used for a comparative study. The presented sensors exhibited a rapid Nernst response across the concentration ranges from 2.0 × 10⁻⁶ to 2.3 × 10⁻³ M and from 5.0 × 10⁻⁶ to 2.3 × 10⁻³ M with detection limits equal to 1.1 × 10⁻⁶ M and 1.5 × 10⁻⁶ M for sensors based on MWCNTs and PANI, respectively. The proposed sensors manifested high selectivity and sensitivity, enhanced stability and low cost that provides a wide number of potential applications for food analysis. Good performance characteristics were obtained for the proposed method after applying the validation requirements. Method precision, accuracy, bias, trueness, repeatability, reproducibility, and uncertainty are examined. These analytical capabilities support the rapid and direct determination of sulfite in different beverage samples. The analytical results were verified and compared with the standard iodometric method.
1. Introduction
For centuries, sulfite has been extensively used as a preservative agent in the food industry, and beverages, in addition to some pharmaceutical products.1,2 The role of sulfite is to prevent oxidation, browning occurring via enzymatic and non-enzymatic reactions, and bacterial growth in such products.3 Sulfite has a negative effect on human health, especially for people suffering from sulfite oxidase deficiency disease. So, the amount of sulfite in food should be well controlled. The United States Food and Drug Administration (US-FDA) has set the maximum sulfite content in non-alcoholic beverages, and wine products as 10 μg mL−1.4,5 Therefore, the need for sensitive, highly selective, fast, and cost-effective methods for sulfite assessment is in great demand. These methods should be developed for quality control and quality assurance (QC/QA) in the food industry.6 Different analytical techniques were presented in the literature for sulfite determination. Some of these techniques include spectrophotometry,7,8 spectrofluorimetry,9–11 chemiluminescence spectrometry,12–14 and phosphorimetry.15 Chromatography based techniques have been widely used for sulfite determination including ion chromatography (IC),16 gas chromatography (GC),17 liquid chromatography (LC),18,19 electrophoresis20 and ion exclusion chromatography.21 Biosensors based on electrochemical transduction using enzymes were also reported for sulfite determination.22–24 Most of these reported methods and techniques have several drawbacks including low selectivity, time consumption, need for expensive equipment; require tedious sample pre-treatment steps and low efficiency for sulfite determination in real food samples.Electrochemical techniques, especially potentiometric ion-selective electrodes, can be considered as good alternatives to other reported techniques for sulfite determination. They are characterized by their high sensitivity and selectivity, low-cost instrumentation, no sample pre-treatment is required and eases of operation. Potentiometric electrodes based on neutral or charged carrier ionophores have been widely introduced for detecting several ions either in medical, environmental, or industrial samples.25–30 Only few reports regarding potentiometric sensors for sulfite anion determination were reported in the literature.31–33 On the other hand, there is no commercial sulfite electrodes are available in the market till now for the determination of sulfite.
Nowadays, all-solid-state potentiometric electrodes have attracted great interest in ion sensing for diverse applications such as clinical and environmental fields due to their outstanding properties such as high portability, simplicity of use, affordability and flexibility.34–38 They are now recognized as the next generation for ion-sensing potentiometric electrodes. When the ion-sensing membrane is directly casted on the electronic conductor (i.e. Coated wire electrodes, CWEs), an unstable boundary potential response is induced because of the unfavorable blocked interface between the sensing membrane and electronic conductor. An ion-to electron transducing material, which is inserted between the ion-sensing membrane (ISM) and the electronic conducting substrate, is assigned as the essential part for designing robust, and reliable solid-state potentiometric electrodes. Actually, the existence of ion-to electron transducer can enhance the long-term stability and the reproducibility of these types of electrodes.
In this work, we offered a simple, reliable and whole-cell all-solid-state screen printed potentiometric sensors based on cobalt(II) phthalocyanine ionophore for detecting sulfite ions. Polyaniline (PAN) and multi-walled carbon nanotubes (MWCNTs) films were used as the solid contact transducers. The sensors offered low detection limit, wide linearity, enhanced selectivity, high accuracy, long term stability, rapid response time with low fabrication cost, and are suitable for quality control/quality assurance in beverage industry.
2. Materials and methods
2.1. Apparatus
A PXSJ-216 pH per mV meter (INESA Scientific Instrument Co., Ltd, Shanghai, China) was used for all potentiometric measurements at room temperature. Metrohm DropSens Screen-Printed Carbon electrodes were used for chronpotentiometric measurements. The working (4 mm diameter) and auxiliary electrodes are made of carbon, while reference electrode is made from Ag/AgCl (Ref. C11L, Ceramic substrate: L33 × W10 × H0.5 mm). Screen-Printed Carbon Electrodes (SPCEs) (Ceramic substrate: L33 × W10 × H0.5 mm with silver electric contact) modified with either carboxyl functionalized multi-walled carbon nanotubes (MWCNT–COOH/carbon) (ref. 110CNT) or polyaniline (PANI/carbon) (ref. 110PANI) were used. Metrohm potentiostat/galvanostat (Autolab, model 204, Herisau, Switzerland) was used for these measurements.2.2. Chemicals and reagents
De-ionized water (specific resistance = 18.2 MΏ cm) obtained with a Pall-Cascada laboratory water system was used for solution preparations. Tridodecylmethylammonium chloride (TDMAC), high molecular weight PVC and 2-nitrophenyl octyl ether (o-NPOE) were obtained from Sigma-Aldrich. Cobalt(II) phthalocyanine (CoPC) was purchased from Midcenturey (Posen, IL, USA). Tetrahydrofuran (THF), freshly distilled prior to use, was purchased from Fluka Chemika-BioChemika (Ronkonkoma, NY, USA). All other chemicals were of analytical grade and used as received without any prior treatment. All potential measurements were performed in 1![[thin space (1/6-em)]](https://www.rsc.org/images/entities/char_2009.gif) :
:![[thin space (1/6-em)]](https://www.rsc.org/images/entities/char_2009.gif) 1 mix of 10 mM NaCl and 10 mM phosphate buffer solution (PBS) of pH 6. The liquid junction potentials and the activity coefficients were corrected according to the Henderson and Debye–Huckel equations, respectively.
1 mix of 10 mM NaCl and 10 mM phosphate buffer solution (PBS) of pH 6. The liquid junction potentials and the activity coefficients were corrected according to the Henderson and Debye–Huckel equations, respectively.
2.3. Sensors' fabrication and calibration
The ion-sensing membrane (ISM) was prepared after dissolving of 32.0 mg of PVC powder, 63.0 mg of o-NPOE as a plasticizer, 2.0 mg of TDMAC additive and 3.0 mg of CoPC in 2 mL THF. From the homogeneous solution, a 15 μL of the sensing membrane solution and that of the PVB reference membrane solution, was drop-cast over the modified screen-printed electrode and the Ag/AgCl ink electrode surface, respectively. The same step is also done for unmodified screen-printed electrodes (C/SO32−-ISE) to prepare coated-wire electrodes (CWEs). Conditioning of the proposed sensor was carried out after soaking at first in 1.0 × 10⁻³ M sulfite solution for 2 h and then in 10−8 M sulfite solution for two days before use. When the electrodes are not in use, the storage was carried out in a mixture of 10 mM NaCl and 10 mM phosphate buffer solution (PBS) of pH 6. Potential values were recorded for different sulfite concentrations after potential stabilization of ±0.1 mV and were plotted versus the logarithm of sulfite ion concentration to construct the calibration curve.2.4. Analytical applications
In food/beverage matrices, sulfiting agents producing different species including sulfite, bisulfite, metabisulfite, and other sulfite forms depending on the pH of the food/beverage.39 The level of sulfite in some beverage samples collected from the local market was evaluated using the proposed electrodes. A comparison in parallel for sulfite monitoring was carried out using the standard iodometric method. To a 25 mL beaker containing 5 mL of a 1![[thin space (1/6-em)]](https://www.rsc.org/images/entities/char_2009.gif) :
:![[thin space (1/6-em)]](https://www.rsc.org/images/entities/char_2009.gif) 1 mix of 10 mM NaCl and 10 mM phosphate buffer solution (PBS) of pH 6, a 5 mL aliquot of the beverage sample was added and the solution was stirred. The proposed electrode was then immersed in the solution in conjunction with the reference electrode and the potential was recorded. The level of sulfite content in the measured samples was calculated using the constructed calibration plot. In absence of the beverage sample, the blank experiment was carried out under the same conditions.
1 mix of 10 mM NaCl and 10 mM phosphate buffer solution (PBS) of pH 6, a 5 mL aliquot of the beverage sample was added and the solution was stirred. The proposed electrode was then immersed in the solution in conjunction with the reference electrode and the potential was recorded. The level of sulfite content in the measured samples was calculated using the constructed calibration plot. In absence of the beverage sample, the blank experiment was carried out under the same conditions.
The standard iodometric method was used for comparison with the proposed potentiometric method. In this standard method, a 100 mL aliquot of the test sample was transferred to a 250 mL measuring flask with 1 mL of 1![[thin space (1/6-em)]](https://www.rsc.org/images/entities/char_2009.gif) :
:![[thin space (1/6-em)]](https://www.rsc.org/images/entities/char_2009.gif) 1 H2SO4 and 0.1 g sulfamic acid. A 1 mL of soluble starch solution as an indicator was added to the solution. The titration process was conducted using 2 mM standard KI/KIO3 solution [0.4458 g KIO3 + 4.35 g KI + 310 mg NaHCO3 in 1 L de-ionized water]. The observed end point was characterized by the existence of the dark purple color (1.00 mL of the titrant = 500 μg sulfite).
1 H2SO4 and 0.1 g sulfamic acid. A 1 mL of soluble starch solution as an indicator was added to the solution. The titration process was conducted using 2 mM standard KI/KIO3 solution [0.4458 g KIO3 + 4.35 g KI + 310 mg NaHCO3 in 1 L de-ionized water]. The observed end point was characterized by the existence of the dark purple color (1.00 mL of the titrant = 500 μg sulfite).
3. Results and discussion
3.1. Sensors' performance characteristics
Solid-contact screen-printed sulfite-selective electrodes based on a polymeric membrane containing cobalt(II) phthalocyanine ionophore were evaluated and studied. The electrodes were modified with two different solid-contact transducers namely MWCNTs and PANI. The polymeric membrane contains CoPC as an ionophore, TDMAC as ionic additive, o-NPOE as a solvent mediator, and PVC as a polymeric matrix. The calibration plot was made in a background solution containing 1![[thin space (1/6-em)]](https://www.rsc.org/images/entities/char_2009.gif) :
:![[thin space (1/6-em)]](https://www.rsc.org/images/entities/char_2009.gif) 1 mixture of 1 mM NaCl and 1 mM PBS at pH 6. Sensors based on MWCNTs (sensor I) and PANI (sensor II) ion-to electron transducers revealed a linear potential response over the concentration ranges of 2.0 × 10⁻⁶ to 2.3 × 10⁻³ M and 5.0 × 10⁻⁶ to 2.3 × 10⁻³ M with Nernstian slopes of −29.8 ± 0.4 and −26.5 ± 0.6 mV per decade, and detection limits of 1.1 × 10⁻⁶ and 1.5 × 10⁻⁶ M, respectively (Fig. 1). Un-modified electrode (sensor III) (i.e. in absence of solid-contact transducer) was also checked for comparison. It revealed a linear potential response over the concentration range of 7.2 × 10⁻⁶ to 2.3 × 10⁻³ M with a Nernstian slope of −28.8 ± 0.7, and a detection limit of 2.7 × 10⁻⁶ M. All performance characteristics of the proposed sensors were summarized in Table 1.
1 mixture of 1 mM NaCl and 1 mM PBS at pH 6. Sensors based on MWCNTs (sensor I) and PANI (sensor II) ion-to electron transducers revealed a linear potential response over the concentration ranges of 2.0 × 10⁻⁶ to 2.3 × 10⁻³ M and 5.0 × 10⁻⁶ to 2.3 × 10⁻³ M with Nernstian slopes of −29.8 ± 0.4 and −26.5 ± 0.6 mV per decade, and detection limits of 1.1 × 10⁻⁶ and 1.5 × 10⁻⁶ M, respectively (Fig. 1). Un-modified electrode (sensor III) (i.e. in absence of solid-contact transducer) was also checked for comparison. It revealed a linear potential response over the concentration range of 7.2 × 10⁻⁶ to 2.3 × 10⁻³ M with a Nernstian slope of −28.8 ± 0.7, and a detection limit of 2.7 × 10⁻⁶ M. All performance characteristics of the proposed sensors were summarized in Table 1.
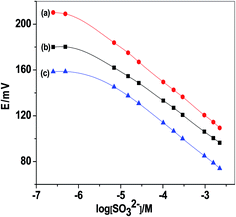 | ||
| Fig. 1 Calibration plot of sulfite PVC membrane-based sensors: (a) C/MWCNTs/SO32− ISE (sensor I); (b) C/PANI/SO32− ISE (sensor II); and (c) C/SO32− ISE (sensor III). | ||
| Parameter | Sensor I | Sensor II | Sensor III |
|---|---|---|---|
| Slope (mV per decade) | −29.8 ± 0.4 | −26.5 ± 0.6 | −28.8 ± 0.7 |
| Correlation coefficient (r2) | 0.998 | 0.999 | 0.999 |
| Linear range (M) | 2.0 × 10⁻⁶ to 2.3 × 10⁻³ | 5.0 × 10⁻⁶ to 2.3 × 10⁻³ | 7.2 × 10⁻⁶ to 2.3 × 10⁻³ |
| Detection limit (M) | 1.1 × 10⁻⁶ | 1.5 × 10⁻⁶ | 2.7 × 10⁻⁶ |
| Working acidity range (pH) | 5–7.2 | 4.8–7.7 | 5–7 |
| Response time (s) | <5 | <5 | <5 |
| Accuracy (%) | 99.2 | 98.9 | 98.7 |
| Precision (%) | 1.1 | 0.8 | 0.9 |
| Trueness (%) | 99.2 | 99.1 | 98.8 |
| Bias (%) | 0.7 | 0.9 | 1.2 |
| Within-day repeatability (%) | 0.4 | 0.9 | 1.1 |
| Between-days variations (%) | 0.8 | 0.3 | 0.9 |
For routine analysis and industrial purposes, it is essential to test the life span of the presented sensors. Therefore, the performance characteristics of these sensors were evaluated day-to-day by daily calibration. It was found that the slope and detection limit were constants over six working-days. After the sixth day to the 15th day, both calibration slope and detection limit start to decline. After two weeks working, a complete electrode failure was observed. Therefore, all performance characteristics of the proposed electrode such as detection limit, response time, linear range and calibration slope were found to be reproducible within their original values over a period of at least one week.
The pH effect on the potential response of the proposed sulfite sensors was evaluated after changing the pH of 1 mM sulfite solution in 1 mM NaCl background solution from pH 3 to 11 using CH3COOH and NaOH concentrated solutions. The pH versus potential was plotted and represented as Fig. 2. It was found that the sensors revealed a constant potential for the above-mentioned concentration over the pH ranges 5 to 7.2, 4.8 to 7.7 and 5 to 7 for sensors I, II and III, respectively. At pH > 8, the potential is interrupted due to the severe interference coming from OH− ions. At pH < 3, the potential is sharply increased due to the formation of the un-detectable H2SO3/HSO3− species (pKa = 1.89). So, all subsequent measurements were carried out in 1 mM PBS of pH 6, containing 1 mM Na2SO4 as a background solution.
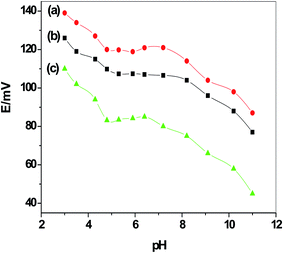 | ||
| Fig. 2 pH plot for all sulfite PVC membrane-based sensors in 1 mM sulfite solution: (a) C/MWCNTs/SO32− ISE (sensor I); (b) C/PANI/SO32− ISE (sensor II); and (c) C/SO32− ISE (sensor III). | ||
Response times for the presented sensors were assessed by recording the time required to attain 95% of the equilibrium steady-state potential (within ±0.3 mV). It was found that all suggested sensors have a response time of <5 s over all sulfite concentrations in the range of 1.0 × 10⁻⁶ to 1.0 × 10⁻³ M. The real-time potentiometric response of the developed ion-selective electrodes was shown in Fig. 3.
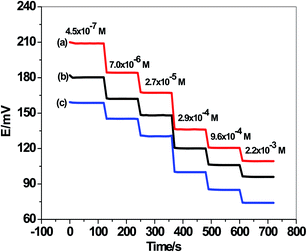 | ||
| Fig. 3 Real-time potentiometric response of the developed ion-selective electrodes. (a) C/MWCNTs/SO32− ISE (sensor I); (b) C/PANI/SO32− ISE (sensor II); and (c) C/SO32− ISE (sensor III). | ||
Precision and accuracy of the proposed method were evaluated after replicate measurements of internal quality control sulfite samples (IQC) containing 1.0, 10.0, 50.0 and 100.0 μg mL−1 sulfite, (n = 6, each). The relative standard deviations (RSD) were found to be in the range 1.1 ± 0.3 to 0.8 ± 0.02%, 0.9 ± 0.02 to 1.3 ± 0.2% and 1.2 ± 0.4 to 0.9 ± 0.05% for sensors I, II and III, respectively. Eqn (1) is used to calculate the method precision, in which the average of sulfite results is (X) and the standard deviation is (S).
| Precision, % = (S/X) × 100 | (1) |
Absolute uncertainty is expressed as: X sulfite value ± precision.
Accuracy of the test method was evaluated by spiking a reference sample with known sulfite amount. It was calculated using eqn (2) and found to be 99.2 ± 0.6 to 98.7 ± 0.3%.
| Accuracy, % = [(Xs − X)/Xadd] × 100 | (2) |
Trueness and bias of the test method were evaluated after replicate analyses carried out on standard sulfite samples (1.0, 10.0, 50.0 and 100.0 μg mL−1 sulfite) according to eqn (3) and (4), respectively.
| Trueness, % = (X/μ) × 100 | (3) |
| Bias, % = [(X − μ)/μ] × 100 | (4) |
Method repeatability and reproducibility were measured after detecting the spread of results of a sulfite sample (10–100 μg mL−1) either in the same day or on different days. The data obtained were collected after measuring the sulfite reference sample using different sensor assembly and different instruments at different times.
Reproducibility (R) is evaluated from eqn (5) after calculating the standard deviation (SR) of the results obtained.
| R = 2.8 × SR | (5) |
The obtained data for reproducibility within-day and between-days were calculated and registered as 0.4 ± 0.02 to 1.1 ± 0.2% and 0.8 ± 0.05 to 0.3 ± 0.05% for sensors I and II, respectively.
3.2. Selectivity
One of the most important parameters for sensors' characterization is to evaluate their selectivity behavior. Potentiometric selectivity coefficients of the proposed electrodes were evaluated using the modified separate solutions method (MSSM).40 All anions used in this study were in either their sodium or potassium form. Table 2 summarized the selectivity coefficient values for all tested anions. All measurements were performed within the concentration range of 1 × 10⁻⁵ M to 1 × 10⁻² M solutions of interfering anions. The selectivity patterns for the proposed sensors were in the orders: SO32− > NO3− > NO2− > Cl− > CH3COO− > F− > SO42− > PO43−; SO32− > NO2− > NO3− > CH3COO− > Cl− > F− > SO42− > PO43−; and SO32− > NO3− > Cl− > CH3COO− > NO2− > F− > SO42− > PO43− for sensors I, II and III, respectively. It was noticed that the revealed enhanced selectivity towards sulfite ions obeyed the anti-Hofmeister order and in accordance with
  order reported with other metallo-phthalocyanine based sensors designed for other anions.41,42
 for the proposed sulfite sensorsa
| Sensor type | |||||||
|---|---|---|---|---|---|---|---|
| NO3− | NO2− | Cl− | CH3COO− | F− | SO42− | PO43− | |
| a ±: standard deviation of 4 measurements. | |||||||
| Sensor I | −4.2 ± 0.2 | −4.7 ± 0.1 | −4.9 ± 0.1 | −5.1 ± 0.1 | −5.7 ± 0.1 | −5.9 ± 0.2 | −6.3 ± 0.1 |
| Sensor II | −4.5 ± 0.1 | −4.4 ± 0.3 | −4.8 ± 0.2 | −4.7 ± 0.3 | −5.2 ± 0.4 | −5.5 ± 0.4 | −6.1 ± 0.3 |
| Sensor III | −4.1 ± 0.3 | −4.7 ± 0.1 | −4.3 ± 0.4 | −4.5 ± 0.4 | −5.3 ± 0.3 | −6.1 ± 0.1 | −6.2 ± 0.2 |
3.3. Redox/double-layer capacitance measurements
The well-defined ion-to-electron transduction processes of solid contact ion-selective electrodes (SC-ISEs) are governed by the existence of a redox/double-layer capacitance at the ion-sensing membrane/solid contact (ISM/SC) interface. This redox/double-layer capacitance is affected by the inherent characteristics of the solid-contact functional materials used as ion-to-electron transducers. These materials act as asymmetric capacitors based on redox/double-layer capacitance, allowing charging/discharging over a small but finite measuring current during potentiometric measurements.43 In this work we compare between the effects of two different solid contact transducers on the sensors' response. The first one is polyaniline (PANI), which is assigned as a conducting polymer and generates a redox capacitance on the interface between ISM and SC substrate. This generated redox capacitance relies on the redox buffering capacity that comes from the intrinsic properties of ionic and electronic conductivities, which can be affected by the doping agents. The ion-to-electron transduction using PANI layer can be considered as a surface-confined charge-transfer process that only occurs on its surface, and depends on its surface reactivity and electrical capacitance, not its thickness. The other transducer is MWCNTs, in which the ion-to-electron transduction is based on the formation of a double-layer capacitance at ISM/SC interface. The electrical double layer is created after the attraction of the electrons/holes in the solid-contact side and the anions/cations in the ISM side. This interfacial capacitance has a remarkable effect on the potential stability of the solid-contact electrodes; as it increases, it allows an enhanced potential stability. The response mechanism in presence of either PANI or MWCNTs layers were presented in Fig. 4.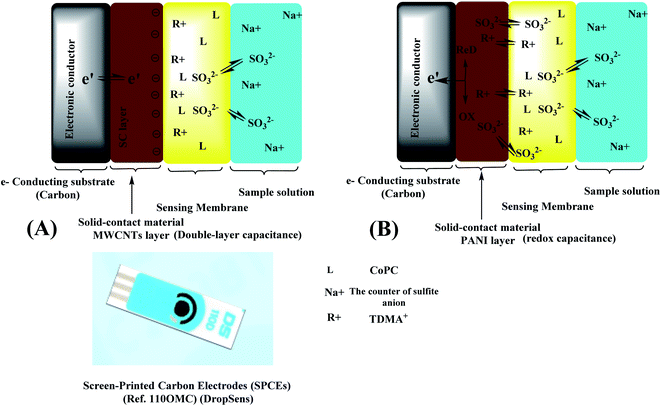 | ||
| Fig. 4 Schematic representation of (A) an SC-ISE with PANI layer (redox capacitance layer) and (B) an SC-ISE MWCNTs layer (double-layer capacitance layer). | ||
To evaluate the potential stability of these electrodes and the interfacial capacitances in absence and presence of solid-contact transducer, reversed-current chronopotentiometry technique was used.44 After applying the current I = ±1 nA, the chronopotentiograms for both C/MWCNTs/SO32− ISE (sensor I) and C/PANI/SO32− ISE (sensor II), together with C/SO32− ISE (sensor III) are shown in Fig. 5. The potential drifts (ΔE/Δt) were calculated to be 38.3, 41.2 and 173.2 μV s−1 for sensors I, II and III, respectively.
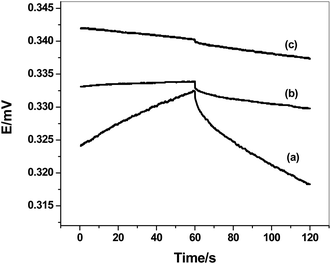 | ||
| Fig. 5 Chronopotentiometry for sulfite-ISEs (a) C/SO32− ISE (sensor III); (b) C/MWCNTs/SO32− ISE (sensor I) and (c) C/PANI/SO32− ISE (sensor II). | ||
Long-term stability of both C/MWCNTs/SO32−-ISE (sensor I) and C/PANI/SO32−-ISE (sensor II), together with C/SO32−-ISE (sensor III) were also checked due to that the adhesion between ISM and substrate might decrease in a long time, resulting in the deterioration of potential responses. Long-term potential stability was examined after continuous measuring in freshly prepared 1 mM sulfite solution for 24 h. The potential drift was found to be 18.2 ± 0.3, and 21 ± 0.2 μV h−1 (n = 3) for C/MWCNTs/SO32−-ISE (sensor I) and C/PANI/SO32−-ISE (sensor II), respectively. The potential drift for C/SO32−-ISE (sensor III) was found to be 112 ± 0.2 μV h−1 (n = 3). From these results, the presence of solid-contact material produces an excellent long-term stability as compared to C/SO32−-ISE (sensor III). The short-term and long-term potential stabilities of the C/MWCNTs/SO32−-ISE (sensor I) and C/PANI/SO32−-ISE (sensor II) are greatly enhanced in the use of these solid-contact nanomaterials. This can be attributed to the interfacial capacitance of the solid-contact material.
The interfacial capacitances (C) (i.e. ΔE/Δt = I/C) were also evaluated and found to be 26.1 ± 1.2, 24.3 ± 0.7 and 5.7 ± 0.6 μF for sensors I, II and III, respectively. From all of these obtained results, it was noticed that the sulfite sensor based on MWCNTs has better enhanced potential stability and better interfacial capacitance than that sensor based on PANI as a solid-contact transducer. Un-modified sulfite electrode (sensor III) revealed low potential stability than sensors I and II, with solid contact materials inserted between SC and ISM. In sensor III, the electrical double layer can also form but the capacitance value is quite small due to the absence of effective ion-to-electron transduction. Therefore, this electrode is seen to be polarizable without the ability to buffer any random tiny charge noise.
3.4. Impedance measurements
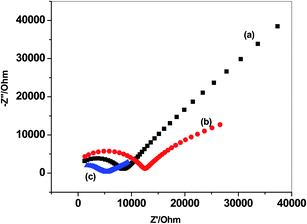
The impedance spectra of C/MWCNTs/SO32− ISE (sensor I), C/PANI/SO32− ISE (sensor II) and C/SO32− ISE (sensor III) were shown in Fig. 6. The bulk resistance (i.e. Membrane resistance and contact resistance at the interface between the ion-sensing membrane and the electronic support) is represented as the high-frequency semicircle in the impedance spectrum. The calculated values were 5.3, 12.4 and 8.7 kΩ for C/MWCNTs/SO32− ISE (sensor I), C/PANI/SO32− ISE (sensor II) and C/SO32− ISE (sensor III), respectively. This indicates that the C/MWCNTs/SO32− ISE (sensor I) has a low charge transfer resistance at the sensing membrane/MWCNTs interface. In addition, the low-frequency semicircle part of the of C/MWCNTs/SO32− ISE (sensor I) and C/PANI/SO32− ISE (sensor II) is relatively smaller than that of the C/SO32− ISE (sensor III). These demonstrated the presence of a low-charge transfer resistance as well as a high double-layer capacitance at the interface between the sensing membrane and MWCNTs layer.3.5. Effects of O2, CO2, and light
The effects of dissolved CO2 and O2 in addition to light on the potential-stability of both C/MWCNTs/SO32−-ISE and C/PANI/SO32−-ISE were evaluated. The potential responses of the presented electrodes were recorded in 1 mM SO32− solution under the condition of bubbling CO2 and N2, or O2 and N2 for 30 min. The effect of light is evaluated after introducing the presented sensors in 1 mM SO32− with the ambient light on/off. As presented in Fig. 7, there no observable potential drift can be found in the presence of CO2, O2 and light. This confirms the robustness of the presented sensors towards either CO2, O2 or light.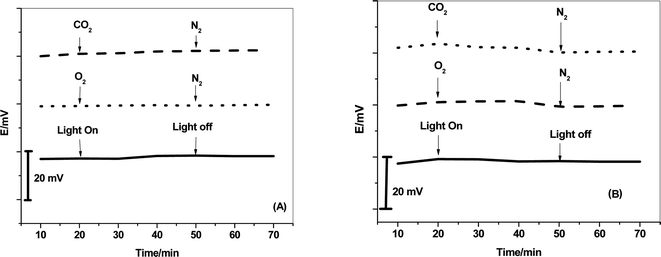 | ||
| Fig. 7 Effects of CO2, O2 and light on the potential stability of (A) C/MWCNTs/SO32−-ISE and (B) C/PANI/SO32−-ISE. | ||
3.6. Water-layer test
The effect of a water-layer between the sensing-membrane and the inserted solid-contact transducer on the potential stability of the presented sensors was carried out. The modified electrodes and C/SO32−-ISE were sequentially immersed in 1 mM SO32−, 0.1 M Na2SO4, and 1 mM SO32−. As shown in Fig. 8, compared with C/SO32−-ISE, the C/MWCNTs/SO32−-ISE and C/PANI/SO32−-ISE revealed a stable potential-response during the test. This demonstrates the absence of a water layer at interface between the sensing membrane and the solid contact transducer. This can be attributed to the resultant hydrophobic characteristic of both MWCNTs and PANI.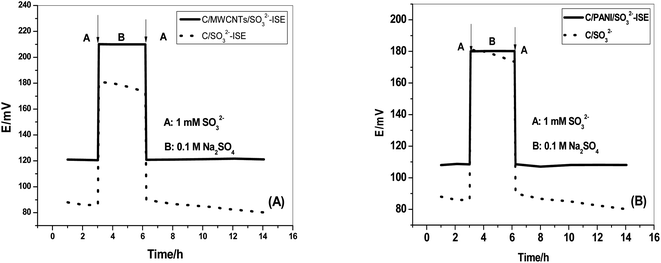 | ||
| Fig. 8 Water layer tests for (A) C/MWCNTs/SO32−-ISE and (B) C/PANI/SO32−-ISE. [C/SO32−-ISE (dotted line)]. | ||
3.7. Sulfite assessment in non-alcoholic beverages
The amount of sulfite present in different real non-alcoholic beverage samples collected from the local market was assessed using the validated presented method with sensor C/MWCNTs/SO32− ISE (sensor I). The obtained results were compared with the results of the standard iodometric method45 and summarized in Table 3. An F-test presented no remarkable difference at the 95% confidence level between means and variances of both the potentiometric and titrimetric sets of results. The calculated F values (n = 6) were found to be in the range of 1.42–5.23 compared with the tabulated value (6.39) at the 95% confidence level.| Sample | Sulfitea, μg mL−1 | F-Test | |
|---|---|---|---|
| Potentiometry | Iodometry,45 | ||
| a Average of six measurements. | |||
| Non-alcoholic malt beverage, (Birell, Alahram Beverage Co.), Egypt | 11.2 ± 1.3 | 13.4 ± 0.8 | 4.76 |
| Non-alcoholic malt beverage, (Fayrouz, Alahram Beverage Co.), Egypt | 19.1 ± 0.6 | 20.4 ± 1.1 | 1.42 |
| Non-alcoholic malt beverage, (AMSTEL Zero, Alahram Beverage Co.), Egypt | 7.8 ± 0.3 | 7.4 ± 1.5 | 3.55 |
| White sparkling apple juice (Appetites, Spain) | 290.3 ± 0.8 | 285.2 ± 2.3 | 5.23 |
| White sparkling grape drink (Carl Jung, Germany) | 266.3 ± 0.5 | 271.2 ± 2.3 | 2.34 |
4. Conclusions
Cost-effective, reliable and robust solid contact carbon screen-printed sulfite electrodes based on potentiometric transduction were developed, characterized and applied for sulfite detection in non-alcoholic beverages. The electrodes were based on the use of cobalt(II) phthalocyanine (Co-PC) as an ionophore and a selective recognition receptor for sulfite. The conductive substrate of the screen-printed electrodes was made from carbon and modified with multi-walled carbon nanotubes (MWCNTs) and polyaniline (PANI). These compounds were used as solid contact transducers between the ion-sensing membrane (ISM) and the solid contact (SC). The sensors were electrochemically characterized and revealed rapid Nernst responses across the concentration ranges from 2.0 × 10⁻⁶ to 2.3 × 10⁻³ M and 5.0 × 10⁻⁶ to 2.3 × 10⁻³ M with detection limits equal to 1.1 × 10⁻⁶ M and 1.5 × 10⁻⁶ M for sensors based on MWCNTs and PANI, respectively. They displayed fast response times (<5 s) in 10 mM PBS, pH 6. Reversed-current chronopotentiometry was used to calculate the short-term potential stability and interfacial capacitances of the proposed sensors.Author contributions
The listed authors contributed to this work as described in the following: H.·S. M. A.-R. and A. H. K. gave the concepts of the work, interpretation of the results, the experimental part and prepared the manuscript, A. H.·K., H.·S. M. A.-R. and A. E.-G. E. A. cooperated in the preparation of the manuscript and A. H. K. and H.·S. M. A.-R. performed the revision before submission. A. E.-G. E. A. revealed the financial support for the work. All authors have read and agreed to the published version of the manuscript.Conflicts of interest
The authors declare that there are no conflicts of interest. All authors have approved the manuscript and agree with the submission to your esteemed journal.Acknowledgements
The authors are grateful to the Deanship of Scientific Research, King Saud University for funding this work through Research Group Project “RGP-172”.References
- E. Chazelas, D. M. Mélanie, B. Srour, E. Kesse-Guyot, C. Julia, B. Alles, N. Druesne-Pecollo, P. Galan, S. Hercberg, P. Latino-Martel, Y. Esseddik, F. Szabo, P. Slamich, S. Gigandet and M. Touvier, Sci. Rep., 2020, 10, 3980 CrossRef CAS.
- A. R. Garcia-Fuentes, S. Wirtz, E. Ellen Vos and H. Verhagen, Eur. J. Food Res. Rev., 2015, 5, 113 Search PubMed.
- R. Walker, Food Addit. Contam., 1985, 2, 5 CrossRef CAS.
- V. J. Smith, Anal. Chem., 1987, 59, 2256 CrossRef CAS.
- K. Lien, D. P. H. Hsieh, H. Huang, C. Wu, S. Ni and M. Ling, Toxicol. Rep., 2016, 3, 544 CrossRef CAS.
- L. Yongjie, Y. Li and M. Zhao, Food Control, 2006, 17, 975 CrossRef.
- Y. Ma, X. Fu, W. He and X. Gao, J. Mater. Sci. Eng., 2020, 729, 012090 CAS.
- S. S. M. Hassan, M. S. Hamza and A. H. K. Mohamed, Anal. Chim. Acta, 2006, 570, 232 CrossRef CAS.
- C. Loganathan, E. Narayanamoorthi and S. Abraham John, Food Chem., 2020, 309, 125751 CrossRef CAS.
- X. Yang, X. Guo and Y. Zhao, Anal. Chim. Acta, 2002, 456, 121 CrossRef CAS.
- S. Fujii, T. Tokuyama, M. Abo and A. Okuba, Anal. Sci., 2004, 20, 209 CrossRef CAS.
- M. Yamada, M. Nakada and S. Suzuki, Anal. Chim. Acta, 1983, 147, 401 CrossRef CAS.
- Y. L. Huang, J. M. Kim and R. D. Schmid, Anal. Chim. Acta, 1992, 266, 317 CrossRef CAS.
- W. Qin, Z. Zhang and C. Zhang, Anal. Chim. Acta, 1998, 361, 201 CrossRef CAS.
- D. Papkovsky, M. A. Uskova, G. V. Ponomarve, T. Korpela, S. Kulmale and G. G. Guilbault, Anal. Chim. Acta, 1998, 374, 1 CrossRef CAS.
- K. Yoshikawa, Y. Uekusa and A. Sakuragawa, Food Chem., 2015, 174, 387 CrossRef CAS.
- A. Aberi and M. Coelhan, Food Addit. Contam., Part A, 2013, 30, 226 CrossRef.
- D. Urupina, V. Gaudion, M. N. Romanias, M. Verriele and F. Thevenet, Talanta, 2020, 219, 121318 CrossRef CAS.
- K. S. Carlos, S. M. Conrad, S. M. Handy and L. S. de Jager, Food Addit. Contam., Part A, 2020, 37, 723 CrossRef CAS.
- S. Gonçalves, V. R. Alves, S. O. Pérez, M. Ferreira, H. Daguer, M. A. L. de Oliveira, G. A. Micke and L. Vitali, Food Chem., 2020, 321, 126705 CrossRef.
- S. Islas-Valdez, S. López-Rayo, H. Hristov-Emilov, L. Hernández-ApaolazaJuan and J. J. Lucena, Int. J. Biol. Macromol., 2020, 142, 163 CrossRef CAS.
- R. Rawal, S. Chawla and C. S. Pundir, Biosens. Bioelectron., 2012, 31, 144 CrossRef CAS.
- A. S. S. N. M. Teixeira, P. R. S. Teixeira, E. A. O. Farias, B. F. Sousa, K. B. L. M. Sérvulo, D. A. da Silva and C. Eiras, J. Solid State Electrochem., 2020, 24, 1143 CrossRef.
- B. Molinero-Abad, M. A. Alonso-Lomillo, O. Domínguez-Renedo and M. J. Arcos-Martínez, Anal. Chim. Acta, 2014, 812, 41 CrossRef CAS.
- A. H. Kamel and A. M. E. Hassan, Int. J. Electrochem. Sci., 2016, 11, 8938 CrossRef CAS.
- E. H. El-Naby and A. H. Kamel, Mater. Sci. Eng., C, 2015, 54, 217 CrossRef CAS.
- A. El-Kosasy, A. H. Kamel, L. Hussin, M. F. Ayad and N. Fares, Food Chem., 2018, 250, 188 CrossRef CAS.
- A. H. Kamel, X. Jiang, P. Li and R. Liang, Anal. Methods, 2018, 10, 3890 RSC.
- A. H. Kamel, T. Y. Soror and F. M. Al-Romian, Anal. Methods, 2012, 4, 3007 RSC.
- S. S. M. Hassan, I. H. A. Badr, A. H. Kamel and M. S. Mohamed, Anal. Sci., 2009, 25, 911 CrossRef CAS.
- I. H. A. Badr, M. E. Meyerho and S. S. M. Hassan, Anal. Chim. Acta, 1995, 310, 211 CrossRef CAS.
- R. S. Hutchins, P. Molina, M. Alajarín, A. Vidal and L. G. Bachas, Anal. Chem., 1994, 66, 3188 CrossRef CAS.
- S. S. M. Hassan, S. A. Marei, I. H. Badr and H. A. Arida, Talanta, 2001, 54, 773 CrossRef CAS.
- N. S. Abdalla, M. A. Youssef, H. Algarni, N. S. Awwad and A. H. Kamel, Molecules, 2019, 24, 712 CrossRef CAS.
- A. Galal Eldin, A. E. Amr, A. H. Kamel and S. S. M. Hassan, Molecules, 2019, 24, 1392 CrossRef.
- S. A. Ezzat, M. Ahmed, E. A. Amr, M. A. Al-Omar, A. H. Kamel and N. M. Khalifa, Materials, 2019, 12, 2924 CrossRef CAS.
- M. Cuartero and G. A. Crespo, Curr. Opin. Electrochem., 2018, 10, 98 CrossRef CAS.
- E. Lindner and R. J. Gyurcsányi, J. Solid State Electrochem, 2009, 13, 51 CrossRef CAS.
- L. Chen, B. De Borba and J. Rohrer, Thermo Fisher Scientific, Sunnyvale, CA, USA, AN70379-EN 08/16S, 2016 Search PubMed.
- E. Bakker, J. Electrochem. Soc., 1996, 143, L83 CrossRef CAS.
- S. S. M. Hassan, S. A. M. Marzouk, A. H. K. Mohamed and N. M. Badawy, Electroanalysis, 2004, 16, 298 CrossRef CAS.
- S. S. M. Hassan, A. H. Kamel, A. E. Amr, H. S. M. Abd-Rabboh, M. A. Al-Omar and E. A. Elsayed, Molecules, 2020, 25, 3076 CrossRef CAS.
- Y. Shao, Y. Ying and J. Ping, Chem. Soc. Rev., 2020, 49, 4405 RSC.
- J. Bobacka, Anal. Chem., 1999, 71, 4932 CrossRef CAS.
- R. B. Baird, A. D. Eaton and E. W. Rice, Standard Methods for the Examination of Waters and Wastewaters, American Public Health Association, Baltimore, Maryland, 23th edn, 2017 Search PubMed.
| This journal is © The Royal Society of Chemistry 2021 |


