 Open Access Article
NH4V4O10 nanobelts vertically grown on 3D TiN nanotube arrays as high-performance electrode materials of supercapacitors
Yihan Lin,
Jianyu Li,
Peng Ren and
Xiuchun Yang
 *
*
School of Materials Science and Engineering, Tongji University, Shanghai, 201804, China. E-mail: yangxc@tongji.edu.cn
First published on 24th February 2021
Abstract
High performance supercapacitor without binders has attracted wide attention as an energy storage device. In this work, novel NH4V4O10 nanobelts were successfully synthesized and decorated into TiN nanotube arrays by a simple hydrothermal method. The as-prepared no-binder electrode hybrids exhibited excellent electrochemical performances with a specific capacitance of 749.0 F g−1 at 5 mV s−1 and a capacity retention of 85.7% after 200 cycles, which makes it an appealing candidate for electrode materials of supercapacitors.
1. Introduction
An urgent need to address energy shortage problems is caused by the contradiction between the increasing demand of human society for energy and the decreasing storage of non-renewable fossil resources. Thus, the research on the storage and application of sustainable energy has become a hot topic recently. Among numerous energy storage devices, supercapacitors (SCs) have captured significant attention because of their high power density, ultra-rapid charge–discharge rate, long cycle life, great stability and low maintenance cost.1–4Traditional electrodes like carbon electrodes have a lot of disadvantages including poor cycle stability and low charge efficiency.5 Thus, it is essential to develop innovative electrodes for advanced supercapacitors. The highly ordered nanostructured materials (such as nanotube, nanopore, and nanofiber) can provide a definite architecture with ordered alignment to improve electrochemical performance. In recent years, many researchers have carried out extensive research on TiN nanotube arrays as electrode material for supercapacitors. Wang et al. developed a simple template-free method of preparing mesoporous TiN nanostructures directly on Ti foils. The TiN nanosheets had a capacitance of 81.63 F g−1 at the current density of 0.5 A g−1. Additionally, it showed great cycle stability. The capacitance retention is still 100% after 2500 cycles.6 Xie et al. prepared TiN nanoarrays by a nitridation process of titania in an ammonia atmosphere. The specific capacitance of TiN nanopore array reached an extraordinarily high level up to 99.7 mF cm−2.7
Among various electrode materials, vanadium layered oxides have received much attention due to the various oxidation states of vanadium(V) and the multiple kinds of coordination polyhedral.8–10 Layered ammonium vanadium oxides have larger layer spacing than V2O5, which can enable the insertion/extraction of guest ions without significant damage to the host structure.11–13 The research on NH4V4O10 to date has been focused on the electrochemistry performance in monovalent-ion batteries.14–19 For examples, Zhang et al. synthesized NH4V4O10 nanobelts as a cathode material of Li-ion battery with the first discharge capacity of 171.8 mA h g−1.17 Huang et al. synthesized (NH4)0.5V2O5 nanobelts as a cathode material of Li-ion battery with an initial specific discharge capacity of 225.2 mA h g−1 and a capacity retention rate of 79.9% after 40 cycles.18 Chen et al. prepared NH4V4O10 micro-flowers as cathode for MLIBs with a specific discharge capacity of 228 mA h g−1 at 100 mA g−1.19 According to our best knowledge, however, NH4V4O10 hasn't been reported as electrode materials of supercapacitors due to its poor conductivity.
In this work, lawn-like NH4V4O10 was decorated into 3D TiN nanotube arrays as electrode materials of supercapacitors, which combined the high specific capacitance of NH4V4O10 and excellent electrical conductivity, chemical stability and special surface area of TiN NTAs. The composition and morphology are measured by using XRD, SEM and EDS. The electrochemical performances of all samples in a electrolyte containing K+ are measured and discussed.
2. Experimental section
2.1 Preparation of NH4V4O10/TiN nanotube arrays
2.2 Material characterization
X-ray diffraction (XRD) patterns were recorded by using a Rigaku D/Max 2550VB3+/PC X-ray diffractometer with Cu Kα radiation (λ = 0.15406 nm). X-ray photoelectron spectroscopy (XPS) data were obtained from a Kratos AXIS ULTRA electron spectrometer with Mg Kα X (hν = 1486.6 eV, 900 mm of beam spot) as the incident radiation source, and the detected binding energy was calibrated by carbon (C 1s = 284.6 eV). Morphological and lattice structural information was obtained from field emission scanning electron microscopy (FESEM, Nova Nano SEM 450) and high-resolution transmission electron microscopy (TEM, JEOL 2010F).2.3 Electrochemical characterization
Electrochemical measurement was carried out with CHI660E electrochemical three-electrode system in 2 M KCl solution, where the samples acted as the working electrode, Pt foil acted as the counter electrode, and Ag/AgCl electrode acted as the reference electrode. Cyclic voltammetry (CV) curves were recorded in a voltage range from 0.2 V to 0.8 V at different scan rates of 5, 10, 20, 40, 60, 80 and 100 mV s−1, respectively. Galvanostatic charge/discharge curves were recorded in a potential window from −0.2 to 0.8 V at a series of current densities. The electrochemical impedance spectroscopy (EIS) was conducted in the frequency from 100 kHz to 10 mHz at an open-circuit potential of 5 mV.3. Results
Fig. 1 gives XRD patterns of TiN, NVO, TNV-8, TNV-12 and TNV-16. All diffraction peaks from NVO are well indexed to monoclinic NH4V4O10 (JCPDS no. 31-0075).13,15 The crystal structure of NH4V4O10 shown in Fig. 1b is an assembly of double layers made up of distorted octahedra and trigonal bipyramids of V–O polyhedral stacking along the c-axis of the unit cell and encapsulating ammonium ions. The strong (001) peak located at 8.6° indicates a larger interlayer spacing (10.4 Å) of the as-synthesized NVO than that of NH4V4O10 crystal (9.6 Å), which benefits ion diffusion and structural stabilization for enduring prolonged electrochemical cycles. There are no other diffraction peaks in NVO, indicating that a pure single-phase NH4V4O10 is obtained. The peaks in the XRD patterns of TNV-8, TNV-12 and TNV-16 are associated with NH4V4O10 besides the diffraction peaks of Ti and TiN.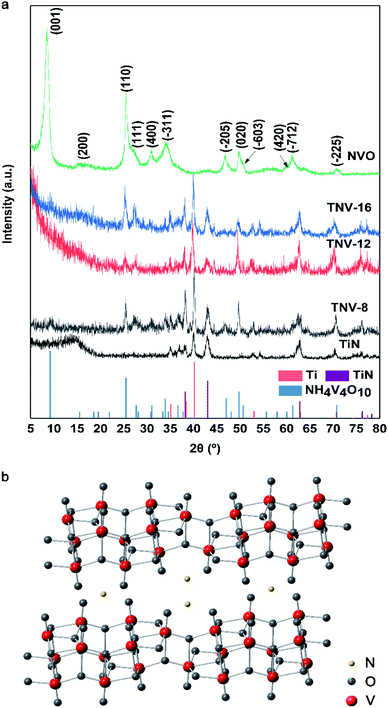 | ||
| Fig. 1 (a) XRD patterns of different samples and (b) crystal structure of NH4V4O10 (TNV-8, TNV-12 and TNV-16). | ||
Fig. 2 gives XPS spectra of TNV-12 to further confirm the formation of NH4V4O10. It reveals that TNV-12 consists of elements V, O, N and C. The binding energy (BE) of C 1s is 284.8 eV, which is the standard binding energy for calibration instrument. V 2p high-resolution spectrum illustrates the mixed valance state of V shown in Fig. 2b. The peaks at 517.3 and 524.75 eV are corresponding to the 2p3/2 and 2p1/2 of V5+. The peaks at 516.2 eV and 523.2 eV are corresponding to the 2p3/2 and 2p1/2 of V4+, respectively. The BEs at 529.95 eV and 531.3 eV in Fig. 2c are associated with O–V5+ and O–V4+, respectively,25,26 further demonstrating the mixed valance state of V in NH4V4O10. Fig. 2d displays single N 1s core level spectrum, further indicating the presence of NH4+.27
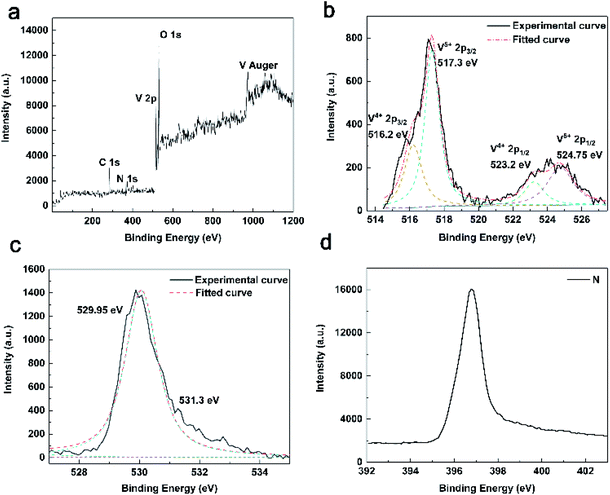 | ||
| Fig. 2 (a) XPS survey spectrum of TNV-12 and high resolution XPS spectra of V 2p (b), O 1s (c) and N 1s (d). | ||
Fig. 3 shows TEM images of NVO sample, indicating that the NH4V4O10 has a belt-like structure with a width of about 100 nm. The lattice spacing of 0.577 nm in Fig. 3b originates from (111) lattice plane of NH4V4O10. Fast Fourier transform analysis shown in Fig. 3c further reveals that NVO has a monoclinic NH4V4O10 crystal structure.
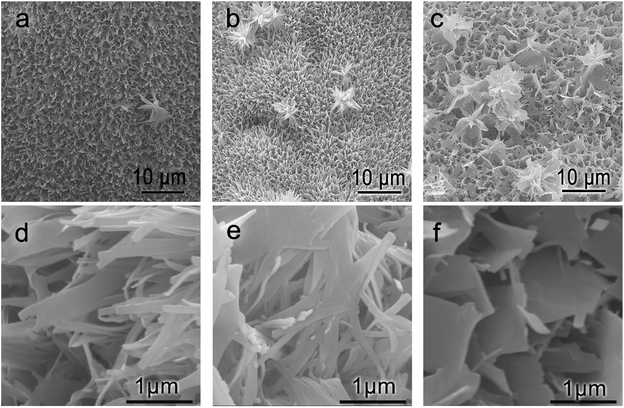
Fig. 4 shows the SEM images of TNV-8, TNV-12 and TNV-16. It can be clearly observed that the morphology of NH4V4O10 changes from nanobelts to nanosheets with the increase of the hydrothermal reaction time as shown in Fig. 4d–f. They vertically grew on the surface of the TiN nanotube array.
The hydrothermal reaction for the formation of NH4V4O10 is as follows:
| 8NH4VO3 + H2C2O4·2H2O → 2NH4V4O10 + 6NH3 + 6H2O + 2CO2 | (1) |
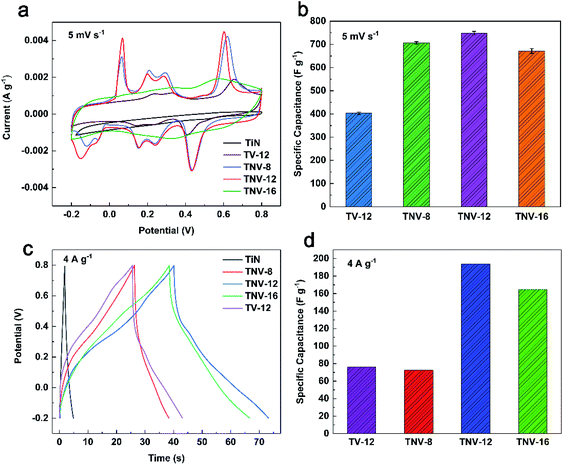
The CV curves of all samples except TiN display four pairs of asymmetric redox peaks and the details are shown in Fig. 5a. Fig. 5b indicates that TNV-12 has the highest specific capacitance of 749.0 F g−1 at 5 mV s−1, which is 85.9% higher than that of TV-12. Fig. 5c and d display the galvanostatic charge–discharge (GCD) curves and the corresponding specific capacitance of TiN, TV-12, TNV-8, TNV-12 and TNV-16 samples at a current density of 4 A g−1. All GCD curves exhibit the near triangle shapes, presenting a reversible and fast ion doping/dedoping property. TNV-12 shows the highest specific capacitance of 197.4 F g−1 at 4 A g−1, which is nearly three times that of TV-12. Moreover, the redox peaks of TNV-12 are more obvious than those of TV-12. All results indicate that TiN NTAs can not only provide high speed path for electrons, but also dramatically enlarge the specific surface area of electrode for contacting with electrolyte, which can markedly shorten transport distances of electrolytic ions. This excellent electrical conductivity of TiN is also confirmed by the results of electrochemical impedance spectroscopy (EIS) shown in Fig. 8a.
Fig. 6a displays the CV curves of TNV-12 at a series of scan rates from 5 to 100 mV s−1. The curves have similar shapes and peaks, and the currents gradually increase with increasing scan rates. As shown in Fig. 6b, the specific capacitance shares the opposite changing trend against the scan rates. TNV-12 exhibits the highest specific capacitance among these samples at the given scan rate, especially 749.0 F g−1 at 5 mV s−1 and 389.4 F g−1 at 100 mV s−1, indicating that TNV-12 possesses high rate performance.
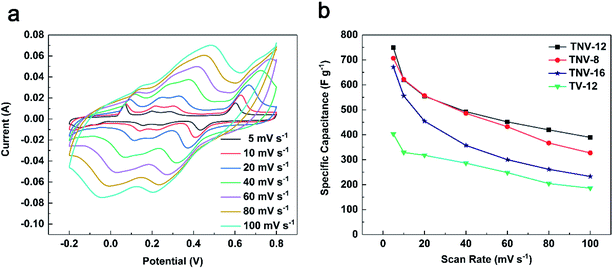 | ||
| Fig. 6 (a) Cyclic voltammetry curves of TNV-12 at different scan rates; (b) specific capacitance of TV-12, TNV-8, TNV-12 and TNV-16 at different scan rates. | ||
Fig. 7 gives the detailed CV and GCD curves of TNV-12 at 5 mV s−1 and 2 A g−1, respectively. It can be clearly observed that there are four cathodic peaks located at −0.154, 0.155, 0.241 and 0.434 V, and these four peaks correspond to the γ/ω, δ/γ, ε/δ, α/ε phase transitions within the potential range from 0.2 V to 0.8 V (vs. Ag+/Ag). The four anodic peaks at 0.067, 0.198, 0.288 and 0.603 V can be ascribed to the reverse phase transitions of ω/γ, γ/δ, δ/ε and ε/α.28–30 The redox peaks of NH4V4O10 electrode material in KCl can be ascribed to the intercalation/deintercalation of K+ ions into/from NH4V4O10 lattice. In Fig. 7b, there are several peaks located at 0.18, 0.57, 0.43 and 0.15 V, which are similar to the potential of γ/δ, ε/α, α/ε and δ/γ phase transitions in Fig. 6a, respectively. Ion-intercalated electrode materials normally involve the phase transitions. During charge/discharge process, chemical reactions occur at distinct potential where one phase is converted to another. Thus the peaks on GCD curves are associated with reversible phase transitions under particular voltage.16 These phenomena indicate the apparent pseudocapacitance characteristics of TNV-12.
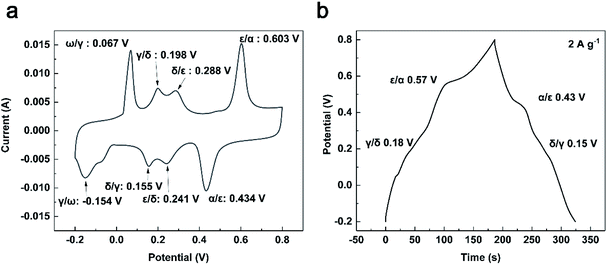 | ||
| Fig. 7 (a) Cyclic voltammetry curve of TNV-12 at 5 mV s−1; (b) charging–discharge curve of TNV-12 at 2 A g−1. | ||
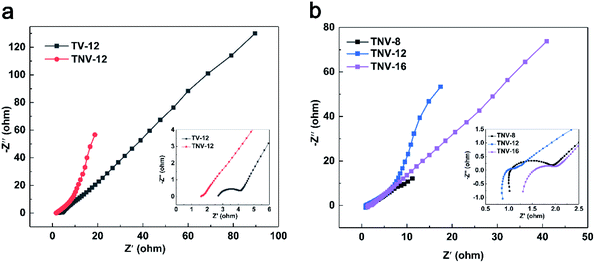
Fig. 8 gives the Nyquist plot of TV-12, TNV-8, TNV-12 and TNV-16 measured in the frequency range from 100 kHz to 0.1 Hz. The Nyquist plot is divided into two parts: an arc at higher frequency region and a slash at lower frequency region. In Fig. 8a, TNV-12 electrode yields a smaller semicircle in the high-frequency region and a greater slope in the low-frequency region than TV-12 electrode, indicating a lower charge transfer impedance and a superior ion diffusion due to its enlarged specific surface area. In Fig. 8b, the intercept at real part (Z′) represents a combination (Re) of the ionic resistance of the electrolyte. The intrinsic resistance of the substrate and the contact resistance between the active material and the current collector interface indicate that TNV-8, TNV-12 and TNV-16 have the similar Re values. The semicircle in the high-frequency range corresponds to the charge-transfer resistance (Rct) caused by the faradaic reactions. The slope of the curve called the Warburg resistance (Zω) is a result of the frequency dependence of ion diffusion/transport in the electrolyte to the electrode surface. According to the simulation circuit shown in Fig. 9a, the calculated Re and Rct are 1.31 Ω and 269.3 Ω for TNV-8, 1.69 Ω and 864.3 Ω for TNV-12, and 1.87 Ω and 528.8 Ω for TNV-16, respectively. Therefore TNV-12 has the lowest Re, Rct and Zω among the three samples.
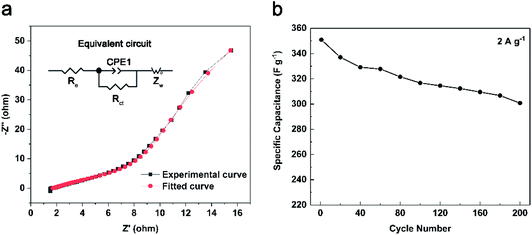 | ||
| Fig. 9 (a) Nyquist plot and fitting curve of TNV-12, the inset is equivalent circuit; (b) the relation between specific capacitance of TNV-12 and cycle-index at 2 A g−1. | ||
Fig. 9b shows the cycling stability of the TNV-12 composite electrode material at a current density of 2 A g−1 for 200 cycles. After 200 cycles, the specific capacitance of TNV-12 decreased from 350.9 to 300.7 F g−1 with a retention rate of 85.7%. At the same time, the mass of TNV-12 dropped by 53% because soluble ions in aqueous solution such as H2VO4− and HVO42− were delivered from NH4V4O10 during the continuous Galvanostatic charge/discharge process.
As shown in Table 1, we compare the material in this paper with other materials with similar characteristics.
| Electrode | Capacitance | Cycle stability | Ref. |
|---|---|---|---|
| NH4V4O10 nanobelts on TiN nanotube arrays | 749.0 F g−1 at the scan rate of 5 mV s−1 and 197.4 F g−1 at the current density of 4 A g−1 | The capacitance retention is 85.7% after 200 cycles | This work |
| TiN nanosheet arrays on Ti foils | 81.63 F g−1 at the current density of 0.5 A g−1 | The capacitance retention is 75% after 4000 cycles | 6 |
| TiN/VN composites with core/shell structure | 170 F g−1 at 2 mV s−1 | The capacitance retention is 89% after 500 cycles | 31 |
| β-Na0.33V2O5 nanobelt | 320 F g−1 at 5 mV s−1 | The capacitance retention is 66% after 4000 cycles | 32 |
| TiN-VN core–shell structure | 247.5 F g−1 at 2 mV s−1 | The capacitance retention is 88% after 500 cycles | 33 |
| 3D MnO2/TiN NTAs on Ti mesh | 550 F g−1 at the scan rate of 5 mV s−1 | The capacitance retention is 83.77% after 600 cycles | 20 |
As we can see from the table, compared with materials with similar characteristics, our material has higher specific capacitance. In the meanwhile, it also shows good cycle stability.
4. Conclusions
Novel NH4V4O10 nanobelts were successfully synthesized and decorated into TiN nanotube arrays by a simple hydrothermal method. The as-prepared NH4V4O10 has layered structure with a large interlayer spacing of 5.7 Å and nanobelt morphology. The composite electrode material presents specific capacities of 749.0 F g−1 at the scan rate of 5 mV s−1 and 197.4 F g−1 at the current density of 4 A g−1. It exhibits good cycling stability with a retaining rate of 85.7% at 2 A g−1 after 200 cycles. According to the results of our research, NH4V4O10/TiN NTAs composite is a promising electrode material for SCs.Conflicts of interest
There are no conflicts to declare.Acknowledgements
The authors wish to thank Tongji University, China, for providing experiments conducted with XRD, XPS, TEM and SEM instruments.Notes and references
- Z. Wu, L. Li, J. M. Yan and X. B. Zhang, Adv. Sci., 2017, 4, 1600382 CrossRef.
- Q. Zhang, E. Uchaker, S. L. Candelaria and G. Cao, Chem. Soc. Rev., 2013, 42, 3127 RSC.
- G. Yu, X. Xie, L. Pan, Z. Bao and Y. Cui, Nano Energy, 2013, 2, 213 CrossRef CAS.
- C. Zhang, W. Lv, Y. Tao and Q. H. Yang, Energy Environ. Sci., 2015, 8(5), 1390 RSC.
- C. Li, S. Wang, G. Wang, S. Wang, X. Che, D. Li and J. Qiu, Environ. Sci.: Water Res. Technol., 2020, 6, 303–311 RSC.
- C. Wang, P. Zhou, Z. Wang, Y. Liu, P. Wang, X. Qin, X. Zhang, Y. Dai, M.-H. Whangbo and B. Huang, RSC Adv., 2018, 8, 12841–12847 RSC.
- Y. Xie, Y. Wang and H. Du, Mater. Sci. Eng., B, 2013, 178, 1443–1451 CrossRef CAS.
- Q. T. Qu, Y. Shi, L. L. Li, W. L. Guo, Y. P. Wu, H. P. Zhang, S. Y. Guan and R. Holze, Electrochem. Commun., 2009, 11, 1325 CrossRef CAS.
- K. Guo, Y. Li, C. Li, N. Yu and H. Li, Sci. China Mater., 2019, 62, 936 CrossRef CAS.
- J. S. Bonso, A. Rahy, S. D. Perera, N. Nour, O. Seitz, Y. J. Chabal, K. J. Balkus, J. P. Ferraris and D. J. Yang, J. Power Sources, 2012, 203, 227 CrossRef CAS.
- M. Schindler, F. C. Hawthorne and W. H. Baur, Chem. Mater., 2000, 12, 1248 CrossRef CAS.
- P. Y. Zavalij and M. S. Whittingham, Acta Crystallogr., Sect. B: Struct. Sci., 2010, 55, 627 CrossRef.
- S. Dong, W. Shin, H. Jiang, X. Wu, Z. Li, J. Holoubek, W. F. Stickle, B. Key, C. Liu, J. Lu, P. A. Greaney, X. Zhang and X. Ji, Chem, 2019, 5(6), 1537 CAS.
- Y. Xu, H. Dong, M. Zhou, C. Zhang, Y. Wu, W. Li, Y. Dong and Y. Lei, Small Methods, 2019, 3, 1800349 CrossRef.
- S. Sarkar, P. S. Veluri and S. Mitra, Electrochim. Acta, 2014, 132, 448 CrossRef CAS.
- A. Sarkar, S. Sarkar, T. Sarkar, P. Kumar, M. D. Bharadwaj and S. Mitra, ACS Appl. Mater. Interfaces, 2015, 7, 17044 CrossRef CAS.
- K. F. Zhang, G. Q. Zhang and X. Liu, J. Power Sources, 2006, 157, 528 CrossRef CAS.
- H. Wang, K. Huang, C. Huang, S. Liu, Y. Ren and X. Huang, J. Power Sources, 2011, 196, 5645 CrossRef CAS.
- D. Fang, Y. Cao, R. Liu, W. Xu, S. Liu, Z. Luo, C. Liang, X. Liu and C. Xiong, Appl. Surf. Sci., 2016, 360, 658 CrossRef CAS.
- C. Chen and X. Yang, RSC Adv., 2017, 7(89), 56440 RSC.
- P. Ren and X. Yang, Sol. RRL, 2018, 2, 1700233 CrossRef.
- C. Chen and X. Yang, RSC Adv., 2016, 6, 70978 RSC.
- Q. Y. Wang, L. N. Chi, M. M. Cui and X. Yang, Electrochim. Acta, 2013, 91, 330 CrossRef CAS.
- Q. Y. Wang, D. Liu, L. N. Chi, J. W. Hou and X. Yang, Electrochim. Acta, 2012, 83, 140 CrossRef CAS.
- R. J. Colton, A. M. Guzman and J. W. Rabalais, J. Appl. Phys., 1978, 49, 409 CrossRef CAS.
- E. E. Khawaja, M. A. Salim, M. A. Khan, F. F. Al-Adel, G. D. Khattak and Z. Hussain, J. Non-Cryst. Solids, 1989, 110, 33 CrossRef CAS.
- F. P. Larkins and A. Lubenfeld, J. Electron Spectrosc. Relat. Phenom., 1979, 15, 137–144 CrossRef CAS.
- C. Delmas, S. Brethes and M. Menetrier, J. Power Sources, 1991, 34(2), 113 CrossRef CAS.
- Y. Liu, M. Clark, Q. Zhang, D. Yu, D. Liu, J. Liu and G. Cao, Adv. Energy Mater., 2011, 1, 194 CrossRef CAS.
- C. Leger, S. Bach, P. Soudan and J. P. Pereira-Ramos, J. Electrochem. Soc., 2005, 152(1), A236 CrossRef CAS.
- S. Dong, X. Chen, L. Gu, X. Zhou, H. Wang, Z. Liu, P. Han, J. Yao, L. Wang, G. Cui and L. Chen, Mater. Res. Bull., 2011, 46, 835–839 CrossRef CAS.
- E. Khoo, J. Wang, J. Ma and P. S. Lee, J. Mater. Chem., 2010, 20, 8368–8374 RSC.
- X. Zhou, C. Shang, L. Gu, S. Dong, X. Chen, P. Han, L. Li, J. Yao, Z. Liu, H. Xu, Y. Zhu and G. Cui, ACS Appl. Mater. Interfaces, 2011, 3, 3058–3063 CrossRef CAS.
| This journal is © The Royal Society of Chemistry 2021 |


