DOI:
10.1039/D0RA09720A
(Paper)
RSC Adv., 2021,
11, 6292-6303
Solubility and biological activity enhancement of docetaxel via formation of inclusion complexes with three alkylenediamine-modified β-cyclodextrins
Received
16th November 2020
, Accepted 28th January 2021
First published on 3rd February 2021
Abstract
Docetaxel (DTX) is an effective and commonly used chemotherapeutic drug for cancer. However, its efficacy is greatly compromised because of its toxicity and poor water solubility. In order to overcome these disadvantages, three inclusion complexes between DTX and alkylenediamine-modified β-cyclodextrins (H1–3) with ethylene, propylene and butylene segments were prepared and characterized. The phase solubility studies demonstrated that the stoichiometry of the inclusion complexes between H1–3 and DTX were 1![[thin space (1/6-em)]](https://www.rsc.org/images/entities/char_2009.gif) :1. The binding abilities of host H1–3 towards DTX decrease in the following order: H3 > H2 > H1, which had good consistency with the decreasing alkylene lengths of these hosts. The water solubility of DTX is remarkably increased 216, 242 and 253 times after forming inclusion complexes with H1–3, respectively. In vitro release studies of DTX from H1–3/DTX into NaAc–HAc buffer solution (pH 5.0) or PBS (pH 7.4) exhibited a preliminary stage burst effect and followed by a slow drug release. The cytotoxicity studies revealed that the H1–3/DTX inclusion complexes exhibited better cytotoxicity profiles against MCF-7, SW480 and A-549 cells than that of DTX. Furthermore, compared with the treatment of DTX, the H1/DTX inclusion complex significantly increased the cell apoptosis percentage from 17.2% to 30.2% (5 μg mL−1), 19.0% to 31.0% (10 μg mL−1), and 19.3% to 32.2% (15 μg mL−1), respectively. These results will provide useful information for H1–3/DTX inclusion complexes as safe and efficient anticancer drug formulations.
:1. The binding abilities of host H1–3 towards DTX decrease in the following order: H3 > H2 > H1, which had good consistency with the decreasing alkylene lengths of these hosts. The water solubility of DTX is remarkably increased 216, 242 and 253 times after forming inclusion complexes with H1–3, respectively. In vitro release studies of DTX from H1–3/DTX into NaAc–HAc buffer solution (pH 5.0) or PBS (pH 7.4) exhibited a preliminary stage burst effect and followed by a slow drug release. The cytotoxicity studies revealed that the H1–3/DTX inclusion complexes exhibited better cytotoxicity profiles against MCF-7, SW480 and A-549 cells than that of DTX. Furthermore, compared with the treatment of DTX, the H1/DTX inclusion complex significantly increased the cell apoptosis percentage from 17.2% to 30.2% (5 μg mL−1), 19.0% to 31.0% (10 μg mL−1), and 19.3% to 32.2% (15 μg mL−1), respectively. These results will provide useful information for H1–3/DTX inclusion complexes as safe and efficient anticancer drug formulations.
1 Introduction
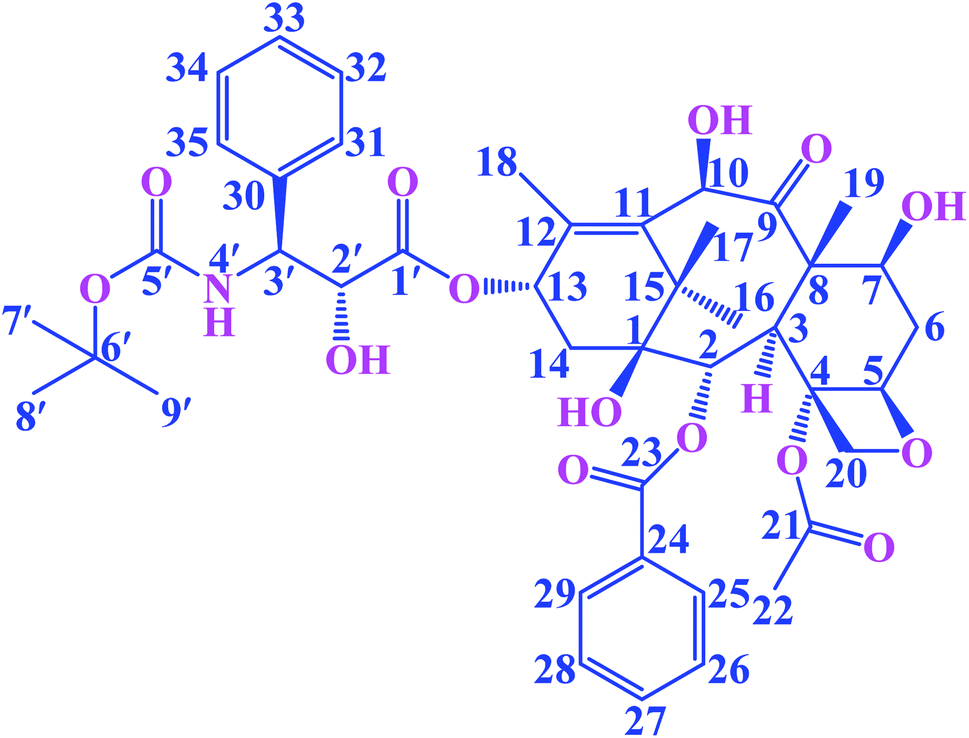
Paclitaxel is an antitumor diterpenoid, and it is approved by the US Food and Drug Administration (FDA) for the treatment of breast cancers, ovarian cancers and a variety of other tumors.1,2 It is a valuable plant-derived drug, but supply was limited due to the poor extraction yields caused by low accumulation levels in plants.3 Docetaxel (DTX, Fig. 1) is a semisynthetic taxoid, analogue of paclitaxel, and it is one of the most effective drugs in chemotherapy. Furthermore, DTX exhibits a better affinity to tubulin and higher antitumor bioactivity compared to paclitaxel.4 In recent years, it has been extensively applied for treating various tumors, such as gastric cancer, ovarian cancer, breast cancer, prostate cancer and non-small cell lung cancer.4–8 The mechanism of action of DTX involves the stabilization of the microtubule structure by promoting the polymerization of microtubule and inhibit depolymerization, thereby impeding the mitosis of tumor cells and eventually causes apoptosis.7,9 Although DTX has favorable antineoplastic activities, the clinical application has been limited due to its poor water solubility and toxicity.10,11 Tween-80 has been used to enhance DTX's solubility, however it can cause adverse hypersensitivity reactions, febrile neutropenia and dose-limiting toxicities.12,13 In order to reduce the adverse reactions and increase the solubility of the DTX, a new strategy is needed.
 |
| | Fig. 1 The chemical structure of guest DTX. | |
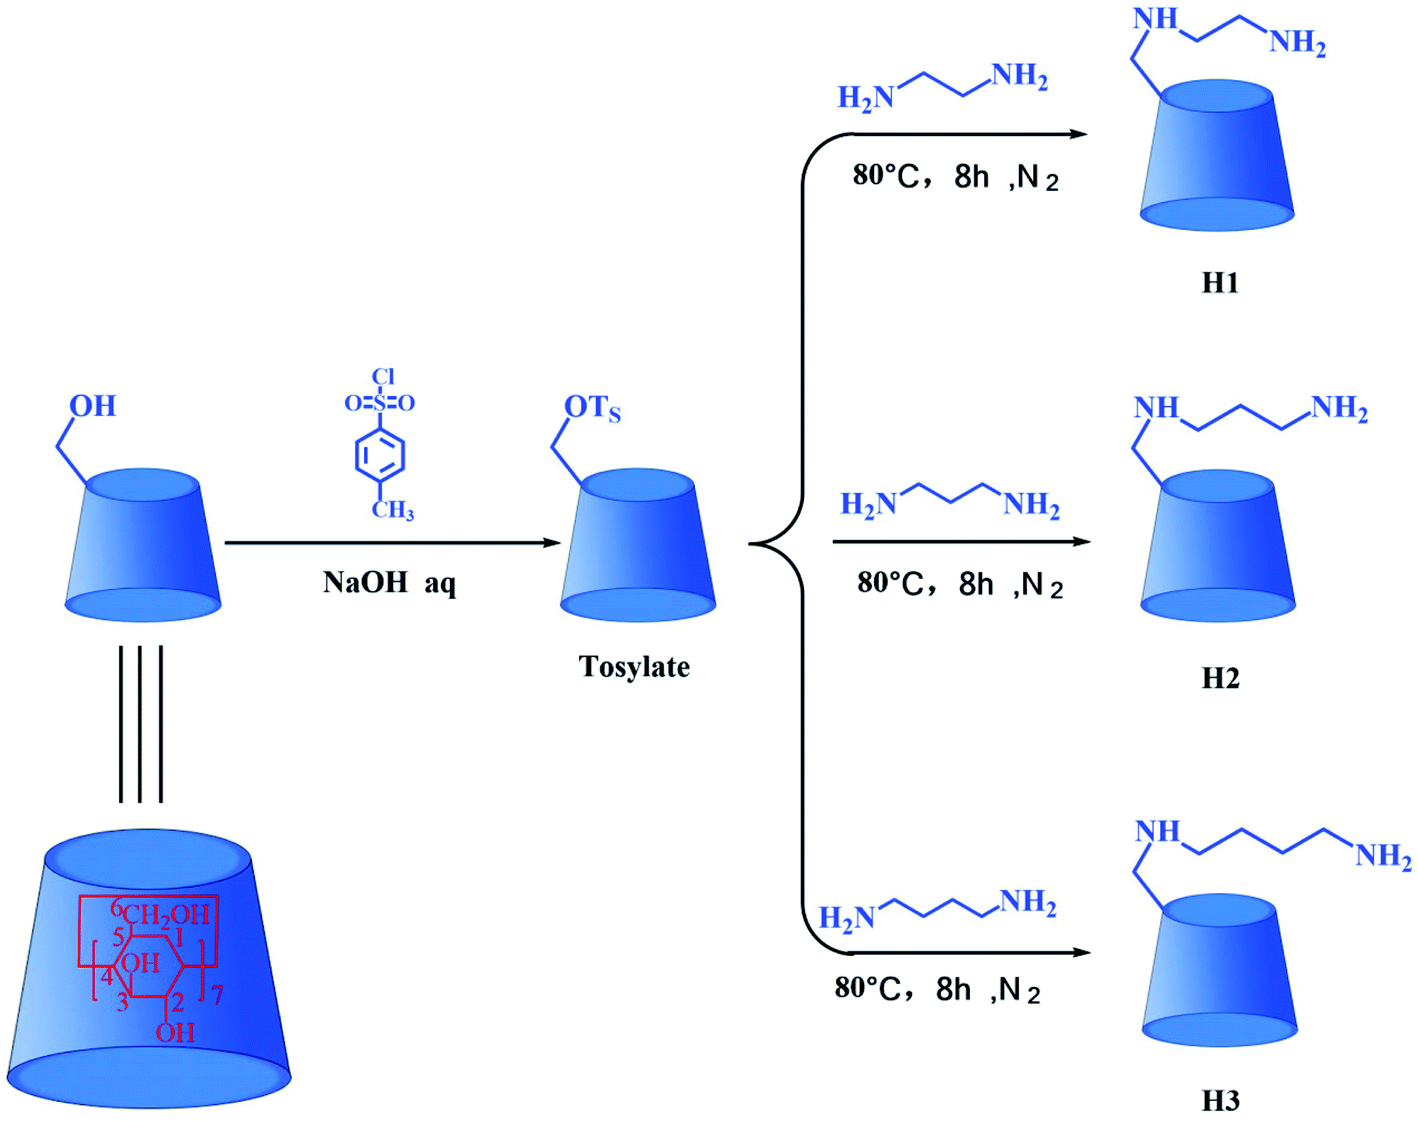
Cyclodextrins (CDs) are a kind of cyclic oligosaccharides.14 The native CDs typically contains six (α-CD), seven (β-CD) eight (γ-CD) D-glucopyranose units linked by 1,4-glucoside bonds.15–17 In terms of structure, CDs possess a hydrophilic outer surface and hydrophobic central cavity.18 Because of the distinctive molecular structure of CDs, they are used as hosts to form inclusion complexes with various inorganic, organic and biological molecules.19–21 In recent years, the inclusion complexes of native CDs and their derivatives with drugs have been the subject of widespread research efforts aiming at improving water solubility, stability and bioavailability of drugs.22–25 Nevertheless, the application of native CDs is restrict on account of their poor water solubility and low binding ability toward the drug molecule. Fortunately, chemically modified CDs have been used to solve these problems. In recent years, the DTX formulations encompassing chemically modified CDs have been widely studied. Xu et al. reported biocompatible hyperbranched polyglycerol modified β-CDs (β-CDs-HPG) derivatives for DTX delivery. In vitro antitumor experiments showed that β-CDs-HPG/DTX effectively inhibited proliferation of human breast adenocarcinoma cells.26 Tao et al. reported that the DTX/folate acid-CDs (FA-CDs) inclusion complexes induced apoptosis in KB cells via the intrinsic mitochondrial pathway and displayed antitumor activity in vivo.27 Ren et al. reported that the inclusion complex of DTX with sulfobutyl ether β-CDs (DTX–SBE-β-CDs) was successfully prepared by using the saturated aqueous solution method. The inclusion complex could improve the oral bioavailability and enhance the cytotoxicity of cancer cells compared to free DTX.28 Mazzaferro et al. reported that the DTX aqueous solubility was successfully enhanced about 5374 times by using methyl-β-CDs (Me-β-CDs).29 These results indicate that the solubility, stability, and biological activity of the DTX guest molecules were improved after the formation of inclusion complexes with chemically modified CDs. Therefore, three alkylenediamine-modified β-CDs (H1–3, Fig. 2) with different alkylene segment lengths were researched in this paper. Compared with the native CDs, the alkylenediamine-modified β-CDs possess the amino group in side chain, providing more potential multiple recognition sites, thus remarkable increase molecular binding ability and water solubility.30,31
 |
| | Fig. 2 The synthesis routes for hosts H1–3. | |
The aim of the present work was the preparation and characterization of three water-soluble inclusion complexes, which were formed by DTX and alkylenediamine-modified β-CDs (H1–3) with different alkylene segment lengths. Meanwhile, we systematically discussed the host–guest interactions of H1–3/DTX inclusion complexes based on side chain lengths of alkylenediamine-modified β-CDs. We wish to investigate the binding behavior and solubilization effect of alkylenediamine-modified β-CDs toward DTX. Furthermore, we are particularly interested in exploring the in vitro release behavior, cytotoxicity and ability to induce apoptosis of the corresponding inclusion complexes. The research provides a useful approach for preparing novel DTX formulations with higher water solubility, better biological activity and lower toxicity.
2 Materials and methods
2.1 Materials
β-Cyclodextrin (β-CD) and N,N-dimethylformamide (DMF) were purchased from Adamas Reagent Co., Ltd; p-toluenesulfonyl chloride (TsCl), ethylenediamine, 1,3-diaminopropane, and 1,4-diaminobutane were acquired from Shanghai Titan Technology Co., Ltd; DTX was obtained from Chengdu Must Bio-Technology Co., Ltd; leukemia (HL-60), lung cancer (A-549), breast cancer (MCF-7), colon cancer (SW480), liver cancer (SMMC-7721) and human normal lung epithelial cells (BEAS-2B) were obtained from the American Type Culture Collection (ATCC); fetal bovine serum (FBS) was purchased from Israel Kibbutz Beit Haemek Company; Annexin V-FITC and PI apoptosis kit were purchased from BD Pharmingen Company. Mono-[6-O-(p-toluenesulfonyl)]-β-CD (tosylate) was synthesized by the reaction of the β-CD with TsCl,32 and the synthetic route is shown in Fig. 2.
2.2 Synthesis of three alkylenediamine-modified β-CDs (H1–3)
The synthesis routes for H1–3 are shown in Fig. 2. Mono-[6-(2-aminoethyl)-6-deoxy-β-CD] (H1) was synthesized according to a procedure described in the literature.31 Tosylate (3.0 g) was dissolved in ethylenediamine (30 mL), and the reaction mixture was stirred at 80 °C for 8 h under nitrogen atmosphere. On completion of the reaction, the reaction mixture was evaporated under reduced pressure to dryness, and the residue was subsequently dissolved in water. Then the resultant solution was slowly dripped into acetone and stirred to obtain precipitate. After filtration, washing and drying, the crude product was collected. Finally, the crude product was chromatographed on a Sephadex C-25 column with NaCl as eluent in order to obtain the pure sample H1, yield about 38%. 1H NMR (500 MHz, D2O, ppm): δ 4.90–4.97 (m, 7H, H-1 of CD), δ 3.69–3.87 (m, 28H, H-3, 6, 5 of CD), δ 3.37–3.56 (m, 14H, H-2, 4 of CD), δ 2.71–3.01 (m, 4H, C–CH2–N); FT-IR (KBr) ν/cm−1: 3448, 2932, 1636, 1400, 1155, 1031; ESI-MS: m/z 1177 M.
Mono-[6-(3-aminopropyl)-6-deoxy-β-CD] (H2) was synthesized via a method similar to that followed for the synthesis of H1. The yield of H2 was 35%. 1H NMR (500 MHz, D2O, ppm): δ 4.91–4.97 (m, 7H, H-1 of CD), δ 3.68–3.86 (m, 28H, H-3, 6, 5 of CD), δ 3.41–3.54 (m, 14H, H-2, 4 of CD), δ 2.51–2.74 (m, 4H, C–CH2–N), δ 1.53–1.67 (m, 2H, C–CH2–C); FT-IR (KBr) ν/cm−1: 3415, 2932, 1639, 1407, 1157, 1030; ESI-MS: m/z 1191 M.
Mono-[6-(4-aminobutyl)-6-deoxy-β-CD] (H3) was synthesized via a method similar to that followed for the synthesis of H1. The yield of H3 was 42%. 1H NMR (500 MHz, D2O, ppm): δ 4.96–5.00 (m, 7H, H-1 of CD), δ 3.71–3.90 (m, 28H, H-3, 6, 5 of CD), δ 3.46–3.57 (m, 14H, H-2, 4 of CD), δ 2.74–2.80 (m, 4H, C–CH2–N), δ 1.45–1.57 (m, 4H, C–CH2–C); FT-IR (KBr) ν/cm−1: 3423, 2932, 1637, 1405, 1156, 1031; ESI-MS: m/z 1205 M.
2.3 Preparation of inclusion complexes
The H1–3/DTX inclusion complexes were prepared via the saturated aqueous solution method.33 Initially, H1 (0.01 mmol) and DTX (0.03 mmol) were dissolved in 3 mL of distilled water and 2 mL of ethanol, respectively. Thereafter, the ethanol solution of DTX was added to the aqueous solution of H1, and the mixture was stirred for 48 h at 45 °C. The obtained solution was dried and then dissolved in water. The unreacted DTX was filtered through a 0.45 μm cellulose membrane. Finally, the resulting filtrate was dried under vacuum to obtain the H1/DTX inclusion complex. The H2/DTX and H3/DTX inclusion complexes were prepared following a similar procedure.
2.4 Phase solubility studies
Phase solubility studies were conducted based on the method already reported by Higuchi and Connors.34 Briefly, an excess amount of DTX was added to the H1–3 aqueous solutions with the concentrations ranging from 0 to 1.8 mM. The mixed solution was shaken for 3 days, and then filtered using a 0.45 μm cellulose membrane. After that, the absorbance of the filtrate was detected at 230 nm by an UV-Vis spectrophotometer.
2.5 Characterization of inclusion complexes
1H NMR and 2D ROESY spectra of DTX, H1–3 and H1–3/DTX were recorded at 298 K with Bruker-Avance-DRX500 spectrometer. Prior the analysis, H1–3 and H1–3/DTX were dissolved in D2O, while the DMSO can be used as a solvent for DTX.
FT-IR spectra of DTX, H1–3 and H1–3/DTX were recorded on a FT-IR spectrometer (IR Affinity-1, Shimadzu) at a scanning range of 4000–400 cm−1. Before measurement, the samples were mixed with KBr and compressed to form tablets.
The X-ray diffractometry (XRD) patterns of DTX, H1–3 and H1–3/DTX were obtained using an X-ray diffractometer (DX2700). Data was collected at a 2θ diffraction angle range of 10–50° with a scan rate of 5° min−1 in 2θ.
The SEM images of DTX, H1–3 and H1–3/DTX were determined by a scanning electron microscope (NOVA NANOSEM-450) at 5.0 kV. Before electron microscope scans, a thin layer of gold is coated on the sample to make it electrically conductive.
2.6 Entrapment efficiency
Based on a previously reported procedure, the actual amount of DTX incorporated into inclusion complexes was calculated.35 The absorbance of the solution was detected at 230 nm by an UV-Vis spectrophotometer. The entrapment efficiency (EE%) was calculated according to the following eqn (1):| |
 | (1) |
where m1 is the weight of DTX entrapped in the inclusion complex, m2 is the weight of DTX used in the preparation of inclusion complex.
2.7 Water solubility test
The water solubility experiments of the H1–3/DTX inclusion complexes were carried using the saturated solution method.36 During the process of preparing the supersaturated solutions, excess amount of H1–3/DTX were added to the 400 μL distilled water and kept stirring at 25 °C for 2 h. After filtered with a 0.45 μm cellulose membrane, the absorbance value of the solution was determined using the UV-Vis spectrophotometer. The DTX standard curve used ethanol as solvent, and the concentration range was 0.031–0.25 mg mL−1. The solubility of the H1–3/DTX inclusion complexes were calculated by the standard curve of DTX.
2.8 In vitro release study
The in vitro release studies were performed to measure the released amount of DTX at various time points and evaluate its release properties. The H1–3/DTX inclusion complexes were weighed and dissolved in normal saline, and then the 1 mL prepared solution was placed in a 1000 Da dialysis bag. The dialysis bag was suspended into centrifuge tubes containing 5 mL of PBS (pH 7.4) and placed in a shaker at a temperature of 37 °C. Within a predetermined time interval, the whole release medium was taken out for analysis and replaced with fresh PBS of the same volume. The amount of the released DTX into PBS was determined by UV-Vis spectrophotometry. The same method was used to determine the release of the DTX in NaAc–HAc buffer solution (pH 5.0). In addition, the release amount of free DTX was determined under the same experimental conditions.
2.9 Cytotoxicity assay
The cytotoxicity of the samples were measured using a 3-(4,5-dimethylthiazol-2-yl)-2,5-diphenyltetrazolium bromide (MTT) assay.37 The H1–3/DTX inclusion complexes were dissolved in distilled water and DTX was dissolved in DMSO. The colon cancer (SW480), lung cancer (A-549), leukemia (HL-60), breast cancer (MCF-7), liver cancer (SMMC-7721), and human normal lung epithelial cells (BEAS-2B) were cultured in a medium containing 10% fetal bovine serum (FBS). Cells were seeded into 96-well plates at a density of 8000 cells per well in a total volume of 100 μL. After incubation in 5% CO2 at 37 °C for 24 h, certain amounts of DTX and H1–3/DTX inclusion complexes were used to treat the cells. After 48 h incubation, MTT was added into each culture well and incubated for 4 h at 37 °C. The absorbance of solution in each well was measured, each group experiment was measured three times in parallel and cisplatin (DDP) was used as the positive control. The cell inhibition rate (%) was calculated according to the following eqn (2):| |
 | (2) |
2.10 Cell apoptosis analysis by flow cytometry
Apoptosis analysis was carried out by the Annexin V-FITC (Annexin V) and propidium iodide (PI) dualstaining assay as described previously.38 Briefly, MCF-7 cells in logarithmic growth phase were seeded in 6-well plates at a density of 3 × 10⁵ cells per well and incubated overnight. The MCF-7 cells were treated with various concentrations of DTX and H1/DTX (5 μg mL−1, 10 μg mL−1, 15 μg mL−1), respectively. After 48 h of treatment, cells were harvested and washed twice with PBS, resuspended in 100 μL of 1× binding buffer. Cells were further incubated in 5 μL Annexin V and 5 μL PI at room temperature in the dark for 15 min, and then analyzed using flow cytometer (BD, FACSCelesta, America).
3 Results and discussion
3.1 Phase solubility analysis
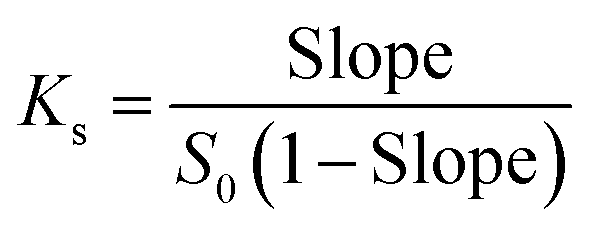
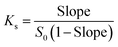
The phase solubility diagrams (Fig. 3) showed that the solubility of DTX in water increased linearly with increasing concentration of H1–3. On the basis of the Higuchi and Connors's theory, these three diagrams can be classified as AL type. It means that the inclusion complexes stoichiometric ratio between H1–3 with DTX were 1:1. The stability constants (Ks) of the H1–3/DTX were calculated according to the phase solubility diagrams and eqn (3), where S0 is the solubility of DTX at 25 °C in the absence of H1–3 and Slope means the corresponding slope of the phase solubility diagrams. The calculated values of Ks were 2697.8, 5910.8 and 6787.4 M−1 for inclusion complexes of DTX with H1–3, respectively.| |
 | (3) |
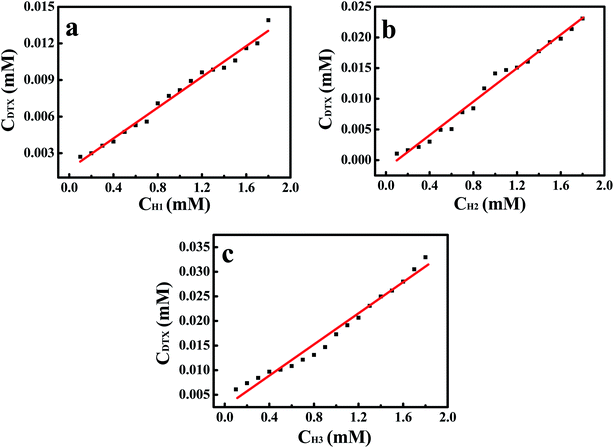 |
| | Fig. 3 The phase solubility diagrams for guest DTX in the presence of H1–3 (a–c) at 25 °C. | |
3.2 Binding ability
Amid the various non-covalent weak interactions, van der Waals and hydrophobic interactions play a crucial role in the formation of inclusion complexes of host CDs with guest molecules. As inferred from Table 1, the binding abilities of hosts H1–3 towards DTX decrease in the following order: H3 > H2 > H1, which were in good consistency with the decreasing alkylene lengths of these hosts. Among them, H3 had the strongest binding ability toward DTX, and its Ks value was 6787.4 M−1. This may be attributed to the fact that the introduction of more methylene groups in side chain extends the hydrophobic cavity of alkylenediamine-modified CDs. With increasing chain lengths in host H1–3, more methylene groups helped to strengthen van der Waals and hydrophobic interactions of alkylenediamine-modified CDs towards the DTX, thus facilitating the formation of inclusion complexes. Consequently, van der Waals and hydrophobic interactions are regarded as significant factors for the stability of H1–3/DTX inclusion complexes.
Table 1 Complex stability constant (Ks) and Gibbs free energy change (−ΔG°) for H1–3/DTX inclusion complexes at 25 °C
| Host |
Guest |
Ks (M−1) |
LogKs |
−ΔG° (kJ mol−1) |
| H1 |
DTX |
2697.8 |
3.43 |
8.50 |
| H2 |
DTX |
5910.8 |
3.77 |
9.34 |
| H3 |
DTX |
6787.4 |
3.83 |
9.49 |
3.3 Characterization
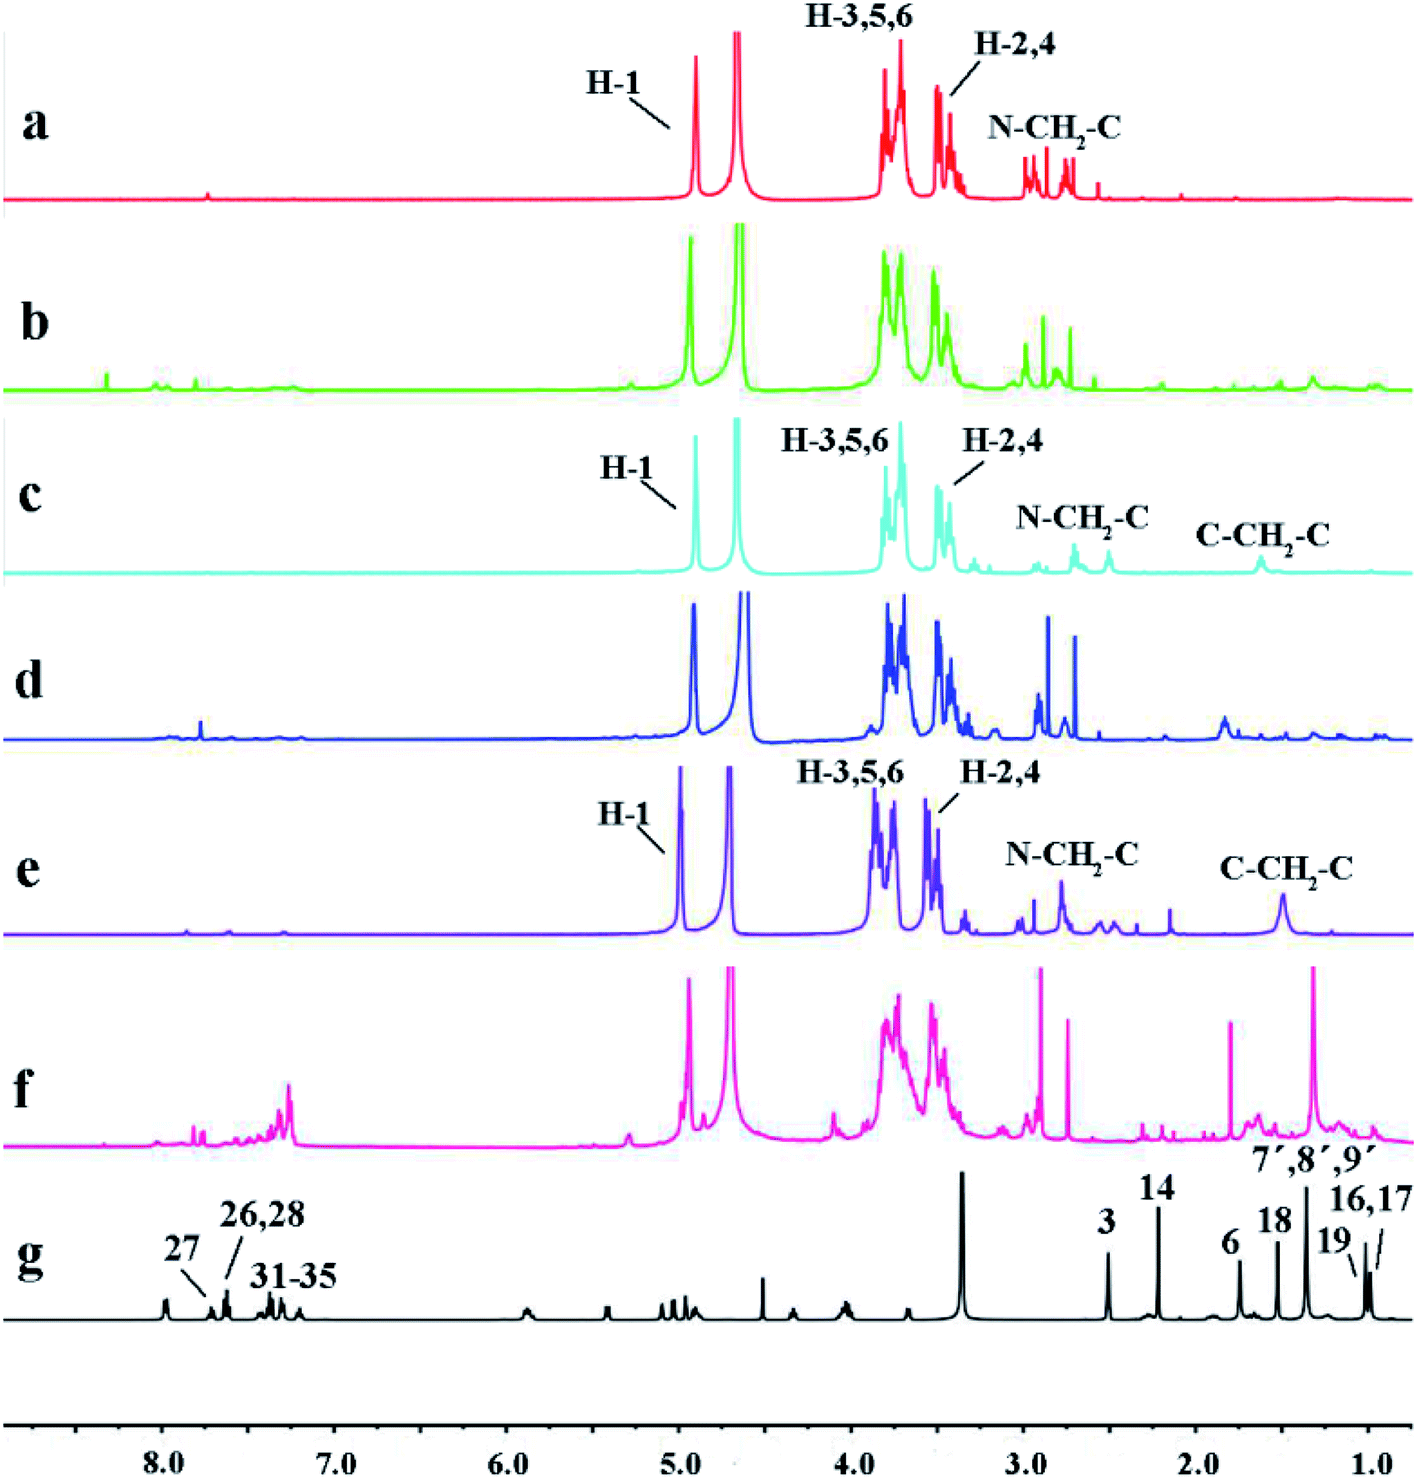
3.3.1 NMR investigations. NMR spectroscopy is one of the most effective methods for studying the formation of host–guest inclusion complexes.39 With the formation of inclusion complexes, the chemical shifts of host and guest molecules would be affected. The 1H NMR spectra of DTX, H1–3 and H1–3/DTX inclusion complexes are shown in Fig. 4. The major chemical shifts of H1 protons (Fig. 4a) are presented at 2.5–5.0 ppm, which are distinct from those of DTX (Fig. 4g) protons at 1.0–2.5 ppm and 7.0–8.0 ppm. As illustrated in Fig. 4b, the H1/DTX inclusion complex possesses the characteristic protons both of H1 and DTX. Additionally, the chemical shifts and changes in the H1–3 inclusion complexes are summarized in Table 2. After forming the H1/DTX inclusion complex, the H-1, H-2, H-3, H-4, H-5 and H-6 protons of host H1 displayed upfield shifts. It is noteworthy that the H-3 and H-5 protons exhibited relatively evident upfield shifts (Δδ = −0.05, −0.04 ppm) compared with H-1, H-2, H-4 and H-6 protons. Because the H-3 and H-5 protons are located in the inner cavity of CD, we can deduce that the DTX may have entered into the CD cavity and formed the inclusion complex of H1/DTX. Furthermore, similar results can also be obtained from the 1H NMR spectra of H2/DTX and H3/DTX.
 |
| | Fig. 4 The 1H NMR spectra of (a) H1, (b) H1/DTX, (c) H2, (d) H2/DTX, (e) H3, (f) H3/DTX, and (g) DTX (a–f in D2O, g in DMSO). | |
Table 2 Chemical shifts values (δ) of H1–3 protons in the presence and absence of DTX
| |
H1 |
H1/DTX |
Δδ |
H2 |
H2/DTX |
Δδ |
H3 |
H3/DTX |
Δδ |
| δ |
δ |
δ |
δ |
δ |
δ |
| H-1 |
4.93 |
4.90 |
−0.03 |
4.94 |
4.91 |
−0.03 |
4.99 |
4.94 |
−0.05 |
| H-2 |
3.53 |
3.52 |
−0.01 |
3.52 |
3.50 |
−0.02 |
3.56 |
3.53 |
−0.03 |
| H-3 |
3.86 |
3.81 |
−0.05 |
3.84 |
3.80 |
−0.04 |
3.86 |
3.81 |
−0.05 |
| H-4 |
3.45 |
3.44 |
−0.01 |
3.43 |
3.42 |
−0.01 |
3.50 |
3.46 |
−0.04 |
| H-5 |
3.82 |
3.78 |
−0.04 |
3.82 |
3.79 |
−0.03 |
3.84 |
3.78 |
−0.06 |
| H-6 |
3.73 |
3.70 |
−0.03 |
3.71 |
3.69 |
−0.02 |
3.75 |
3.72 |
−0.03 |
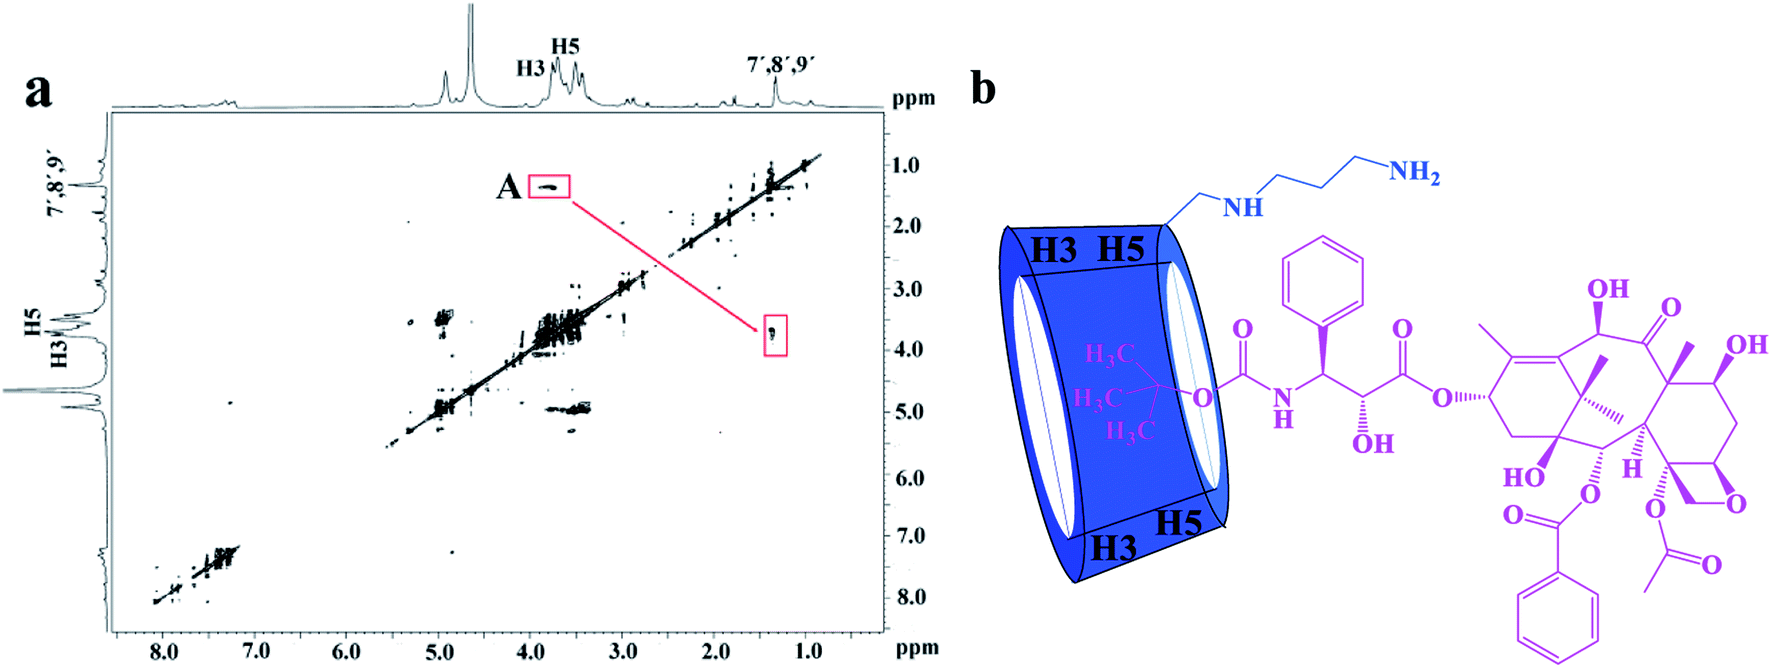
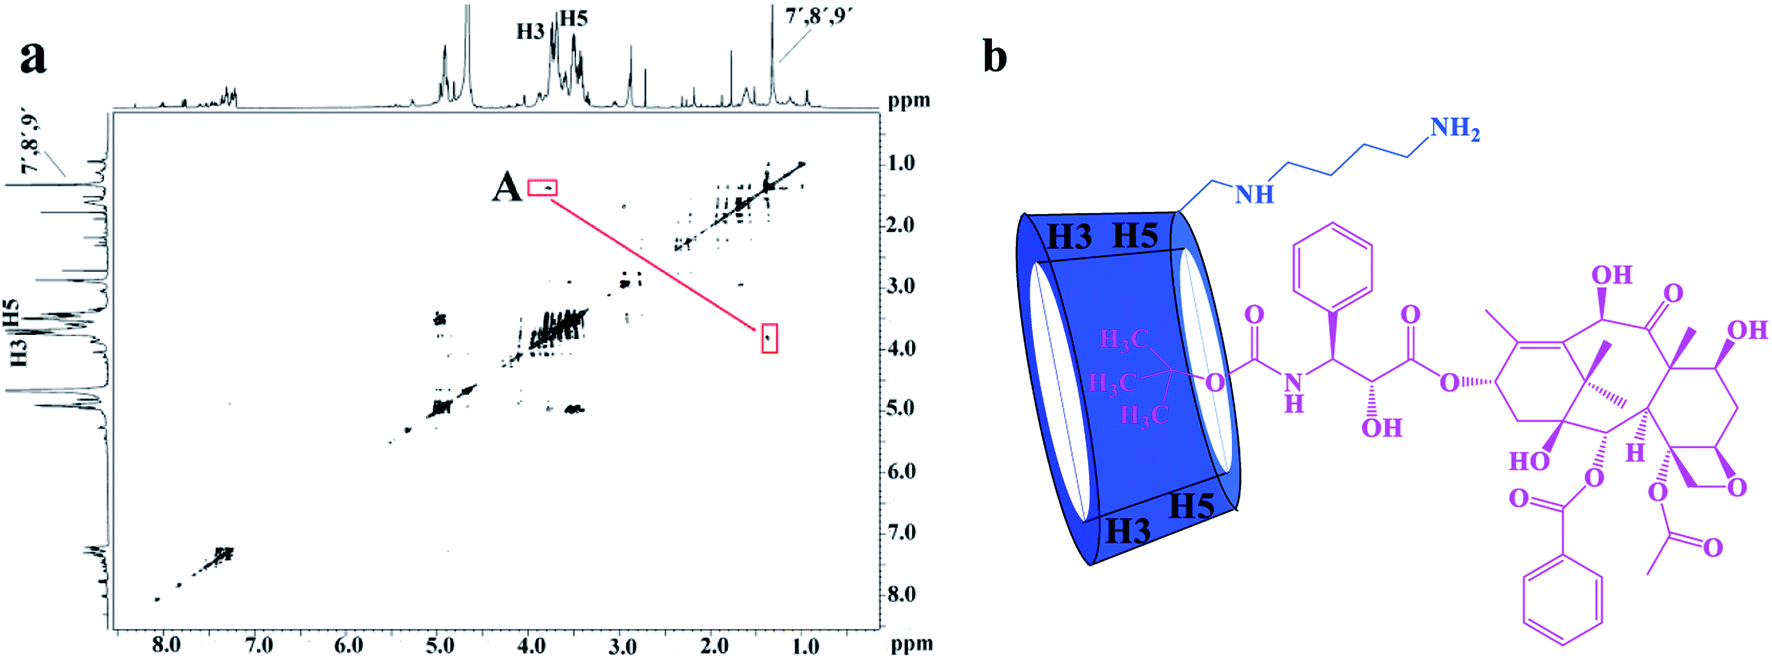
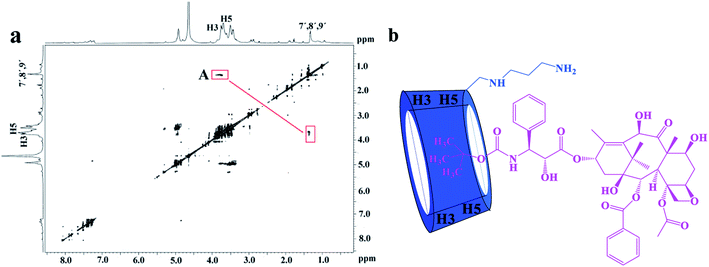
The 2D ROESY experiments were performed to further investigate the possible inclusion modes between the H1–3 hosts and DTX. The 2D ROESY spectrum of H1/DTX inclusion complex (Fig. 5a) displays the obvious correlations (peak A) between H7′, H8′ and H9′ protons of DTX with H-3 and H-5 protons of H1. It can also be observed from peak A that the corresponding DTX protons had a stronger correlation with the H-5 protons of CD than those of H-3 protons. Since H-3 protons are located near the wide side of the CD cavity, whereas the H-5 protons are near the narrow side, it can be inferred that the H7′, H8′ and H9′ protons of DTX were included in the CD cavity from the narrow side. According to the aforementioned results, along with the 1:1 stoichiometry, the possible inclusion mode of H1/DTX inclusion complex is shown in Fig. 5b. In addition, similar inclusion modes were acquired from H2/DTX (Fig. 6b) and H3/DTX (Fig. 7b) inclusion complexes.
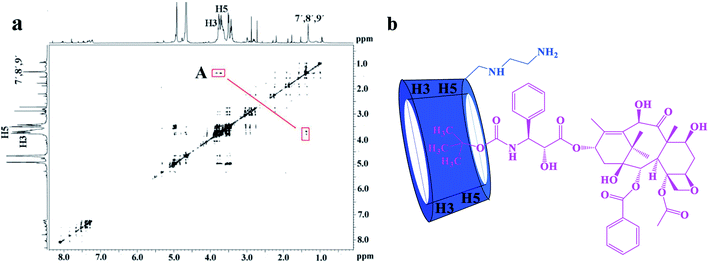 |
| | Fig. 5 (a) The 2D ROESY spectrum of H1/DTX inclusion complex in D2O; (b) possible binding mode of H1 with DTX. | |
 |
| | Fig. 6 (a) The 2D ROESY spectrum of H2/DTX inclusion complex in D2O; (b) possible binding mode of the H2 with DTX. | |
 |
| | Fig. 7 (a) The 2D ROESY spectrum of H3/DTX inclusion complex in D2O; (b) possible binding mode of the H3 with DTX. | |
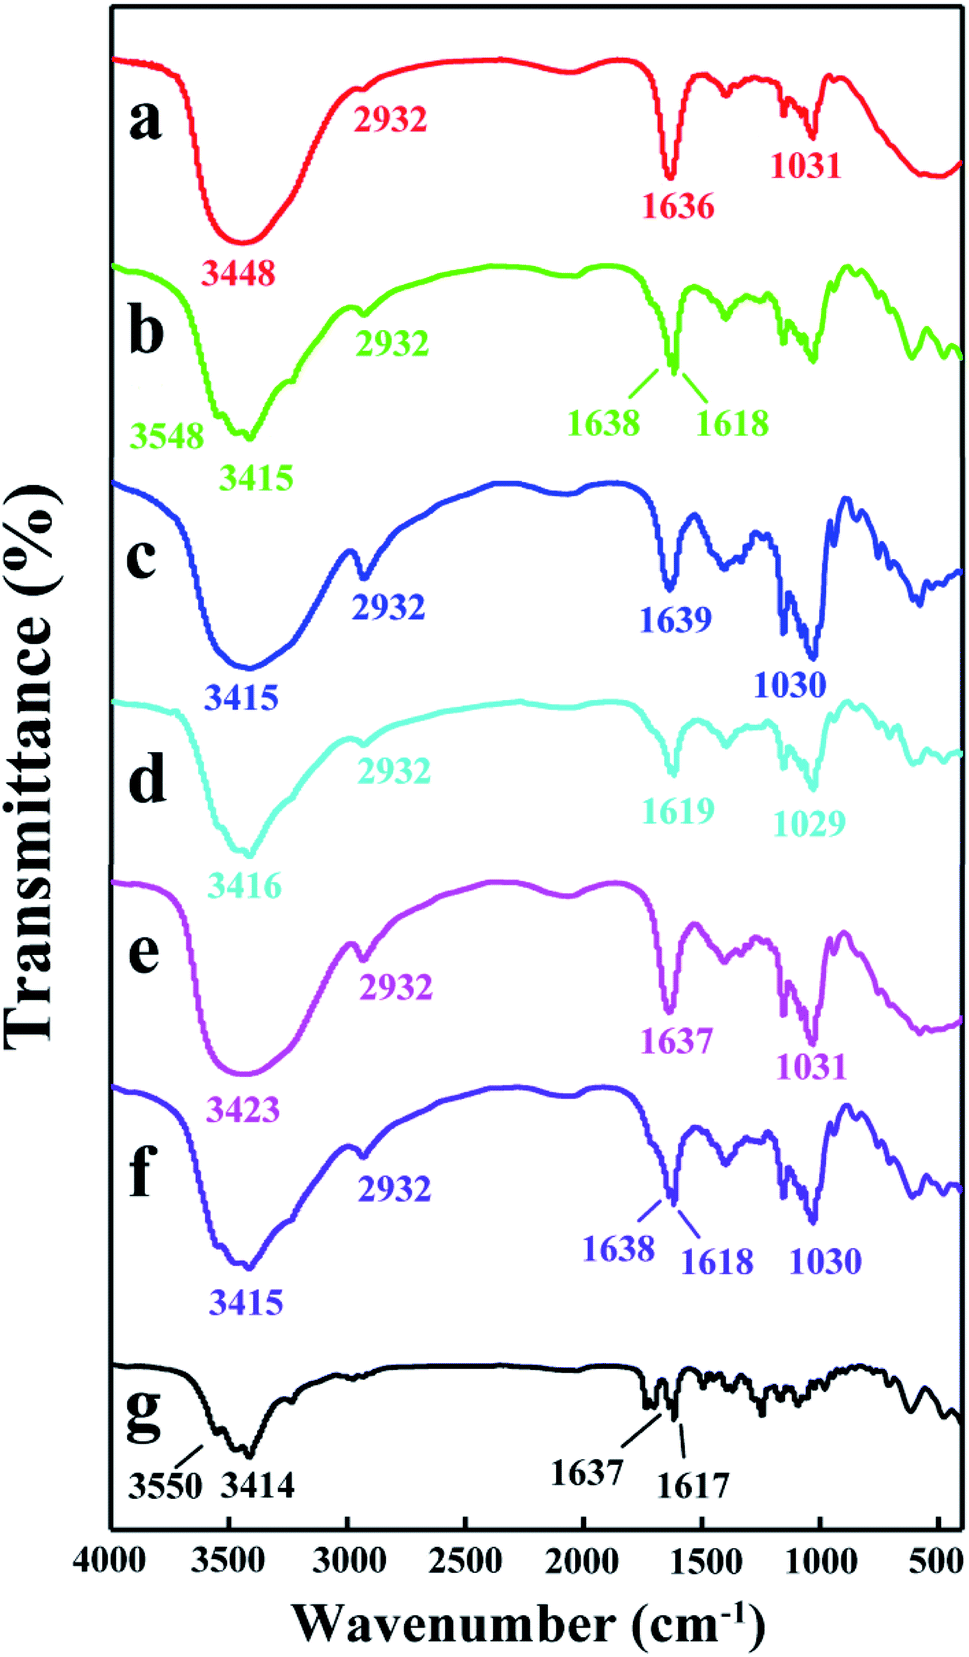
3.3.2 FT-IR analysis. FT-IR spectra is an important tool to confirm the formation of inclusion complexes between guest and host molecules.40 The FT-IR spectra of DTX, H1–3 and H1–3/DTX inclusion complexes are represented in Fig. 8. The spectrum of DTX (Fig. 8g) showed characteristic sharp peaks at 3550 cm−1 (for –OH stretching vibrations), 3414 cm−1 (for –NH stretching vibrations), 1637 and 1617 cm−1 (for C![[double bond, length as m-dash]](https://www.rsc.org/images/entities/char_e001.gif) O stretching vibrations). The characteristic peaks of H1 (Fig. 8a) appeared at 3448 cm−1 (for –OH stretching vibrations), 2932 cm−1 (for –CH and –CH2 stretching vibrations), 1636 cm−1 (for H–O–H bending), and 1031 cm−1 (for C–O–C stretching vibrations). After forming the H1/DTX inclusion complex (Fig. 8b), the absorption peaks of DTX at 3550 cm−1, 3414 cm−1, 1637 cm−1 and 1617 cm−1 were shifted to 3548 cm−1, 3415 cm−1, 1638 cm−1 and 1618 cm−1, respectively. Besides, some other absorption peaks of DTX between 1500 and 800 cm−1 disappeared. Meanwhile, the shapes and strength of the peaks for H1/DTX inclusion complex were different from H1 at 3448 and 1636 cm−1. These phenomena demonstrated the formation of H1/DTX inclusion complex. The similar results confirm the formation of H2/DTX and H3/DTX inclusion complexes as illustrated in Fig. 8c–f.
O stretching vibrations). The characteristic peaks of H1 (Fig. 8a) appeared at 3448 cm−1 (for –OH stretching vibrations), 2932 cm−1 (for –CH and –CH2 stretching vibrations), 1636 cm−1 (for H–O–H bending), and 1031 cm−1 (for C–O–C stretching vibrations). After forming the H1/DTX inclusion complex (Fig. 8b), the absorption peaks of DTX at 3550 cm−1, 3414 cm−1, 1637 cm−1 and 1617 cm−1 were shifted to 3548 cm−1, 3415 cm−1, 1638 cm−1 and 1618 cm−1, respectively. Besides, some other absorption peaks of DTX between 1500 and 800 cm−1 disappeared. Meanwhile, the shapes and strength of the peaks for H1/DTX inclusion complex were different from H1 at 3448 and 1636 cm−1. These phenomena demonstrated the formation of H1/DTX inclusion complex. The similar results confirm the formation of H2/DTX and H3/DTX inclusion complexes as illustrated in Fig. 8c–f.
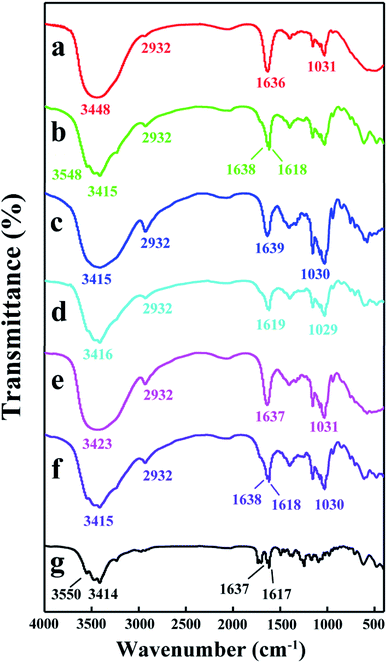 |
| | Fig. 8 FT-IR spectra of (a) H1, (b) H1/DTX, (c) H2, (d) H2/DTX, (e) H3, (f) H3/DTX, and (g) DTX. | |
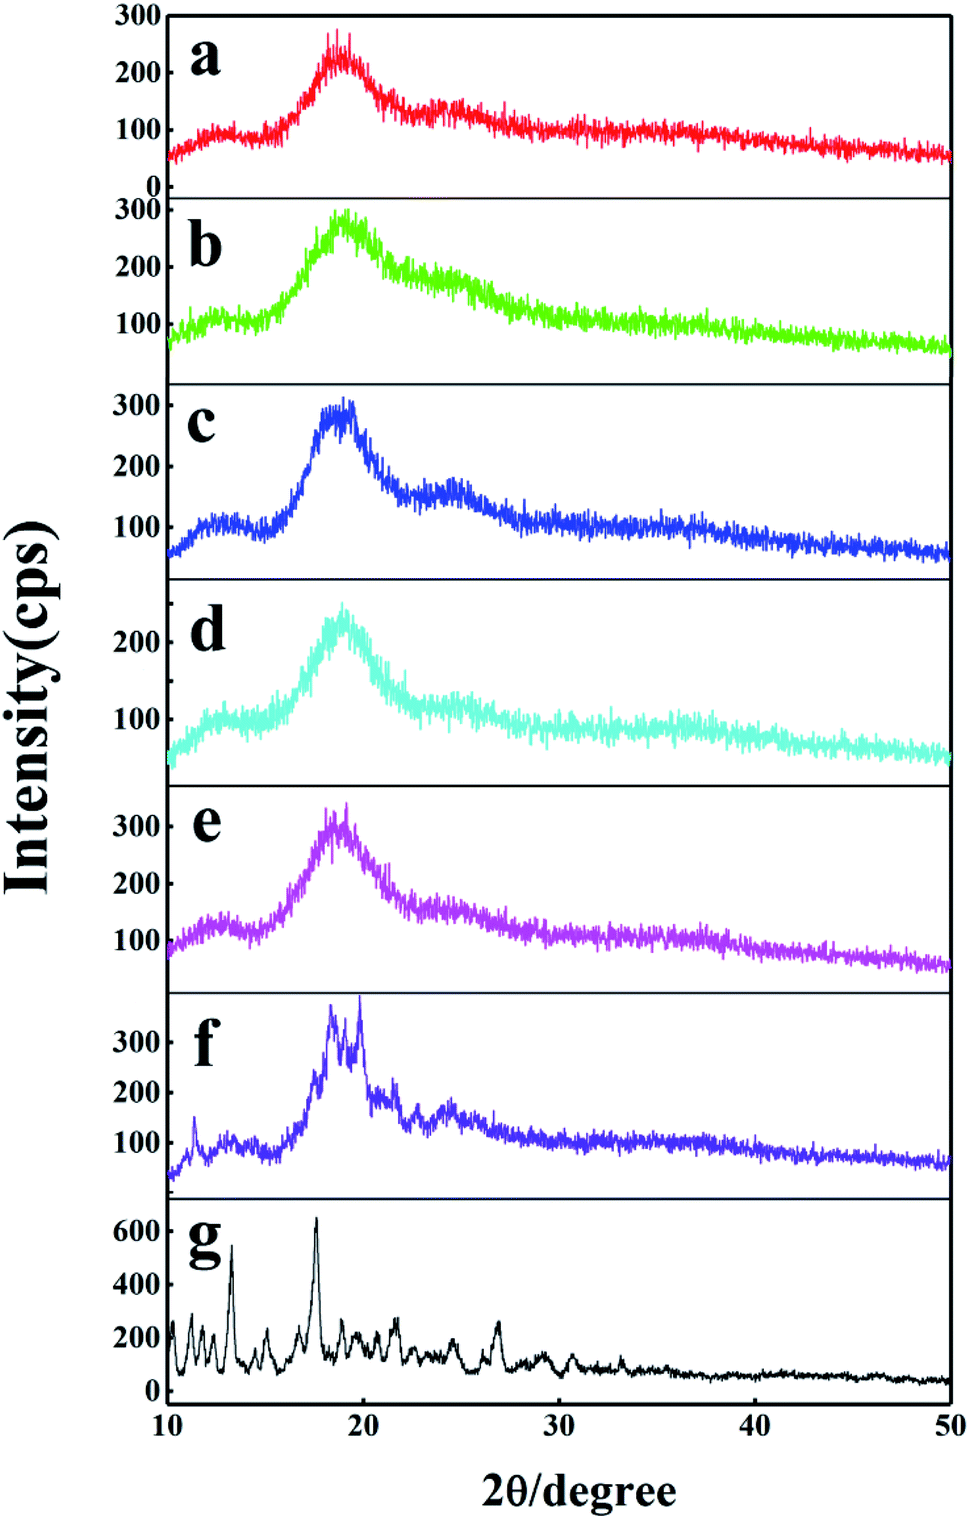
3.3.3 XRD analysis. The formation of the inclusion complex has been researched further by powder X-ray diffraction (XRD) method. The XRD patterns of DTX, H1–3 and H1–3/DTX inclusion complexes are displayed in Fig. 9. The XRD pattern of DTX (Fig. 9g) displayed several distinct diffraction peaks at 2θ = 10.3°, 11.2°, 11.8°, 13.1°, 17.6°, 21.7° and 26.9°, which indicated its crystalline state. On the other hand, the H1 (Fig. 9a) showed broad peaks consistent with its amorphous nature. For the H1/DTX inclusion complex (Fig. 9b), the diffraction pattern was similar with the amorphous state of the H1, while the crystalline peaks of DTX were entirely disappeared. In addition, the diffraction pattern of the H1/DTX inclusion complex is quite different from a superimposition of H1 and DTX. These results clearly support the successful preparation of the H1/DTX inclusion complex. Similar results were obtained to confirm the formation of H2/DTX and H3/DTX inclusion complexes.
 |
| | Fig. 9 XRD patterns of (a) H1, (b) H1/DTX, (c) H2, (d) H2/DTX, (e) H3, (f) H3/DTX, and (g) DTX. | |
3.3.4 SEM analysis. SEM can be used as a qualitative method to research on the surface morphology of substances.41 The SEM images of the DTX, H1–3 and H1–3/DTX inclusion complexes are illustrated in Fig. 10. The SEM images show that DTX (Fig. 10a) forms rod-like structure of different sizes, while in the case of H1–3 (Fig. 10b–d) irregular blocks with smooth surface was observed. In the case of the H1–3/DTX inclusion complexes (Fig. 10e–g) blocks of large dimensions, different in size and shape from the structures originated from the DTX and H1–3, were apparent. These results confirmed the formation of H1–3/DTX inclusion complexes.
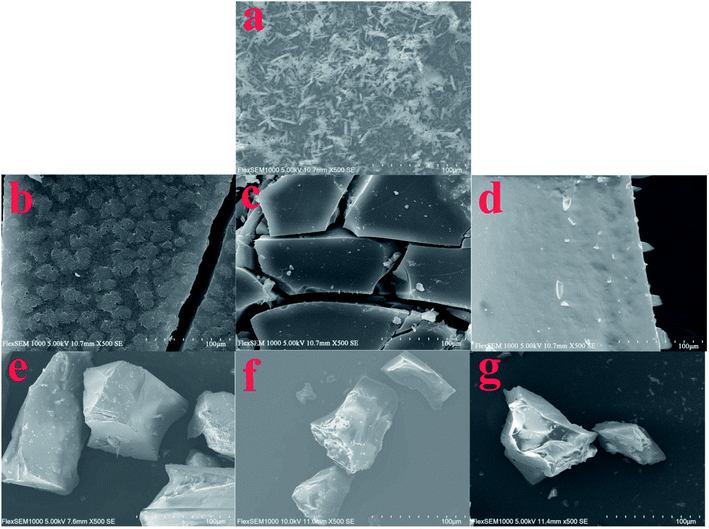 |
| | Fig. 10 SEM images of (a) DTX, (b) H1, (c) H2, (d) H3, (e) H1/DTX, (f) H2/DTX, and (g) H3/DTX. | |
3.4 Entrapment efficiency
The entrapment efficiency (EE%) is a quantitative parameter for determining the entrapment amount of active compounds in the inclusion complex. In the present study, EE% of H1–3/DTX inclusion complexes was 83.78%, 78.82% and 90.34% respectively.
3.5 Water solubility
The water solubility of the H1–3/DTX inclusion complexes was evaluated and the results are shown in Table 3. The result demonstrated that the water solubility of DTX (0.0019 mg mL−1) significantly increased upon formulating the corresponding H–3/DTX inclusion complexes to 0.41, 0.46 and 0.48 mg mL−1, respectively. The water solubility of H1–3/DTX inclusion complexes were significantly increased by approximately 216, 242 and 253 times as compared with free DTX, respectively. This result indicates that the effect of increasing the water solubility was in good agreement with the result of the stability constants.
Table 3 Water solubility of the H1–3/DTX inclusion complexes at 25 °C
| |
Solubility (mg mL−1) |
Fold increase |
| DTX |
0.0019 |
— |
| H1/DTX |
0.41 |
216 |
| H2/DTX |
0.46 |
242 |
| H3/DTX |
0.48 |
253 |
3.6 In vitro release studies
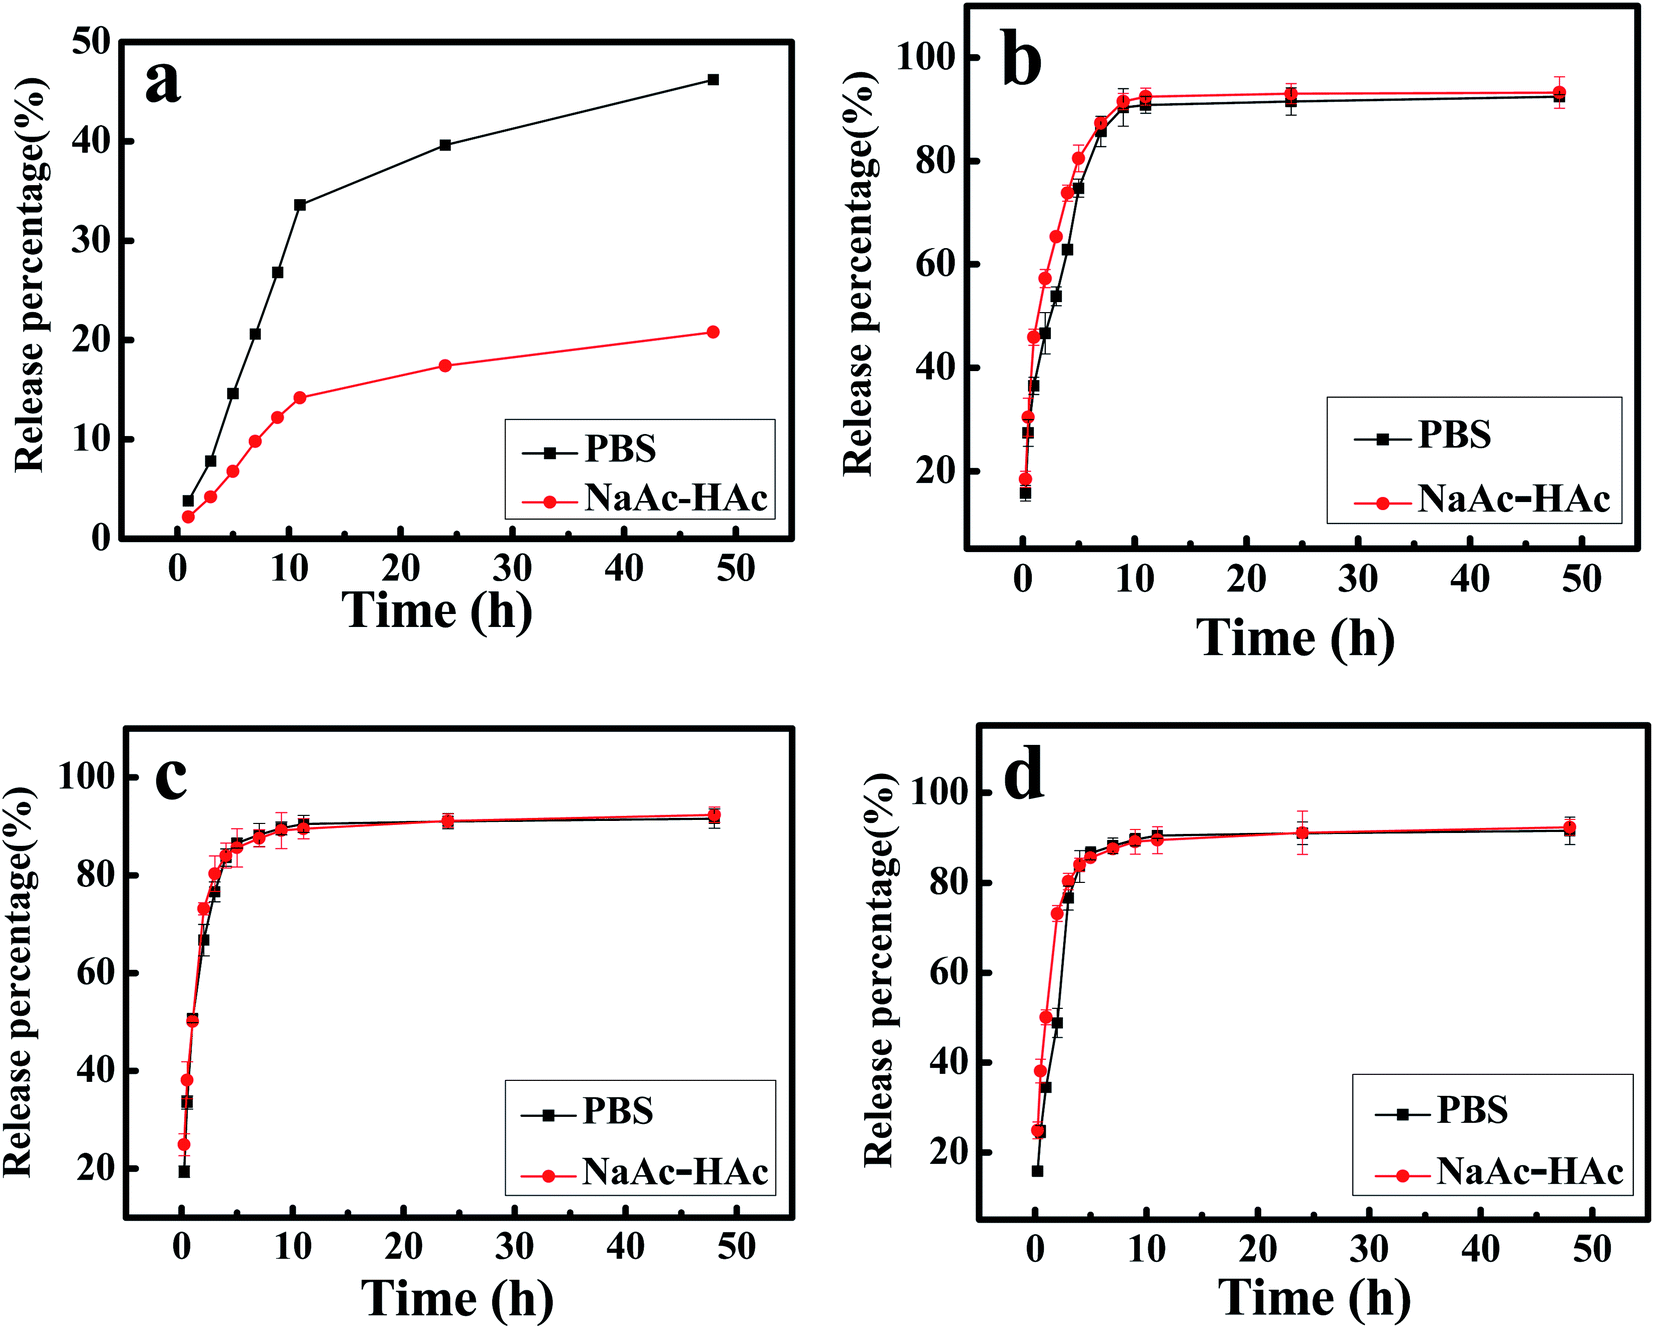
The in vitro release profiles of DTX from H1–3/DTX inclusion complexes into PBS (pH 7.4) or NaAc–HAc buffer solution (pH 5.0) are shown in Fig. 11. This studies depicted sustained release behavior of DTX over a period of 48 h. The cumulative release profile of free DTX was a relatively slow release pattern (Fig. 11a). In 10 h, the release percentage of free DTX into PBS (pH 7.4) or NaAc–HAc buffer solution (pH 5.0) was approximately 33% and 14%, respectively. In contrast, the cumulative release profiles of DTX from H1–3/DTX inclusion complexes (Fig. 11b–d) in different release mediums are shown an initial burst phase followed by slow sustained release phase. As inferred from Fig. 11b–d, DTX release showed a very rapid initial burst and approximately 60% of the drug content was released from the inclusion complex. The second phase was a relatively slow release pattern and approximately 90% of the drug content was released in 10 h. Compared with free DTX, the release percentage of DTX from H1–3/DTX inclusion complexes into PBS (pH 7.4) or NaAc–HAc buffer solution (pH 5.0) was higher. Meanwhile, the cumulative release profiles of the DTX from H1–3/DTX inclusion complexes are similar in different release mediums.
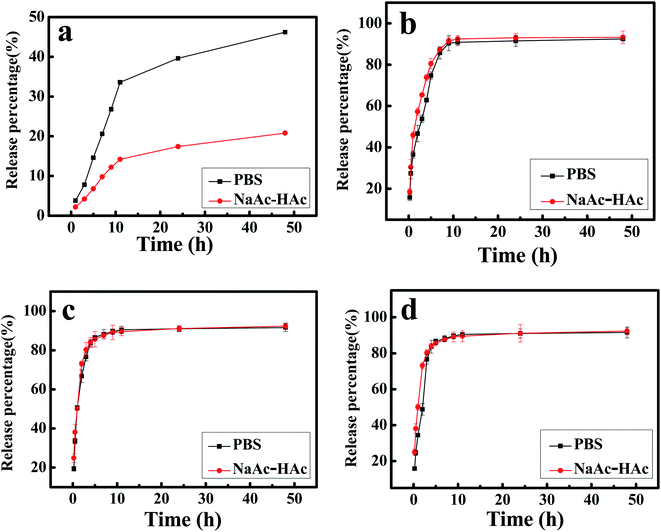 |
| | Fig. 11 (a) The release profile of free DTX into PBS (pH 7.4) or NaAc–HAc buffer solution (pH 5.0); in vitro release profile of DTX from (b) H1/DTX, (c) H2/DTX, and (d) H3/DTX into PBS (pH 7.4) or NaAc–HAc buffer solution (pH 5.0). | |
3.7 Cytotoxicity assay
The cytotoxicity of DTX and H1–3/DTX against HL-60, A-549, MCF-7, SW480 and SMMC-7721 cells were evaluated through MTT assay, using cisplatin as the positive control. As evidenced in Table 4, the cytotoxicity of DTX and H1–3/DTX against five human cancer cell lines (HL-60, A-549, MCF-7, SW480, and SMMC-7721) was amplified as compared with the control cisplatin. Compared with the DTX, the H1/DTX displayed higher cytotoxicity against MCF-7 and SW480 cells, while the cytotoxicity of H2/DTX and H3/DTX against A-549 cells was found to be significantly increased. These results indicated that enhanced anticancer activity was obtained by encapsulating free DTX with H1–3.
Table 4 The cytotoxicity of DTX and H1–3/DTX inclusion complexes against five human cancer cell lines
| Compounds |
IC50 (μM) |
| HL-60 |
A-549 |
MCF-7 |
SW480 |
SMMC-7721 |
| DTX |
<0.00256 |
9.98 |
0.078 |
0.277 |
<0.00256 |
| H1/DTX |
<0.00256 |
— |
0.038 |
0.228 |
0.89 |
| H2/DTX |
0.111 |
4.54 |
0.742 |
3.142 |
7.69 |
| H3/DTX |
0.287 |
5.02 |
0.811 |
3.069 |
7.26 |
| Cisplatin |
2.19 |
17.73 |
9.72 |
9.11 |
5.88 |
Furthermore, Table 5 shows the half-maximal inhibitory concentration value (IC50) of DTX and H1–3/DTX toward human normal lung epithelial cell BEAS-2B. It's worth noting that the cytotoxicity of H2/DTX and H3/DTX to the normal cells was similar to that of DTX.
Table 5 The impact of DTX and H1–3/DTX inclusion complexes toward human normal lung epithelial cells (BEAS-2B)
| Compounds |
IC50 (μM) |
SD |
| DTX |
20.76 |
1.16 |
| H1/DTX |
3.886 |
0.26 |
| H2/DTX |
20.47 |
0.81 |
| H3/DTX |
21.55 |
1.37 |
3.8 Cell apoptosis analysis
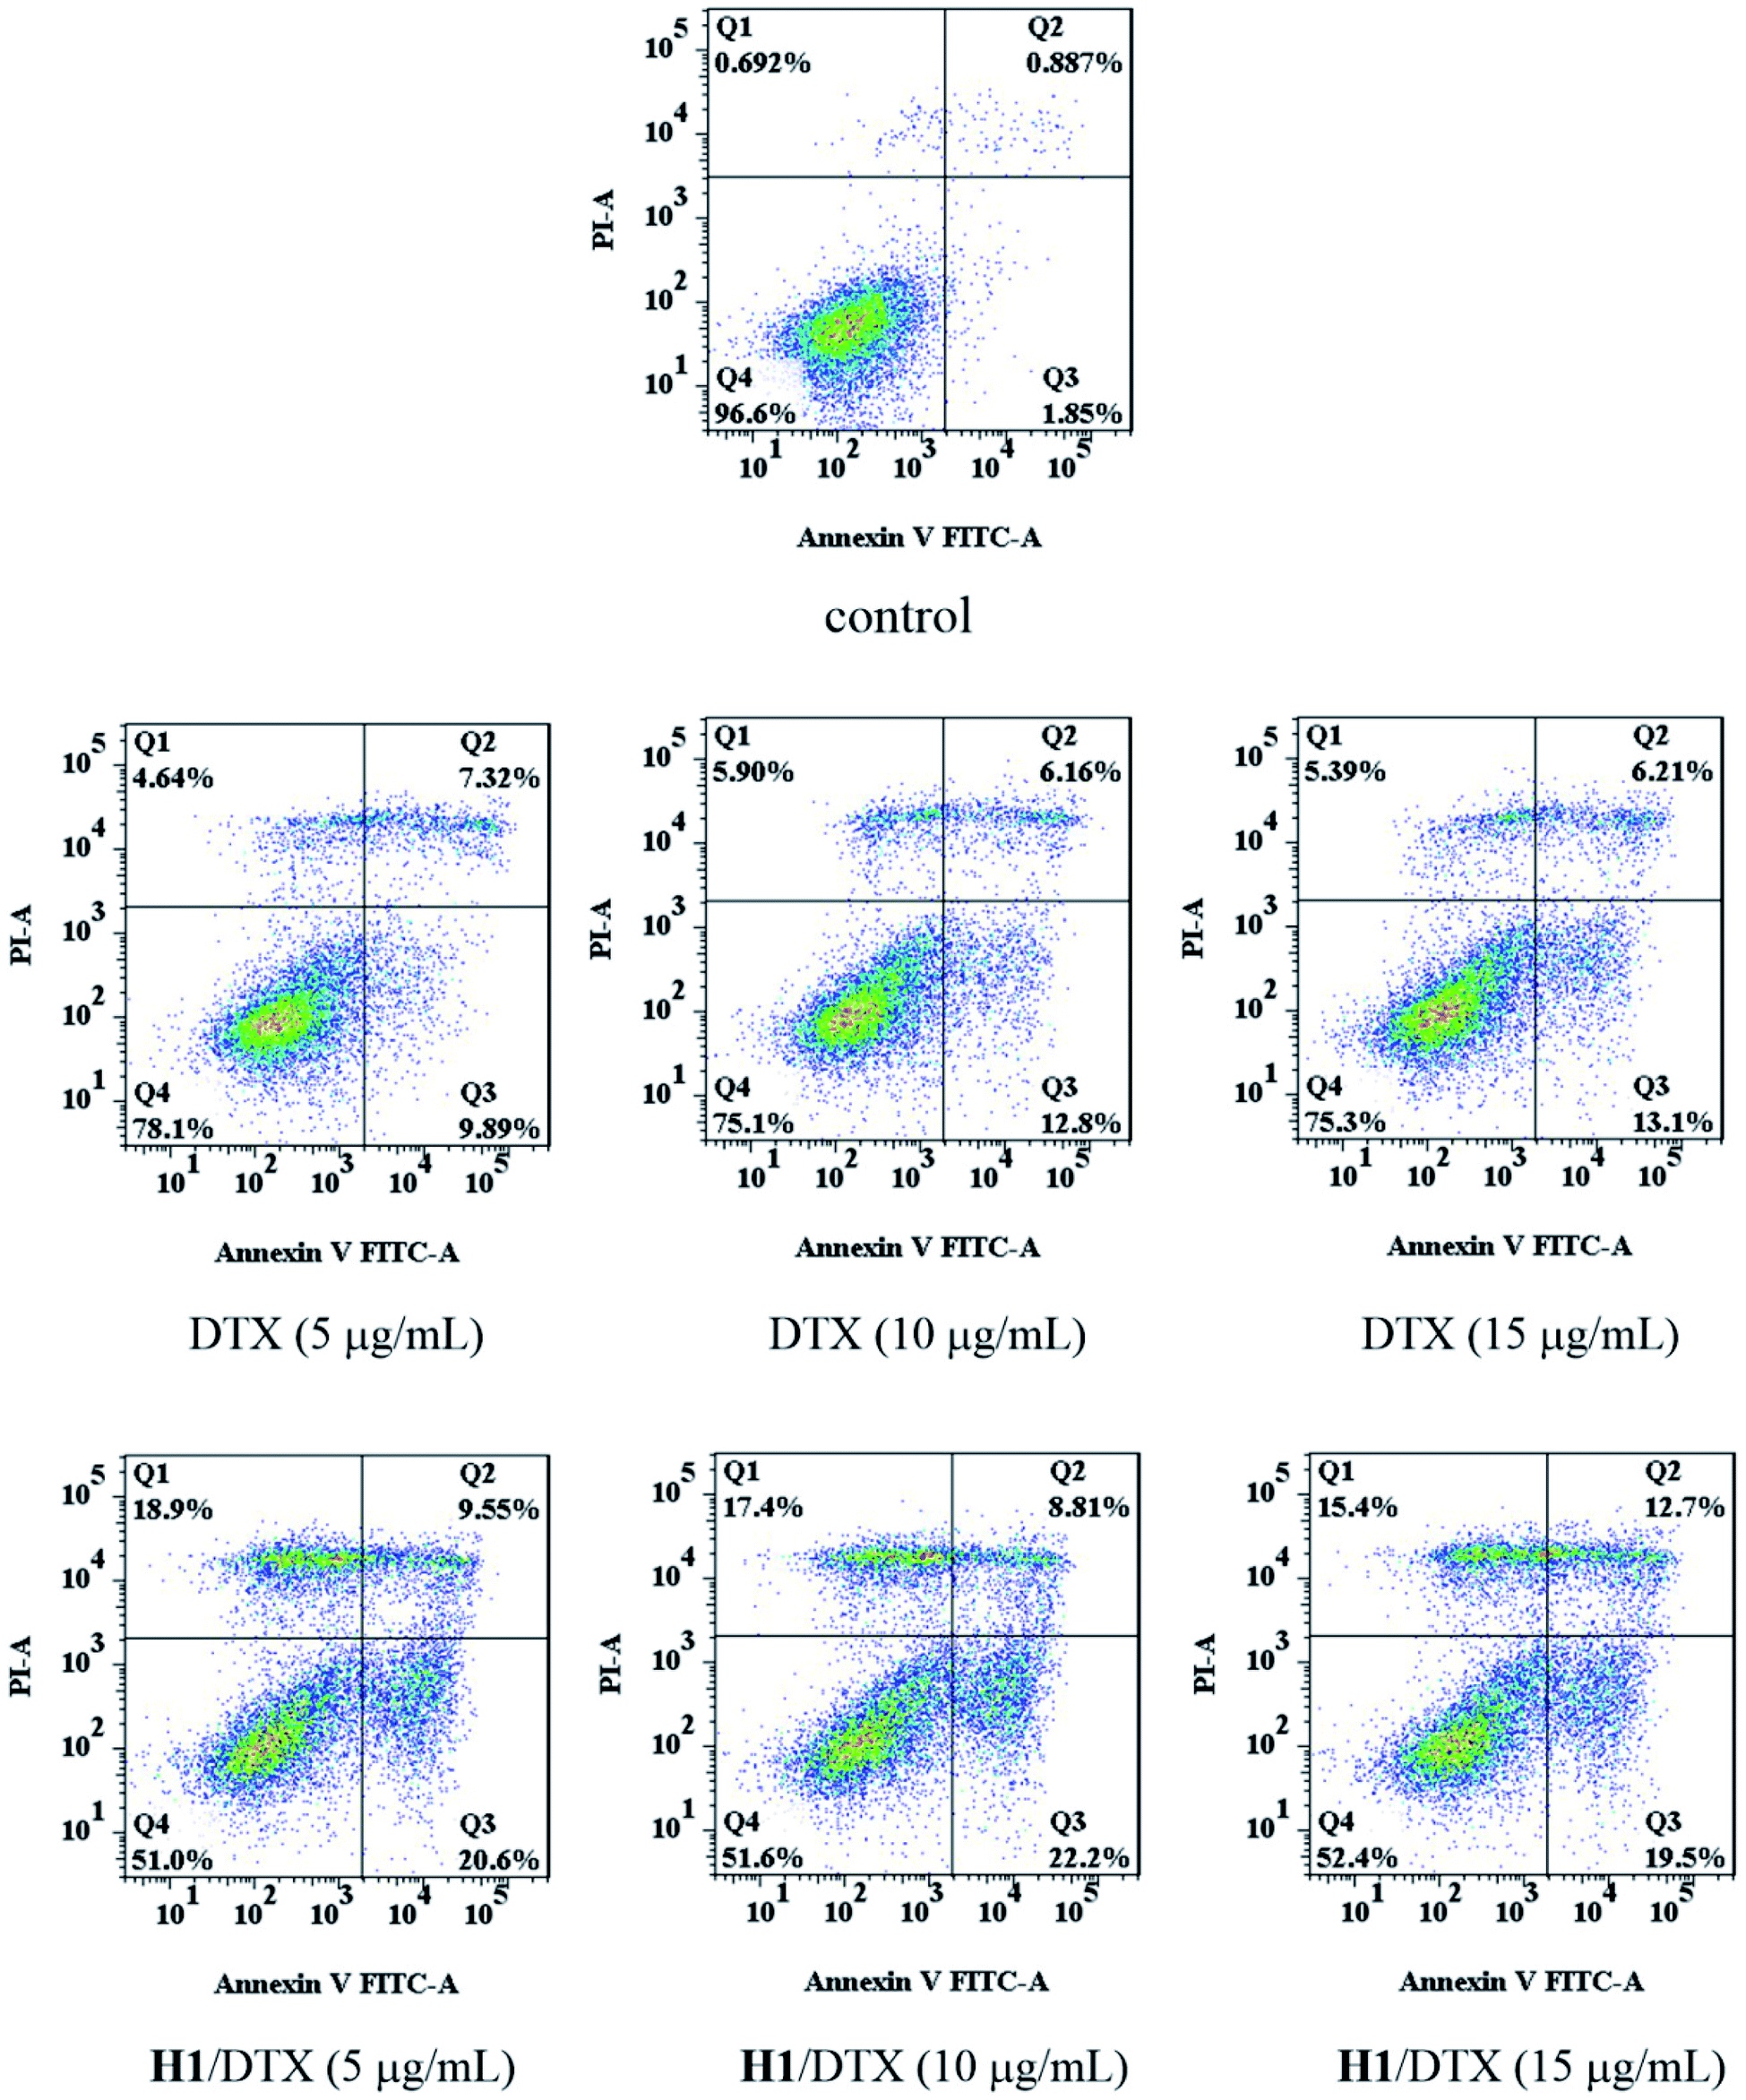
The apoptosis of MCF-7 cells was determined by Annexin V-FITC/PI assay after treatment with different concentrations of DTX and H1/DTX. As shown in Fig. 12, treatment of DTX increased the percentage of apoptotic cells from 2.7% (control) to 17.2% (5 μg mL−1), 19.0% (10 μg mL−1), and 19.3% (15 μg mL−1), respectively. Meanwhile, compared with the treatment of DTX, the H1/DTX inclusion complex significantly increased the cell apoptosis from 17.2% to 30.2% (5 μg mL−1), 19.0% to 31.0% (10 μg mL−1), and 19.3% to 32.2% (15 μg mL−1), respectively. The flow cytometry results indicated that the MCF-7 cells exposed to H1/DTX inclusion complex underwent dose-dependent apoptosis.
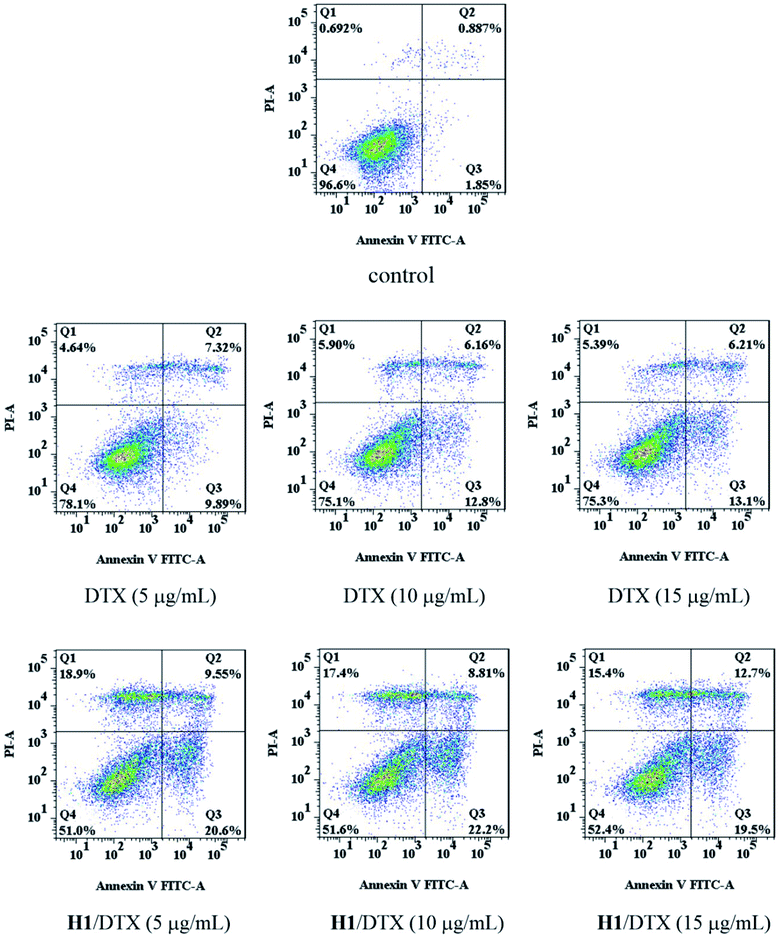 |
| | Fig. 12 Flow cytometric analysis of the apoptotic effect induced by various concentrations (5 μg mL−1, 10 μg mL−1, 15 μg mL−1) of DTX and H1/DTX on MCF-7 cells. Frames are divided into four quadrants: (Q1) necrosis cells, (Q2) late apoptotic cells, (Q3) early apoptotic cells, and (Q4) live cells. | |
4 Conclusions
In summary, this work reveals that the complexation with H1–3 is an effective strategy to prepare a novel DTX formulation with a higher water solubility, higher activity and lower toxicity, which is expected to contribute to its clinical application in cancer treatment.
Conflicts of interest
There are no conflicts to declare.
Acknowledgements
This work was supported by the National Natural Science Foundation of China (No. 21961046, No. 21362046 and No. 21062030) and YangFan Innovative & Entepreneurial Research Team Project (No. 201312S09), which are gratefully acknowledged.
References
- I. Takeuchi and K. Makino, Colloids Surf., B, 2019, 177, 356–361 CrossRef CAS.
- M. Ashrafizadeh, A. Zarrabi, F. Hashemi, E. R. Moghadam, F. Hashemi, M. Entezari, K. Hushmandi, R. Mohammadinejad and M. Najafi, Life Sci., 2020, 256 DOI:10.1016/j.lfs.2020.117984.
- J. H. Li, I. Mutanda, K. B. Wang, L. Yang, J. W. Wang and Y. Wang, Nat. Commun., 2019, 10, 4850 CrossRef.
- F. R. Gong, R. R. Wang, Z. Q. Zhu, J. Y. Duan, X. Teng and Z. K. Cui, Drug Delivery, 2020, 27, 238–247 CrossRef CAS.
- B. Lai, P. Q. Zhu, H. L. Li, L. Hu and J. W. Wang, Oncol. Lett., 2019, 18, 442–448 CAS.
- S. Ganta, A. Singh, Y. Rawal, J. Cacaccio, N. R. Patel, P. Kulkarni, C. F. Ferris, M. M. Amiji and T. P. Coleman, Drug Delivery, 2016, 23, 958–970 CrossRef CAS.
- M. Li, L. W. Zhao, T. Zhang, Y. Shu, Z. G. He, Y. Ma, D. Liu and Y. J. Wan, Acta Pharm. Sin. B, 2019, 9, 421–432 CrossRef.
- B. P. S. Belderbos, K. G. A. M. Hussaarts, L. J. van Harten, E. Oomen-de Hoop, P. de Bruijn, P. Hamberg, R. J. van Alphen, B. C. M. Haberkorn, M. P. Lolkema, R. de Wit, R. J. van Soest and R. H. J. Mathijssen, Br. J. Clin. Pharmacol., 2019, 85, 986–992 CrossRef CAS.
- T. T. Ye, W. Xu, T. Y. Shi, R. Yang, X. G. Yang, S. J. Wang and W. S. Pan, Asian J. Pharm. Sci., 2015, 10, 64–72 CrossRef.
- E. Ghassami, J. Varshosaz, A. Jahanian-Najafabadi, M. Minaiyan, P. Rajabi and E. Hayati, Int. J. Nanomed., 2018, 13, 493–504 CrossRef CAS.
- H. Y. Zhang, K. M. Wang, P. Zhang, W. X. He, A. X. Song and Y. X. Luan, Colloids Surf., B, 2016, 142, 89–97 CrossRef CAS.
- L. Zhang, Y. R. Shen and L. Y. Qiu, RSC Adv., 2017, 7, 26161–26169 RSC.
- C. H. Kim, T. H. Kang, B. D. Kim, T. H. Lee, H. Y. Yoon, Y. T. Goo, Y. S. Choi, M. J. Kang and Y. W. Choi, Int. J. Pharm., 2020, 583 DOI:10.1016/j.ijpharm.2020.119393.
- G. Crini, S. Fourmentin, É. Fenyvesi, G. Torri, M. Fourmentin and N. Morin-Crini, Environ. Chem. Lett., 2018, 16, 1361–1375 CrossRef CAS.
- B. R. Tian, Y. M. Liu and J. Y. Liu, Carbohydr. Polym., 2020, 251 DOI:10.1016/j.carbpol.2020.116871.
- H. G. Fu, Y. Chen, Q. L. Yu and Y. Liu, Chem. Commun., 2019, 55, 3148–3151 RSC.
- B. R. Tian, Y. M. Liu and J. Y. Liu, Carbohydr. Polym., 2020, 242 DOI:10.1016/j.carbpol.2020.116401.
- B. R. Tian, S. Y. Hua and J. Y. Liu, Carbohydr. Polym., 2020, 232 DOI:10.1016/j.carbpol.2019.115805.
- J. G. Cheng, H. J. Yu, Y. Chen and Y. Liu, Bioorg. Med. Chem., 2018, 26, 2287–2290 CrossRef CAS.
- M. Bragagni, M. Bozdag, F. Carta, A. Scozzafava, C. Lanzi, E. Masini, P. Mura and C. T. Supuran, Bioorg. Med. Chem., 2015, 23, 6223–6227 CrossRef CAS.
- I. S. Silva, E. L. Feitosa, M. E. P. Santos, R. M. Silva, M. S. Rocha, F. I. da Silva, F. C. A. Lima, A. M. S. Costa, P. B. Alves, S. A. A. de Sousa, A. P. Oliveira and S. G. de Lima, J. Braz. Chem. Soc., 2020, 31, 1064–1077 CAS.
- Q. Yao, M. T. Lin, Q. H. Lan, Z. W. Huang, Y. W. Zheng, X. Jiang, Y. D. Zhu, L. F. Kou, H. L. Xu and Y. Z. Zhao, Drug Delivery, 2020, 27, 54–65 CrossRef CAS.
- B. D. Lima, S. Shanmugam, J. D. S. Quintans, L. J. Quintans and A. A. D. Araujo, Phytochem. Rev., 2019, 18, 1337–1359 CrossRef CAS.
- K. Kaur, R. Jindal and D. Jindal, J. Mol. Liq., 2019, 282, 162–168 CrossRef CAS.
- Z. I. Yildiz, M. E. Kilic, E. Durgun and T. Uyar, J. Agric. Food Chem., 2019, 67, 11066–11076 CrossRef CAS.
- Z. J. Xu, Y. Zhang, Q. Hu, Q. Tang, J. K. Xu, J. P. Wu, T. B. Kirk, D. Ma and W. Xue, Mater. Sci. Eng., C, 2017, 71, 965–972 CrossRef CAS.
- J. Tao, J. J. Xu, F. C. Chen, B. H. Xu, J. Q. Gao and Y. Hu, Eur. J. Pharm. Sci., 2018, 111, 540–548 CrossRef CAS.
- L. L. Ren, X. L. Yang, W. L. Guo, J. Wang and G. G. Chen, Polymers, 2020, 12 DOI:10.3390/polym12102336.
- S. Mazzaferro, K. Bouchemal, J. F. Gallard, B. I. Iorga, M. Cheron, C. Gueutin, C. Steinmesse and G. Ponchel, Int. J. Pharm., 2011, 461, 171–180 CrossRef.
- J. G. Cheng, Y. M. Zhang and Y. Liu, ChemNanoMat, 2018, 4, 758–763 CrossRef CAS.
- S. L. Yang, L. J. Zhao, S. M. Chi, J. J. Du, Q. Ruan, P. L. Xiao and Y. Zhao, J. Mol. Struct., 2019, 1183, 118–125 CrossRef CAS.
- R. C. Petter, J. S. Salek, C. T. Sikorski, G. Kumaravel and F. T. Lin, J. Am. Chem. Soc., 1990, 112, 3860–3868 CrossRef CAS.
- H. W. Yang, Z. J. Pan, W. Jin, L. J. Zhao, P. Xie, S. M. Chi, Z. Lei, H. Y. Zhu and Y. Zhao, J. Inclusion Phenom. Macrocyclic Chem., 2019, 95, 147–157 CrossRef CAS.
- K. Kaur, R. Jindal and D. Jindal, J. Mol. Liq., 2019, 282, 162–168 CrossRef CAS.
- A. Abd El-Gawad, O. A. Soliman, M. S. El-Dahan and S. A. S. Al-Zuhairy, AAPS PharmSciTech, 2017, 18, 1795–1809 CrossRef CAS.
- L. J. Zhao, S. L. Yang, W. Jin, H. W. Yang, F. Y. Li, S. M. Chi, H. Y. Zhu, Z. Lei and Y. Zhao, Aust. J. Chem., 2019, 72, 440–449 CrossRef CAS.
- A. Lodagekar, R. M. Borkar, S. Thatikonda, R. B. Chavan, V. G. M. Naidu, N. R. Shastri, R. Srinivas and N. Chella, Carbohydr. Polym., 2019, 212, 252–259 CrossRef CAS.
- J. P. Chen, X. M. Qin, S. Y. Zhong, S. H. Chen, W. M. Su and Y. Liu, Molecules, 2020, 23 DOI:10.3390/molecules23051179.
- S. Gao, Y. Y. Liu, J. Y. Jiang, Q. Y. Ji, Y. Fu, L. X. Zhao, C. Y. Li and F. Ye, J. Mol. Liq., 2020, 293 DOI:10.1016/j.molliq.2019.111513.
- S. Amiri and B. Nalbandi, J. Inorg. Organomet. Polym. Mater., 2018, 28, 1764–1774 CrossRef CAS.
- N. Qiu, X. Cheng, G. C. Wang, W. W. Wang, J. L. Wen, Y. K. Zhang, H. Song, L. Ma, Y. Q. Wei, A. H. Peng and L. J. Chen, Carbohydr. Polym., 2014, 101, 623–630 CrossRef CAS.
|
| This journal is © The Royal Society of Chemistry 2021 |
Click here to see how this site uses Cookies. View our privacy policy here. 
 Open Access Article
 This Open Access Article is licensed under a Creative Commons Attribution-Non Commercial 3.0 Unported Licence
 *a
*a