 Open Access Article
Surface plasmon-driven photocatalytic activity of Ni@NiO/NiCO3 core–shell nanostructures
Parisa Talebia,
Harishchandra Singh*a,
Ekta Rani a,
Marko Huttulaab and
Wei Cao
 a
a
aNano and Molecular Systems Research Unit, University of Oulu, FIN-90014, Finland. E-mail: Harishchandra.Singh@oulu.fi
bSchool of Materials Science and Engineering, Henan University of Science and Technology, Luoyang 471023, Henan, China
First published on 13th January 2021
Abstract
Ni@NiO/NiCO3 core–shell nanostructures have been investigated for surface plasmon driven photocatalytic solar H2 generation without any co-catalyst. Huge variation in the photocatalytic activity has been observed in the pristine vs. post-vacuum annealed samples with the maximum H2 yield (∼110 μmol g−1 h−1) for the vacuum annealed sample (N70-100/2 h) compared to ∼92 μmol g−1 h−1 for the pristine (N70) photocatalyst. Thorough structural (X-ray diffraction) and spectroscopic (X-ray photoelectron spectroscopy and transmission electron microscopy coupled electron energy loss spectroscopy) investigations reveal the core Ni nanoparticle decorated with the shell, a composite of crystalline NiO and amorphous NiCO3. Significant visible light absorption at ∼475 nm in the UV-vis region along with the absence of a peak/edge corresponding to NiO suggest the role of surface plasmons in the observed catalytic activity. As per the proposed mechanism, amorphous NiCO3 in the shell has been suggested to serve as the dielectric medium/interface, which enhances the surface plasmon resonance and boosts the HER activity.
1. Introduction
Over the past decade, renewable energy has particularly received researchers' attention due to the limited supply of fossil fuels along with their negative impact on the environment such as escalating pollution and global warming.1–4 Among the various available alternatives, one of the most promising fuel options is hydrogen, owing to its high energy capacity and environmental friendly nature. However, conventional hydrogen production methods produce large amounts of carbon dioxide5 and thus are not suitable for the environment. The alternative production route, such as, hydrogen production via water splitting by employing photocatalysts and sunlight, has been emphasized. This safe and low-cost process has been considered as one of the most promising routes to sustain the amount of energy required by humans in daily life.6,7 With the aim to develop highly efficient and stable photocatalysts, various metal oxides,8,9 metal chalcogenides,10 and metal-free photocatalysts11,12 have widely been studied for photocatalysis. However, even after the intensive efforts throughout the world, this energy source remains a mirage due to the less efficient H2 evolution reaction (HER), which necessitates continual work in this field.13It is well known that the morphology of the homogenous or heterogenous catalysts affect the overall photocatalytic activity.14,15 For example, the core–shell structure of the heterogenous nanocomposites that consists of an inner core material surrounded by a shell material, with different structural and/or compositional features and dimensions at the nano-scale have attracted remarkable attention and become a significant research area in the field of nanotechnology.16,17 This structure has led to the enhancement of light absorption, surface plasmon resonance enabled electron transfer,18–20 and separation of photo-generated charges through the integration of suitable materials and interface, which increases the overall performance.21 A combinative aspect of such nanostructures to improve the catalytic activity is through hot carrier injection via surface plasmon resonance (SPR). SPR can create an electromagnetic field, improving photoreaction in three ways: photon scattering, plasmon resonance energy transfer, and hot electron excitation. One crucial ambiguity is still found in the literature, that is the direction of electron flow from metal nanoparticle to semiconductor or vice versa?
While photocatalyst developments have been emphasized mainly on lab-based synthetic materials, modifications of commercially available but manufactured pristine reagents are overlooked. In fact, employing these variants in photocatalysis is supported by the industrial readiness of material supply, and may accelerate large-scaled practical photocatalytic HER that gets out-of-lab.22 Neverthless, several transition metals such as, Fe, Co, Ni, Mo have been widely used for photocatalytic activities due to their low-cost and abundance in the earth.23,24 Nickel is a first-row transition element and typically used for various applications, including coins, catalysts, and batteries.25,26 However, Ni metal has not been found ideal for HER due to its high overpotential and large Tafel slope.27,28 Thus, more efforts have been undertaken to optimize the chemical structures and morphology of Ni-based heterogeneous catalysts, which offer promising HER catalytic activity for an efficient water splitting.29,30 Nickel oxide (NiO), on the other hand, with an optical band gap (Eg) in the range of 3.5–4 eV,31 acts as a p-type semiconductor,32 and has also been employed for various applications, including gas sensors,33 electrochromic films,34 electrochemical catalyst,35 battery cathodes,36 and magnetic materials.37 A latest research work showed that there are a large number of defective states in NiO which could accelerate the dissociation of water by weakening the H–O bond in H2O.38 Another work realized that NiO can effectively reduce the overpotential of electrocatalytic hydrogen evolution.39 Moreover, another variant of Ni i.e., NiCO3 has been found crucial in a few applications including photocatalysis and hydrogenation, however, the dimension/phase variable role of NiCO3 is still a major concern.40,41
In this work, we have employed as received pristine Ni@NiO/NiCO3 core shell nanostructure and its post-annealing variants to study the underlying and improved HER activities under white light and visible light illuminations. Furthermore, the effect of vacuum annealing time and temperature in a typical thermal treatment has been optimized to significantly enhance the overall HER activity. Thorough investigation using X-ray diffraction (XRD), X-ray photoelectron spectroscopy (XPS), transmission electron microscopy (TEM), electron energy loss spectroscopy (EELS) and UV-vis absorption spectroscopic reveal that the observed HER activity has been found to be driven by the SPR effect.
2. Experimental
2.1. Material
A commercially available Ni nano powder from Hongwu International Group Ltd (HWNANO) was selected for this study. The chosen nickel nano powder A095 (CAS no. 7440-02-0) was mentioned to have a nominal purity of 99.8% and an average diameter ∼70 nm.42 Due to natural oxidation process of metallic nanoparticle, these Ni nano powders were found to show a complex core–shell structure (i.e. Ni@NiO/NiCO3) and a significant photocatalysis effect. To improve and optimize the HER performance, several post-vacuum annealing thermal treatment were investigated on the received Ni nano powder. They were separately annealed under low (600 mbar) vacuum condition at 100 °C for 2 h and 6 h and at 200 °C for 2 h in a vacuum furnace to optimize the photocatalytic performance. The corresponding samples were labeled as N70 (pristine), N70-100/2 h, N70-100/6 h and N70-200/2 h.2.2. Characterization
Field emission scanning electron microscope (FESEM) images were taken using a Zeiss Ultra plus FESEM. Optical spectroscopies were carried out using Shimadzu UV-2600 spectrophotometer. XRD patterns were recorded by Rigaku Smart Lab equipped with five-axis θ–θ goniometer and 1D solid-state detector and scintillator using Co-Kα (λ = 1.79 Å, 40 kV, 135 mA) radiation. XPS were carried out with Al Kα using Thermo Fisher Scientific ESCALAB 250Xi XPS System. TEM images coupled with EELS and energy dispersive spectroscopy (EDS) mapping were performed using JEOL JEM-2200FS EFTEM/STEM.2.3. Photocatalytic HER measurements
The photocatalytic H2 evolution activities of the pristine and post-treated samples i.e. N70, N70-100/2 h, N70-100/6 h and N70-200/2 h were carried out in a quartz bottle with height ∼ 90 mm, diameter ∼ 35 mm and total volume ∼68 mL. In a typical run, 5 mg of the selected catalyst was suspended in 25 mL of deionized (DI) water. As irradiation source, LED light sources equipped with a magnetic stirrer in the Perfect Light PCX50B photo reactor were used. Prior to the irradiation, the solution was dispersed in the ultrasonic bath for two minutes. The prepared solution was exposed to light for 2 h at room temperature. The produced gas quantity analysis was carried out by Agilent Micro 490 GC gas chromatograph (GC) equipped with a H2 sensitive column. All measurements were performed with pristine and its post-annealing variants. No other co-catalysts or hole scavenger was used in the experiment.3. Results
3.1. Microstructure and morphology
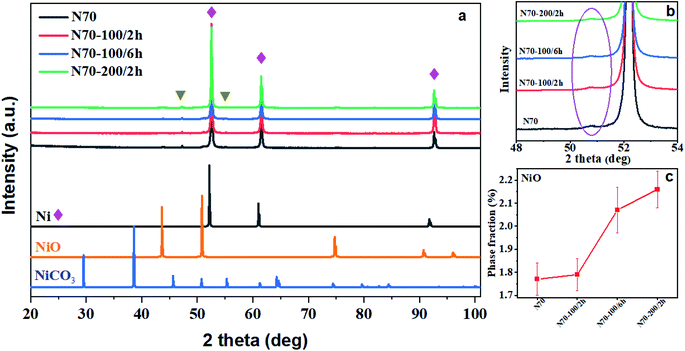
Fig. 1 shows the XRD patterns for all samples assigned as N70, N70-100/2 h, N70-100/6 h and N70-200/2 h. The observed intense peaks at 2θ = 52.16°, 61.16° and 91.7° can be attributed to the (1 1 1), (2 0 0), and (2 2 0) diffraction planes of the Ni (ICDD # 04-002-9123). Further, the minor peaks at 43.7° (1 0 1) and 50.9° (1 1 0) can be assigned to NiO (ICDD # 04-007-9781). It is noted that no additional diffraction peaks corresponding to a crystalline phase has been observed. The intensity of peak at 50.90° corresponding to NiO has been found to increase with vacuum annealing temperature and time. The increasing trend and amount of the same can also be seen in Fig. 1b and c. The phase fraction of NiO is found to increase from 1.77% for N70 to 2.1% for N70-100/6 h.Fig. 2 shows representative FESEM images for N70, N70-100/6 h and N70-200/2 h. As evident, N70 sample shows more separated nanoparticle morphology (Fig. 2a) while the others show more coagulation structures as a results of vacuum annealing treatment (Fig. 2b and c). The image of smallest structure unit in these sample is also illustrated in the inset of these figures. As shown, they consist of a small spherical nanoparticle attached with comparatively a bigger nanoparticle. Based on the histogram displayed in Fig. 2d for N-70 sample, the typical diameter of these nanoparticles ranges from 60 to 200 nm which an average size of 70 nm. The diameter of the small spherical nanoparticles ranges from 20 to 80 nm.
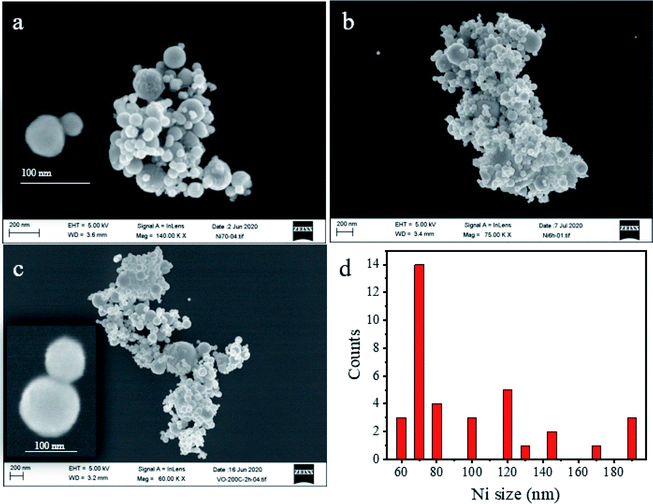 | ||
| Fig. 2 Representative FE-SEM images of (a) N70, (b) N70-100/6 h, (c) N70-200/2 h, and (d) histogram of Ni nanoparticle size distribution in N70 (a). | ||
3.2. Chemical composition of the core–shell nanostructure
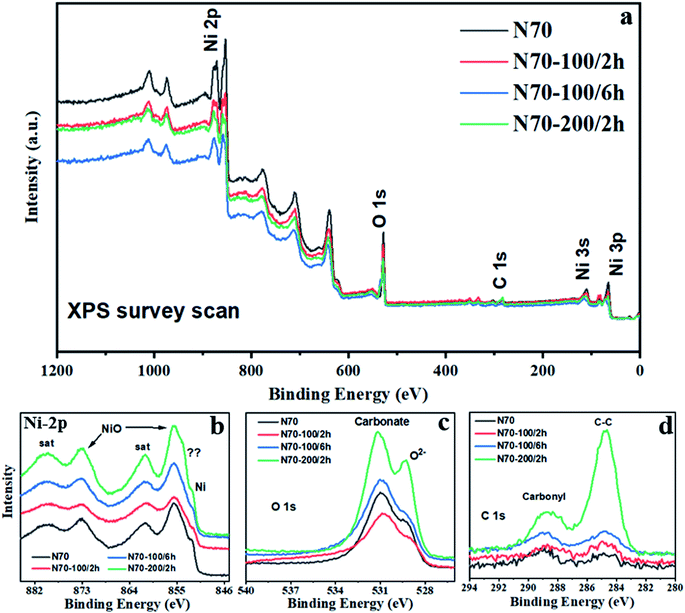
Fig. 3 shows the XPS spectra for the pristine and annealed samples i.e. N70, N70-100/2 h, N70-100/6 h and N70-200/2 h. All the measured XPS spectra are calibrated with the C 1s peak to 284.8 eV for the careful data analysis. In the XPS survey spectrum (Fig. 3a), signals corresponding to Ni 2p/3p-, C 1s- and O 1s-core level have been observed significantly. Except Au, which was used as a sample holder of the XPS measurements, there are no peaks related to the any other elements. As shown in Fig. 3b, the main peak appearing at the binding energy (BE) ∼ 852 corresponds to the Ni.43,44 The peaks with BE ∼ 855 eV and ∼873 eV in the Ni 2p region are allocated to Ni 2p3/2 and Ni 2p1/2, indicating the existence of the NiO.42,44 Two corresponding shakeup satellites with BE ∼860 eV and ∼880 eV (named as “Sat.”) are also observed.These observations are consistent with the XRD results, which indicate the presence of crystalline Ni and NiO phases. A very close look at the data also reveals an additional feature possibly of NiCO3![[thin space (1/6-em)]](https://www.rsc.org/images/entities/char_2009.gif) 45 that will be discussed later in this section. However, XRD patterns do not show the presence of crystalline NiCO3, indicating possibly an amorphous nature of this sample if any. In the O 1s core level region (Fig. 3c), the peaks with BE ∼ 529 eV and ∼531 eV are attributed to the metal oxide and carbonate,46 respectively. In line with the literature, the peaks above 532 eV are the characteristic of the H2O and hydroxyl groups adsorbed on the surface of the probed sample. Fig. 3d shows the peaks at ∼284.8 eV and ∼288.7 eV located in the C 1s region belongs to C–C chemical state and carbonyl group,46 respectively. Moreover, the intensity of NiO in the XPS spectrum is much higher than the intensity of Ni, while XRD data show the opposite trend. Similar nature of trend in XPS intensity is also observed for NiCO3 vs. Ni. This is because XPS is the surface sensitive technique with a typical depth probe of approximately 5–10 nm.47 Together with morphology visuals from FESEM, the XPS results suggest that Ni appears to be surrounded with NiO and or NiCO3. Therefore, a possible structure for these photocatalysts could be a core (Ni)–shell (NiO and or NiCO3) type nanostructure, will be covered through TEM later.
45 that will be discussed later in this section. However, XRD patterns do not show the presence of crystalline NiCO3, indicating possibly an amorphous nature of this sample if any. In the O 1s core level region (Fig. 3c), the peaks with BE ∼ 529 eV and ∼531 eV are attributed to the metal oxide and carbonate,46 respectively. In line with the literature, the peaks above 532 eV are the characteristic of the H2O and hydroxyl groups adsorbed on the surface of the probed sample. Fig. 3d shows the peaks at ∼284.8 eV and ∼288.7 eV located in the C 1s region belongs to C–C chemical state and carbonyl group,46 respectively. Moreover, the intensity of NiO in the XPS spectrum is much higher than the intensity of Ni, while XRD data show the opposite trend. Similar nature of trend in XPS intensity is also observed for NiCO3 vs. Ni. This is because XPS is the surface sensitive technique with a typical depth probe of approximately 5–10 nm.47 Together with morphology visuals from FESEM, the XPS results suggest that Ni appears to be surrounded with NiO and or NiCO3. Therefore, a possible structure for these photocatalysts could be a core (Ni)–shell (NiO and or NiCO3) type nanostructure, will be covered through TEM later.
For more detailed examination about the amount and compositional structure, XPS fitting has been carried out with Avantage software. The associated XPS fitting results corresponding to Ni 2p-, C 1s- and O 1s-core levels are shown in Fig. 4 and Table 1. For all the samples, the atomic% of Ni corresponding to NiO increases with vacuum annealing treatment, which is also in line with XRD-phase fraction results (Fig. 1c). The atomic% of Ni corresponding to NiCO3 shows a parabolic trend with a maximum value for N70-100/2 h sample. The same for Ni nanoparticle shows irregular behavior because of the fact that XPS is mainly sensitive to few atomic surface layers.47 This may also suggest that the contribution of NiCO3 is maximum for that particular depth of XPS probe. The fitted numbers shown in Table 1 also match with the trend observed in Fig. 4 (see C 1s and O 1s XPS data for more clarity).
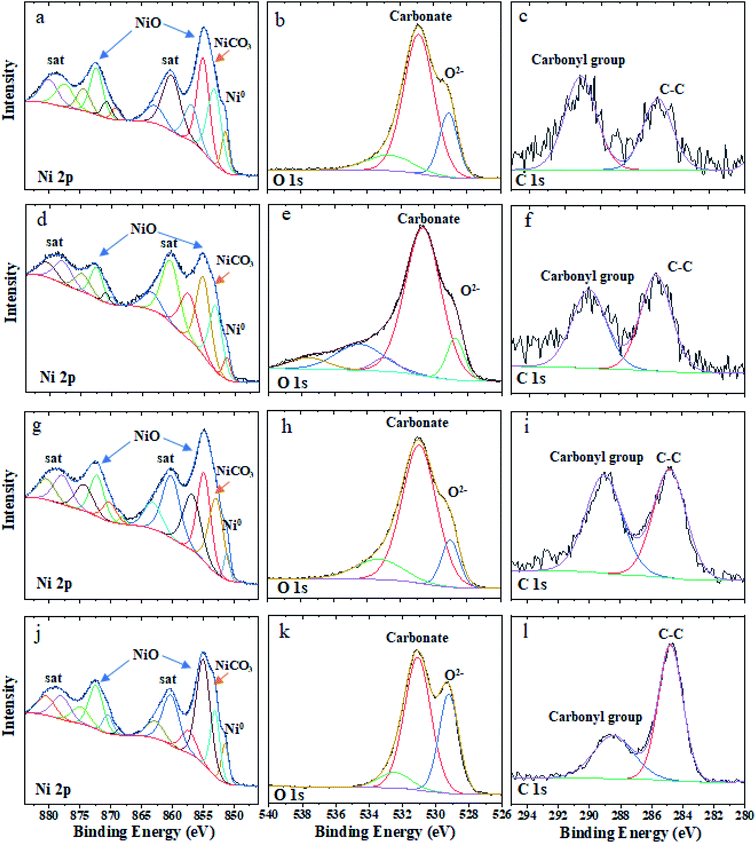 | ||
| Fig. 4 High-resolution fitted XPS spectra of Ni 2p, O 1s, and C 1s for N70 (a–c), N70-100/2 h (d–f), N70-100/6 h (g–i), and N70-200/2 h (j–l). | ||
| Samples | Ni | NiO | NiCO3 | |||
|---|---|---|---|---|---|---|
| BE (eV) | At% | BE (eV) | At% | BE (eV) | At% | |
| N70 | 851.5 | 11.88 | 855 | 46.56 | 853.3 | 41.53 |
| N70-100/2 h | 851.3 | 2.42 | 855.5 | 52.87 | 853.3 | 44.71 |
| N70-100/6 h | 851.1 | 5.25 | 854.9 | 64.83 | 853 | 29.92 |
| N70-200/2 h | 851.5 | 11.08 | 855 | 74.23 | 853.1 | 14.69 |
Based on XPS analysis, three components (i.e. Ni, NiO and NiCO3) have been observed for all the samples while XRD data do not show crystalline NiCO3. Despite a possible core–shell type nanostructure, the exact structure of the sample is unknown from XPS. The nickel content has been found to be almost constant, however, NiO and NiCO3 show changes in their fraction and crystallization. The difference in the intensity of the peaks for Ni 2p, O 1s and C 1s core levels are also visible for different samples. This requires TEM, EELS and EDS mapping measurements at local nanometer scale for more exact structure of these samples.
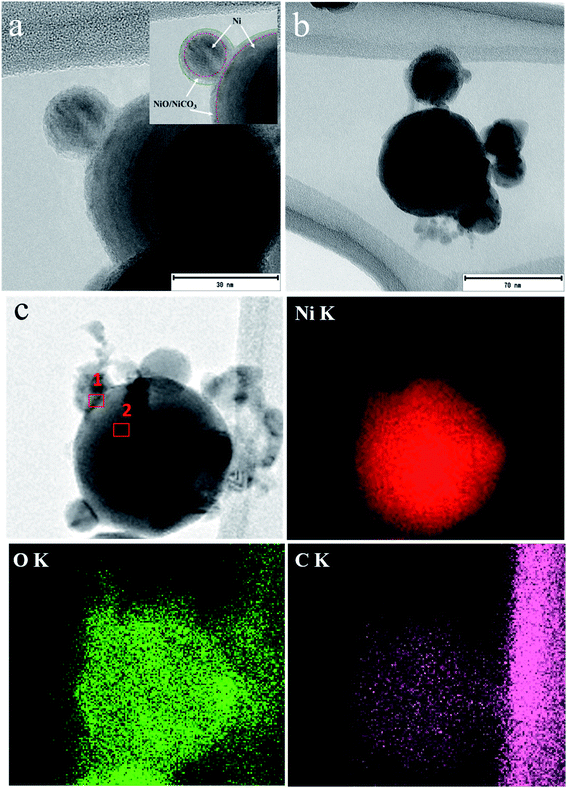
3.3. TEM-EELS
To understand the morphological structure further, TEM, HR-TEM and SAED-TEM images are taken for a few representative (N70 and N70-100/2 h) samples and displayed in Fig. 5. TEM images (Fig. 5a and b) show the overall morphology of the samples as spherical, which also agrees with the FESEM results (Fig. 2).To know more about the elemental distribution, EDS mapping of N70 is shown in Fig. 5c, which provides a confirmation of Ni, O and C elements. The mapping images demonstrate the homogeneous distribution of Ni, O and C elements throughout the selected region with the maximum Ni at the center of the nanoparticle. As tabulated in Table 2, atomic percentages of Ni, O and C are 66.52, 25.09 and 8.39 for the selected region one and 87.19, 9.45 and 3.36 for region two. The amount of O and C at the edge region is more than that at the center. This confirms the shell structure of NiO/NiCO3 over a core of Ni.
| Element | (keV) | Sigma | Mass% | Atom% | K | ||
|---|---|---|---|---|---|---|---|
| Region 1 | Region 2 | Region 1 | Region 2 | ||||
| C K | 0.277 | 0.13 | 2.29 | 0.76 | 8.39 | 3.36 | 2.4010 |
| O K | 0.525 | 0.44 | 9.11 | 2.85 | 25.09 | 9.45 | 1.0177 |
| Ni K | 7.471 | 1.60 | 88.60 | 96.39 | 66.52 | 87.19 | 1.0000 |
| Total | 100.00 | 100.00 | 100.00 | 100.00 | |||
The HR-TEM image (Fig. 6) further reveals that the Ni nanoparticles are intimately surrounded by the shell, which probably have the structure of crystalline NiO and or amorphous NiCO3. This is also confirmed through the observed lattice spacing of 0.203 nm corresponding to the (111) plane of Ni (Fig. 6a). The other lattice spacing of 0.208 nm and 0.241 nm corresponding to the (012) and (101) of NiO, respectively, are shown from the surface of Ni and in between the two selected nanoparticles. As also demonstrated in the inset of Fig. 6a, an amorphous morphological structure can be seen, which has been attributed to NiCO3 in line with XPS and XRD results. To further investigate the crystalline nature of the sample, the selected area electron diffraction (SAED) pattern is shown in the Fig. 6b. The labels from the lower position to the upper positions are NiO (101), Ni (111), Ni (200), NiO (110) and Ni (220), respectively, showing their crystalline nature, the result also matches with XRD data. It is also worth to mention here that there is no reflection corresponding to NiCO3 which refers its amorphous nature, a result that agrees with XRD data. Moreover, the typical shell structure of the studied sample has a thickness about 3–5 nm, as per the HR-TEM results.
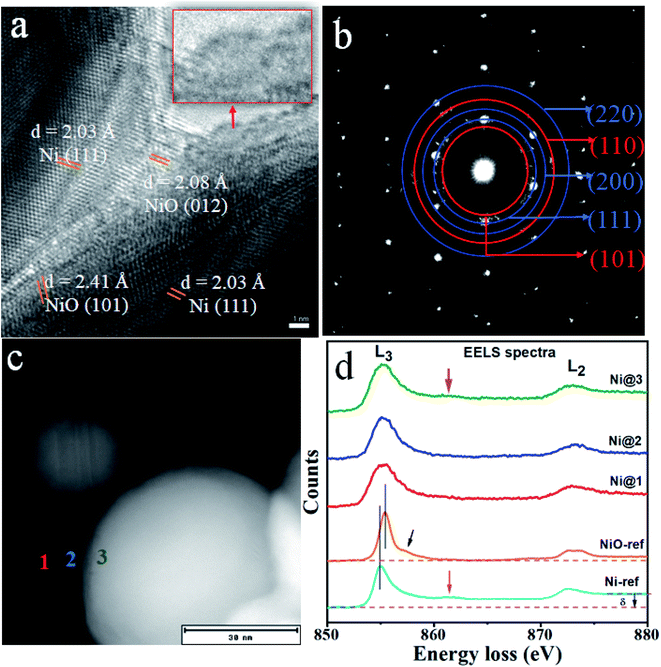 | ||
| Fig. 6 (a) HR-TEM image with d-spacing and (b) TEM-SEAD patterns for N70 (blue: Ni, red: NiO), (c) STEM image and (d) corresponding EELS spectra at three selected positions. | ||
Moreover, to confirm the spectroscopic nature of Ni in different phases/components, we have carried out EELS measurement on the pristine sample (i.e. N70). Fig. 6c and d shows STEM image and the corresponding EELS spectra for Ni L2,3 edge at the selected region, along with the reference EELS spectra for Ni and NiO. All the EELS spectra show similar nature of L2,3 features, a result of spin orbit splitting, in relation to the standard reference EELS spectra of Ni and NiO. As the fingerprint, Ni reference spectrum shows a significant level difference between the pre-peak ∼ 855 eV (L3 edge) and post second peak edge ∼ 872 eV (L2 edge), also represented as δ, which is absent in the case of NiO.48 Moreover, Ni spectrum shows a weak satellite peak ∼ 862 eV, typically a spectroscopic fingerprint for Ni0 state, which is also absent for NiO. On the other hand, NiO shows double peak structure at the L2 edge and also a weak shoulder peak close to L3 edge.
As can be seen in the Fig. 6d, Ni@1 and Ni@3 (red and green) spectra primarily belong to Ni and Ni@2 (blue) spectrum demonstrates mainly the signature of Ni2+. Since NiO and NiCO3 both exhibit Ni2+ and Ni nanoparticle as Ni0, most of the measured EELS spectra might be a superposition of Ni0 and Ni2+. However, the current EELS analysis confirms the core–shell structure of studied sample which has a core of Ni and possibly a composite of crystalline NiO and amorphous NiCO3, which also corroborates with the other results discussed above.
3.4. UV-vis spectroscopy
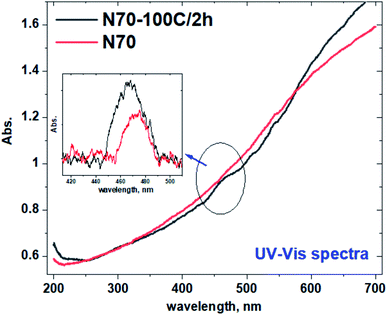
Fig. 7 shows the representative UV-vis absorbance spectra for the pristine (N70) and N70-100C/2 h samples. It is important to note that investigated samples have nanoparticles with different sizes which might results in multiple peaks corresponding to the size dependent SPR altogether giving an edge in the associated UV-vis spectra.49,50 A broad peak at ∼475 nm is observed after a careful background subtraction in the visible region for both the sample, however, N70-100C/2 h sample shows dominant feature at 475 nm. This is also shown in the inset of Fig. 7. It is also important to note that no significant absorption peak/edge has been observed corresponding to NiO band gap (310–355 nm i.e., 3.5–4 eV).313.5. Photocatalytic hydrogen evolution
Fig. 8a shows the measured water splitting experiment results for all the samples (N70, N70-100/2 h, N70-100/6 h and N70-200/2 h) under white light illumination. For the photocatalytic H2 evolution reaction (HER), these samples were dispersed in the DI water and the photocatalytic performance was recorded and analyzed. All the measured samples show significant H2 production, wherein, N70-100/2 h shows the highest performance and N70-200/2 h shows the least. For the white light, the pristine N70 sample shows ∼41 μmol g−1 h−1 hydrogen evolution rate. The hydrogen evolution rate of N70 is significantly improved by vacuum annealing treatment and the highest amount of H2 production for N70-100/2 h has been noted to be as ∼80 μmol g−1 h−1 which is two folds higher than the pristine sample (N70). Based on the white light water splitting experiment, we have selected these two samples for more detailed experiment in the visible to UV region. Fig. 8b shows the H2 production rate of N70 and N70-100/2 h in the light range of 365 nm to 630 nm. As can be seen from the Fig. 8b, at the excitation wavelength of 485 nm, the observed HER performance for N70-100/2 h (∼110 μmol g−1 h−1) is much higher than that of N70 (∼92 μmol g−1 h−1).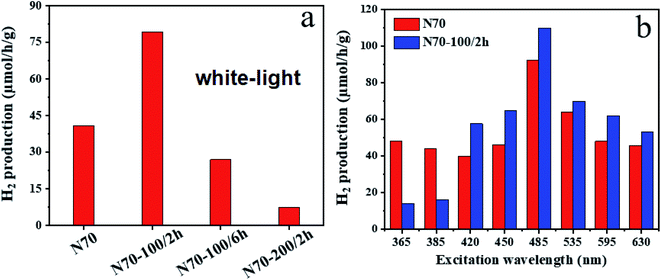 | ||
| Fig. 8 H2 yield for different samples using (a) white light and (b) various excitations in the range of 365 to 630 nm. | ||
3.6. HER mechanism
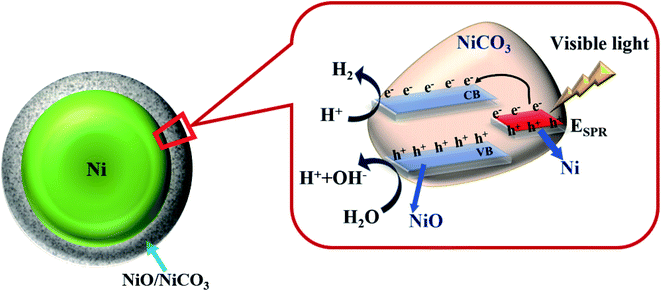
As per the UV-vis and HER results, we notice a broad peak structure at 475 nm and a maximum H2 production at 485 nm. Furthermore, no absorption peak corresponding to NiO (3.5–4 eV/310–355 nm) is observed, which indicates that the source with energy of 2.5 eV cannot excite electrons from NiO which has a band gap of around 3.5 eV to create electron and hole for HER reaction. This clearly indicates the only possible explanation for the observed HER activity is to incorporate the SPR effect of Ni nanoparticle. Incident light causes SPR effect on Ni surface, which leads to generation of hot electrons. These electrons can then accumulate at the conduction band of surface NiO, a probable active site for HER. Furthermore, since SPR requires the dielectric medium/interface, the present amorphous NiCO3 might be helping to boost the surface plasmon of Ni (as evidenced by UV-vis spectrum)51 for the efficient HER reaction. Fig. 9 displays the schematic of underlying photocatalytic H2 evolution mechanism of Ni@NiO/NiCO3 under visible light illumination. SPR electrons are created from Ni nanoparticles, followed by the transfer of these hot electrons to the surface of NiO, which is mainly responsible for the catalysis which can dissociate adsorbed water molecules and absorb hydroxyl radicals from the decomposition of water.16 Since the photocatalytic process occurs only at the surface, for the core–shell structure, the surface NiO is contacted with water as the Ni metal surface is covered by the oxide shell. The holes (h+) oxidize H2O and produce H+ followed by the reduction of H+ by the electron (e−) collected at the conduction band (CB) of the shell to produce H2. The plausible mechanism therefore is proposed as below:| Ni + hν → SPR |
| H2O + h+ → OH− + H+ |
| 2H+ + 2e− (SPR) → H2 |
| OH− + h+ → H+ + O2 |
Apart from enhancing the SPR effect of Ni nanoparticles, previous reports suggest that the carbonates also influence the photocatalytic activity, however, the role of these carbonates is still under debate.52,53 In particular, the redox potential of the CO3˙−/CO32− (1.57 V vs. normal hydrogen electrode (NHE)) and (CO3˙− + H+)/HCO3− couples is lower than that of the OH˙/OH− and (OH˙ + H+)/H2O couples. Therefore, HCO3− and CO32− can be used in water oxidation processes, the confirmation of which requires more advanced (in situ/operando) studies.13 Based on the XPS results, the ratio of NiCO3/NiO for pristine sample is lower than that of N70-100/2 h. Thus, the sample N70-100/2 h has the highest amount of amorphous NiCO3 and shows the highest H2 generation.
4. Conclusion
As received Ni@NiO/NiCO3 and post-vacuum annealed core–shell catalyst structures have been investigated for solar H2 generation under white light and visible light illuminations. Different vacuum annealing temperatures and times in the heating process lead to the huge changes in their photocatalytic activities, which are found to be due to surface plasmons of Ni metal nanoparticles. The results on these core–shell nanostructure show ∼ two-fold higher photocatalytic performances in N70-100/2 h nanocomposite (∼80 μmol g−1 h−1) over N70 (∼41 μmol g−1 h−1) for white light excitation. The results of XRD, FE-SEM/TEM-EELS and XPS spectroscopy demonstrate a core–shell structure of these samples consist of a core of Ni and a shell of NiO/NiCO3. Based on the results, it was found that an amount of NiCO3 in the shell has effect on the amount of H2 evolution and N70-100/2 h shows the highest activity due to the highest amount of carbonate serving as dielectric path for an efficient SPR effect.Conflicts of interest
There are no conflict of interests to declare.Acknowledgements
We gratefully acknowledge the Center of Materials Analysis (CMA), University of Oulu for characterizations. The work is partially supported by the project (No. 311934) from the Academy of Finland, and by the University of Oulu Finland. Authors also thank Dr A. Sasikala Devi for useful discussions. We also acknowledge Petri Leukkunen and Jarno Karvonen for their assistance and useful discussions during the sample optimization.References
- N. L. Panwar, S. C. Kaushik and S. Kothari, Renewable Sustainable Energy Rev., 2011, 15, 1513–1524 CrossRef.
- M. Babayan, A. E. Mazraeh, M. Yari, N. A. Niazi and S. C. Saha, J. Cleaner Prod., 2019, 215, 1262–1278 CrossRef CAS.
- K. J. Yoon, S. Lee, H. An, J. Kim, J.-W. Son, J.-H. Lee, H.-J. Je, H.-W. Lee and B.-K. Kim, Int. J. Hydrogen Energy, 2014, 39, 3868–3878 CrossRef CAS.
- M. Marandi, P. Talebi and L. Moradi, Opt. Mater., 2019, 94, 224–230 CrossRef CAS.
- G. L. Chiarello, M. H. Aguirre and E. Selli, J. Catal., 2010, 273, 182–190 CrossRef CAS.
- M. Z. Rahman, M. G. Kibria and C. B. Mullins, Chem. Soc. Rev., 2020, 49, 1887–1931 RSC.
- S. Chen, F. Li, T. Li and W. Cao, J. Colloid Interface Sci., 2019, 547, 50–59 CrossRef CAS.
- S. Zhu, C. Yang, F. Li, T. Li, M. Zhang and W. Cao, Mol. Catal., 2017, 435, 33–48 CrossRef CAS.
- Z. Qiang, X. Liu, F. Li, T. Li, M. Zhang, H. Singh, M. Huttula and W. Cao, Chem. Eng. J., 2021, 403, 126327 CrossRef CAS.
- P. M. Leukkunen, E. Rani, A. A. Sasikala Devi, H. Singh, G. King, M. Alatalo, W. Cao and M. Huttula, RSC Adv., 2020, 10, 36930–36940 RSC.
- M. Liu, F. Li, Z. Sun, L. Ma, L. Xu and Y. Wang, Chem. Commun., 2014, 50, 11004 RSC.
- C. Li, Y. Xu, W. Tu, G. Chen and R. Xu, Green Chem., 2017, 19, 882–899 RSC.
- E. Rani, P. Talebi, W. Cao, M. Huttula and H. Singh, Nanoscale, 2020, 12, 23461–23479 RSC.
- Q. Xiang, F. Cheng and D. Lang, ChemSusChem, 2016, 9, 996–1002 CrossRef CAS.
- W. Zhang and Y. Liang, Front. Chem., 2019, 7, 1–10 CrossRef.
- L. Zhang, X. Zhu, Y. Zhao, P. Zhang, J. Chen, J. Jiang and T. Xie, RSC Adv., 2019, 9, 39604–39610 RSC.
- P. K. Prajapati, H. Singh, R. Yadav, A. K. Sinha, S. Szunerits, R. Boukherroub and S. L. Jain, Appl. Surf. Sci., 2019, 467–468, 370–381 CrossRef CAS.
- K. Mondal and A. Sharma, RSC Adv., 2016, 6, 83589–83612 RSC.
- A. Picciotto, G. Pucker, L. Torrisi, P. Bellutti, F. Caridi and A. Bagolini, Radiat. Eff. Defects Solids, 2008, 163, 513–518 CrossRef CAS.
- W. Cao, V. Pankratov, M. Huttula, X. Shi, S. Saukko, Z. Huang and M. Zhang, Mater. Chem. Phys., 2015, 158, 89–95 CrossRef CAS.
- S. Das, J. Pérez-Ramírez, J. Gong, N. Dewangan, K. Hidajat, B. C. Gates and S. Kawi, Chem. Soc. Rev., 2020, 49, 2937–3004 RSC.
- B. C. Hodges, E. L. Cates and J.-H. Kim, Nat. Nanotechnol., 2018, 13, 642–650 CrossRef CAS.
- M. Litter, Appl. Catal., B, 1999, 23, 89–114 CrossRef CAS.
- J. Yi, H. Li, Y. Gong, X. She, Y. Song, Y. Xu, J. Deng, S. Yuan, H. Xu and H. Li, Appl. Catal., B, 2019, 243, 330–336 CrossRef CAS.
- A. Shukla, J. Power Sources, 2001, 100, 125–148 CrossRef CAS.
- X. Shi, S. Posysaev, M. Huttula, V. Pankratov, J. Hoszowska, J. C. Dousse, F. Zeeshan, Y. Niu, A. Zakharov, T. Li, O. Miroshnichenko, M. Zhang, X. Wang, Z. Huang, S. Saukko, D. L. González, S. van Dijken, M. Alatalo and W. Cao, Small, 2018, 14, 1–10 Search PubMed.
- M. Gong, D.-Y. Wang, C.-C. Chen, B.-J. Hwang and H. Dai, Nano Res., 2016, 9, 28–46 CrossRef CAS.
- N. Yu, W. Cao, M. Huttula, Y. Kayser, P. Hoenicke, B. Beckhoff, F. Lai, R. Dong, H. Sun and B. Geng, Appl. Catal., B, 2020, 261, 118193 CrossRef CAS.
- R. Shen, J. Xie, Q. Xiang, X. Chen, J. Jiang and X. Li, Chin. J. Catal., 2019, 40, 240–288 CrossRef CAS.
- S. De, J. Zhang, R. Luque and N. Yan, Energy Environ. Sci., 2016, 9, 3314–3347 RSC.
- K. Anandan and V. Rajendran, Mater. Sci. Semicond. Process., 2011, 14, 43–47 CrossRef CAS.
- D. Adler and J. Feinleib, Phys. Rev. B: Solid State, 1970, 2, 3112–3134 CrossRef.
- A. Aslani, V. Oroojpour and M. Fallahi, Appl. Surf. Sci., 2011, 257, 4056–4061 CrossRef CAS.
- Y.-Z. Zheng and M.-L. Zhang, Mater. Lett., 2007, 61, 3967–3969 CrossRef CAS.
- M. A. Nasseri, F. Kamali and B. Zakerinasab, RSC Adv., 2015, 5, 26517–26520 RSC.
- M.-S. Wu and Y.-P. Lin, Electrochim. Acta, 2011, 56, 2068–2073 CrossRef CAS.
- A. C. Johnston-Peck, J. Wang and J. B. Tracy, ACS Nano, 2009, 3, 1077–1084 CrossRef CAS.
- Y.-F. Xu, M.-R. Gao, Y.-R. Zheng, J. Jiang and S.-H. Yu, Angew. Chem., Int. Ed., 2013, 52, 8546–8550 CrossRef CAS.
- M. Gong, W. Zhou, M.-C. Tsai, J. Zhou, M. Guan, M.-C. Lin, B. Zhang, Y. Hu, D.-Y. Wang, J. Yang, S. J. Pennycook, B.-J. Hwang and H. Dai, Nat. Commun., 2014, 5, 4695 CrossRef CAS.
- S. G. Patra, A. Mizrahi and D. Meyerstein, Acc. Chem. Res., 2020, 53(10), 2189–2220 CrossRef CAS.
- S. Zilberg, A. Mizrahi, D. Meyerstein and H. Kornweitz, Phys. Chem. Chem. Phys., 2018, 20, 9429–9435 RSC.
- https://www.hwnanomaterial.com/superfine-high-purity-magnetic-nickel-ni-nanoparticles_p12.html.
- M. C. Biesinger, B. P. Payne, L. W. M. Lau, A. Gerson and R. S. C. Smart, Surf. Interface Anal., 2009, 41, 324–332 CrossRef CAS.
- A. P. Grosvenor, M. C. Biesinger, R. S. C. Smart and N. S. McIntyre, Surf. Sci., 2006, 600, 1771–1779 CrossRef CAS.
- Y. Ji, M. Ma, X. Ji, X. Xiong and X. Sun, Front. Chem. Sci. Eng., 2018, 12, 467–472 CrossRef CAS.
- C. Heine, B. A. J. Lechner, H. Bluhm and M. Salmeron, J. Am. Chem. Soc., 2016, 138, 13246–13252 CrossRef CAS.
- X. Yan, L. Tian and X. Chen, J. Power Sources, 2015, 300, 336–343 CrossRef CAS.
- P. L. Potapov, S. E. Kulkova, D. Schryvers and J. Verbeeck, Phys. Rev. B: Condens. Matter Mater. Phys., 2001, 64, 184110 CrossRef.
- J. Jana, M. Ganguly and T. Pal, RSC Adv., 2016, 6, 86174–86211 RSC.
- D. Muñetón Arboleda, J. M. J. Santillán, L. J. Mendoza Herrera, M. B. F. van Raap, P. Mendoza Zélis, D. Muraca, D. C. Schinca and L. B. Scaffardi, J. Phys. Chem. C, 2015, 119, 13184–13193 CrossRef.
- V. Sharma, C. Chotia, T. Tarachand, V. Ganesan and G. S. Okram, Phys. Chem. Chem. Phys., 2017, 19, 14096–14106 RSC.
- K. Sayama and H. Arakawa, J. Chem. Soc., Chem. Commun., 1992, 150–152 RSC.
- Y. Yang, F. Liang, M. Li, T. E. Rufford, W. Zhou and Z. Zhu, ChemSusChem, 2015, 8, 2193–2197 CrossRef CAS.
| This journal is © The Royal Society of Chemistry 2021 |

