 Open Access Article
A monodispersed CuPt alloy: synthesis and its superior catalytic performance in the hydrogen evolution reaction over a full pH range†
Xinmei Liu *ab,
Chen Liangb,
Wenlong Yang
 b,
Chunyang Yangb,
Jiaqi Linb and
Xue Lib
aFoshan (Southern China) Institute for New Materials, Foshan 528200, Guangdong, People's Republic of China. E-mail: liuxinmei.1990@163.com
bHarbin University of Science and Technology, 150080, People's Republic of China
First published on 29th March 2021
Abstract
The high cost and low stability of electrocatalysts are the major challenges for the commercialization of hydrogen generation in water. In this study, we demonstrated a one-pot synthesis of a monodispersed CuPt alloy with the diameter range of 20–30 nm by a hydrothermal method. Benefiting from the more available active sites and preferable d-band structure, the CuPt alloy exhibited a superior catalytic performance than pure Pt nanoparticles (Pt NPs) in the hydrogen evolution reaction (HER). In acidic media, the CuPt alloy achieved a low overpotential of 39 mV at a current density of 10 mA cm−2 for HER, which was by 22 mV lower than that for pure Pt NPs. In a neutral solution, the stability of the CuPt alloy is ca. 100-fold as compared to pure Pt NPs. Accounting by the dissolution of Cu in the alloy phase, the performance of the CuPt alloy was elevated after yielding hydrogen for 1.2 × 10⁵ s in alkaline media. The superior catalytic activity can also be applied in other applications. In the reduction of 4-nitro-phenol (4-NP), the CuPt alloy showed 12.84-fold catalytic activity higher than pure Pt NPs. This study designed a low-cost electrocatalyst with an efficient and durable catalytic performance for HER over the full pH range, which provides an environmentally friendly strategy to cope with the challenges of hydrogen generation.
Introduction
With increasing global population and energy demands, considerable attention has been focused on developing clean and renewable energy sources. To relieve energy crisis, hydrogen is proposed as a clean energy carrier. Water splitting by electrochemical processes is a vital route for high purity hydrogen production (2H2O(l) → 2H2(g) + O2(g): ΔE = 1.23 V vs. RHE).1 Theoretically, the cathodic reaction (2H+ + 2e− → H2) can be achieved without applying any potential. However, in an effort to overcome the activation energy barrier, practical applications require large overpotentials.2–4 To minimize the overpotentials and enhance the energy conversion efficiency, effective electrocatalysts must be implemented.5–7 Pt is generally regarded as the most active catalyst for HER. However, in actual, pure Pt is not an ideal catalyst. First, the high price and scarcity compromise the commercialization of Pt. Second, the catalytic activities of Pt at different pH values are different.8 Beside the cost, Pt also has to face serious challenges, such as unsatisfactory durability and large overpotentials in neutral solutions.9In the past decade, tremendous efforts have been made to construct ideal electrocatalysts, such as transition metals, phosphides, nitrides, and sulfides.10–18 Fang et al. has demonstrated that P substitution could lower the hydrogen adsorption energy via modulating the electron configuration.19 Feng et al. utilized a high-index faceted Ni3S2 nanosheet as the electrocatalyst for HER, which showed an excellent stability (>200 h) in basic media.20 Despite their achievement for HER, most of these materials are intrinsically limited by the complex preparation or toxicity. Therefore, a green electrocatalyst with satisfactory durability and lower overpotentials over the full pH range is urgently required. Alloys with high activity and stability have been identified as promising electrocatalysts.21–24 The general design principle of alloy catalysts is based on the volcano curve, which utilizes the function for hydrogen adsorption and exchange current to predict the performance.25–27 Compared to the elements such as P and S, Cu is an attractive earth-abundant metal, that is less harmful to the environment.28 When a Cu-based alloy is applied to HER, the reaction shifts to thermo-neutral, resulting in lower overpotentials.29–31 However, the study on Cu-based alloys is still in a rudimentary state. First, a traditional hydrothermal synthesis would tend to yield a Cu–Pt composite or a mixture that contain Cu oxide. Second, to achieve a small size, organic solvents have to be applied. Moreover, the surface ligand is difficult to be completely eliminated.32,33
In the present study, a CuPt alloy with a diameter of 20–30 nm has been obtained in an aqueous solution. The Fourier-transform infrared spectroscopy (FTIR) analysis revealed that the surfactant CTAC molecule on the alloy surface could be removed by a washing technique, indicating a “clean surface”. Compared to pure Pt NPs, the alloyed CuPt displayed an improved catalytic performance in HER over the full pH range. In acidic media, HER catalyzed by the CuPt alloy required a lower overpotential (22 mV) than that required by Pt NPs. In the neutral solution, the decline rate of overpotential by the CuPt alloy is 1.17 × 10⁻⁴ mV s−1, which was ca. 1% that of Pt NPs. In alkaline media, a positive shift of 59 mV was observed for the onset potential after 1.20 × 10⁵ s reaction time. The superior performance could be benefited from the reconstruction of the alloy surface in the electrocatalytic process that enlarged the active sites and favorable d-band structure that overcame the activation energy barrier. In addition, the superior catalytic activity can also be applied to the reduction of 4-NP. It was observed that the rate constant of the CuPt alloy could reach up to 0.191 s−1, which was much higher than that of pure Pt NPs (0.0138 s−1).
Experimental section
Characterization
The samples obtained were characterized by powder X-ray diffraction (XRD, Shimadzu 6000) which used Cu Kα radiation. The ultraviolet-visible absorption (UV-Vis) spectra were collected on an Ocean Optics QE 65000 Spectrometer. Scanning transmission electron microscope (STEM) and transmission electron microscopy (TEM) images were acquired with a JEM-2200FS TEM device. XPS spectra were collected on a VG ESCALAB MKII spectrometer.Electrochemical measurements
All electrochemical measurements were performed using a CHI 660E electrochemical workstation (Shanghai Chenhua Apparatus, China) under an ambient temperature. A three-electrode system was set up with a catalyst-coated glassy carbon electrode (GCE) (d = 3 mm) as the working electrode, a Pt wire with a diameter of 1 mm as the counter electrode and an Ag/AgCl electrode as the reference electrode. 6 μL of 2 mg mL−1 electrocatalyst suspension was added onto the GCE electrode surface. The modified electrode (Nf/electrocatalyst/GCE) could be obtained when the Nf solution was dried. The working electrode (Nf/electrocatalyst/GCE) dried naturally. Prior to each measurement, the working electrode was polished using 0.5 mm high-purity alumina, and then washed two times with distilled water, and finally dried. Linear sweep voltammetry (LSV) measurements were carried out at a scan rate of 10 mV s−1.Catalytic reduction of 4-NP
First, 1.7 mL of 0.1 mM 4-NP solution and 0.7 mL of 0.04 M NaBH4 were added to a quartz cell. Subsequently, 0.1 mL of 15 mM aqueous solution of the CuPt alloy was then added. It was held for 2–3 s, and monitored in the quartz cell with the UV-Vis spectrophotometer. The spectra were recorded at 35 s time intervals. Since NaBH4 was used in excess, the reaction followed the first-order kinetics.Results and discussion
Synthesis of the monodisperse CuPt alloy
In an attempt to reduce the environmental pollution, we choose the ascorbic acid (AA) as the reductant. Following a typical procedure, 38 mg CuCl2 was dissolved in 15 mL H2O. After dissolving CuCl2, 1.0 g CTAC was added to this solution. The solution was magnetically stirred for 5 min. Subsequently, 5 mL of 1 M AA was added. Upon 5 min stirring, the reaction solution gradually faded and completely bleached. Subsequently, 1 mL of 10 mM HPtCl4 was injected into this solution. The final solution was magnetically stirred for 20 min, and maintained at 99 °C for 30 min. With the increase in the reaction time, the solution gradually changed its color to black, implying the formation of the final product. The product obtained was collected via centrifugation and general washing technique.The crystal structure of the product obtained was characterized via powder XRD measurements. As exhibited in Fig. 1a, each peak of the XRD pattern for the as-prepared sample was positioned between pure face-centered cubic Pt (JCPDS no. 87-0642) and Cu (JCPDS no. 85-1426) crystal phases, indicating the formation of the CuPt alloy. No peak corresponding to other phases can be found from the XRD pattern, which signified the purity of the product. Furthermore, the energy-dispersive X-ray spectrum (EDX) images revealed an atomic ratio of Cu to Pt of about 44![[thin space (1/6-em)]](https://www.rsc.org/images/entities/char_2009.gif) :
:![[thin space (1/6-em)]](https://www.rsc.org/images/entities/char_2009.gif) 56. This result was in good agreement with the inductively coupled plasma-atomic emission spectrometry (ICP-AES) data. From FESEM in Fig. 1c, it can be seen that the CuPt alloy presented a uniform sphere morphology. The particle size was about 20–30 nm, and all nanospheres were well-dispersed without any agglomeration.
56. This result was in good agreement with the inductively coupled plasma-atomic emission spectrometry (ICP-AES) data. From FESEM in Fig. 1c, it can be seen that the CuPt alloy presented a uniform sphere morphology. The particle size was about 20–30 nm, and all nanospheres were well-dispersed without any agglomeration.
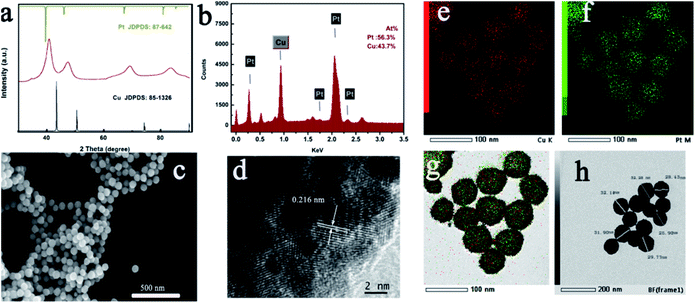 | ||
| Fig. 1 Morphology and structure characterizations of the as-prepared CuPt alloy: (a) XRD patterns; (b) EDX images; (c) FESEM images; (d) HRTEM images; (e–g) elemental mapping; (h) TEM image. | ||
Moreover, elemental mapping images in Fig. 1e–g indicated the uniform distribution of Cu and Pt elements. To further figure out the detailed structure of the sample obtained, the HRTEM image was carefully collected. As shown in Fig. 1d, an interplanar distance of 0.216 nm was present corresponding to the (111) crystallographic planes of CuPt located between the pure Pt and pure Cu. Fig. 1h shows the TEM of the CuPt alloy. It reveals that the interior of the CuPt alloy was not hollow. Furthermore, XPS measurements were also carried out. The peaks for Cu 2p3/2 demonstrated a downshift alternative to pure Cu, and the peak for Pt 4f showed an upward shift relative to pure Pt, which may be derived from the lattice compression of the CuPt alloy (Fig. S1†). In order to further ensure that the residual CTAC molecules have been removed from the alloy surface by the washing technique, we carried out the FTIR measurement again. No peak corresponding to the CH2 bending and stretching can be detected, revealing the “clean surface” of the alloyed CuPt (Fig. S2†).34
As shown in Fig. 2, there were two stages for the formation of the CuPt alloy NPs: (1) dissolution stage; and (2) reduction stage. The fading of the reaction solution at the initial stage could be attributed to the dissolution of Cu2O to Cu+ ions by AA. This reaction route avoided the yield of a mixture that contains Cu oxide, resulting in a co-reduction for the Pt and Cu precursors.
It was revealed that the key enabling step in the reduction of Cu+ ions was the introduction of the Pt precursor. When H2PtCl6 was not added, no precipitation could be obtained. This could be attributed to the high concentration of AA, which reduced the pH value of the reaction solution, changing the onset reduction potential from Cu+ ions to Cu atoms. To separate the roles played by cations and chloride ions, we replaced the H2PtCl6 with the same amount of NaCl, and the reduction could not be initiated. Therefore, it could be conjectured that the introduction of the Pt precursor initiated the reduction of Cu+ ions, thus enabling the formation of CuPt alloy NPs (Fig. 2).
It should be pointed out that CTAC not only served as an effective ligand but also elevated the purity of product and the atomic ratio of Pt. As a surfactant, CTAC binds to the alloy surface, and thus restrains the aggregation of each nanoparticle. Furthermore, the employment of CTAC could slow down the reduction stage as well, which ensured the complete dissolution of Cu2O. When the CTAC was not employed, the obtained product was a mixture of Cu3Pt and Cu2O (Fig. S3c†). FESEM presented that the mixture featured a spherical morphology, and the average diameter of each particle was 150–200 nm (Fig. S3b†).
Electrocatalytic performance for HER
These monodispersed CuPt alloy NPs with small size as well as “clean surface” provided more available active sites. We thus hypothesized that the as-prepared CuPt alloy should be an effective electrocatalyst for HER. In order to test this hypothesis, we evaluated the electrocatalytic performance of the CuPt alloy towards HER at different pH ranges.In an effort to investigate the effects of the d-band structure on the catalytic performance, we synthesized pure Pt NPs by a similar procedure to that used to synthesize the CuPt alloy (Fig. S3†), and both CuPt alloy and Pt NPs were used to modify the working electrode.
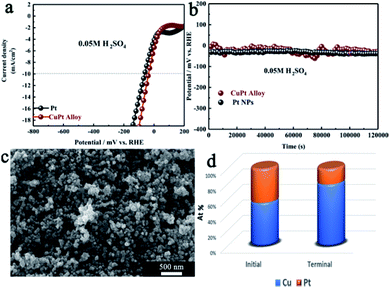
Fig. 3a and b show the representative LSV polarization curves catalyzed by Pt NPs and CuPt alloy in acidic media (pH = 1). The overpotential for HER catalyzed by the CuPt alloy (39 mV) was lower than that of Pt NPs (61 mV) in acidic media. This behavior was in accordance with the binding volcano curve principle.25 Hydrogen binding energy for the CuPt alloy was higher than that of Pt, which eventually led to favorable thermodynamics for HER. The stability of the CuPt alloy was evaluated by the galvanostatic control at a current density of 10 mA cm−2. As depicted in Fig. 3b, the CuPt alloy showed an obvious decline in the first 1.0 × 10⁴ s. This result may be caused by the rapid dissolution of Cu in acidic media. The rapid surface reconstruction of the alloy surface reduced the binding energy, endowing its catalytic activity closer to that of pure Pt. This process was also varied by the fact that the atomic ratio of Pt to Cu was reduced from 56![[thin space (1/6-em)]](https://www.rsc.org/images/entities/char_2009.gif) :
:![[thin space (1/6-em)]](https://www.rsc.org/images/entities/char_2009.gif) 44 to 20
44 to 20![[thin space (1/6-em)]](https://www.rsc.org/images/entities/char_2009.gif) :
:![[thin space (1/6-em)]](https://www.rsc.org/images/entities/char_2009.gif) 80 yielding hydrogen for 1.2 × 10⁵ s (Fig. S5†). The TEM image showed that the CuPt surface has been etched, signifying an increase in the specific surface area for the CuPt alloy (Fig. S6†). After 1.2 × 10⁵ s, the CuPt alloy maintained its performance that was higher than that of pure Pt NPs. Since the load rate of Pt was lower, the utilization of the CuPt alloy for HER would reduce the cost of the electrocatalyst without lowering the activation energy.
80 yielding hydrogen for 1.2 × 10⁵ s (Fig. S5†). The TEM image showed that the CuPt surface has been etched, signifying an increase in the specific surface area for the CuPt alloy (Fig. S6†). After 1.2 × 10⁵ s, the CuPt alloy maintained its performance that was higher than that of pure Pt NPs. Since the load rate of Pt was lower, the utilization of the CuPt alloy for HER would reduce the cost of the electrocatalyst without lowering the activation energy.
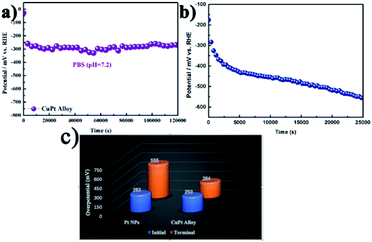
Durability is a key factor in evaluating catalyst performance. In the neutral solution (pH = 7.2), the stability of the CuPt alloy for HER was considerably higher than that of Pt NPs. As illustrated in Fig. 4a, when catalyzed by CuPt alloy, the overpotential at the constant current density of 10 mA cm−2 was ca. 250 mV. After 1.2 × 10⁵ s reaction time, the overpotential shifted to 264 mV. The decline rate of overpotential was calculated to be 1.17 × 10⁻⁴ mV s−1. When the same measurement was applied for the Pt NPs, the decline rate was 1.09 × 10⁻² mV s−1. The enhancement in durability mainly attributed to the unique composition of the CuPt alloy that suppressed the deactivation of the electrocatalyst. Moreover, the turnover frequency (TOF) of CuPt alloy (5.30 × 10⁻² s−1) was much superior to that of Pt NPs (1.52 × 10⁻² s−1). All the results revealed that the preferable d-band structure endowed the CuPt alloy with an enhanced activity in the neutral solution (Fig. S7†).
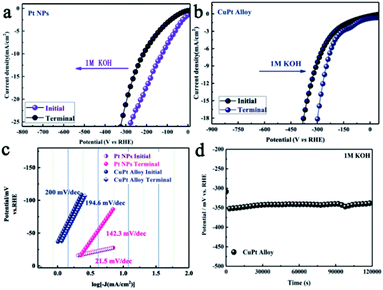
Besides the preferable d-band structure, surface reconstruction is another factor for improving the electrocatalytic performance for HER. The overpotentials catalyzed by Pt NPs and CuPt alloy were 128.0 mV and 319 mV at the current density of 10 mA cm−2 (Fig. 5a and b). It is suggested that the higher activity for Pt NPs was caused by its different rate-determining step from the CuPt alloy in alkaline media. Fig. 5c shows the Tafel plots derived from the LSVs. The initial Tafel slopes for Pt NPs and CuPt alloy were 21.5 mV dec−1 and 200 mV dec−1, respectively. After 1.2 × 10⁵ s of the chronopotentiometric measurement, the LSV curve for Pt NPs displayed a potential showing a negative shift of 89.7 mV. It is interesting to observe that the LSV curve for the CuPt alloy showed a positive shift of about 59.0 mV. This contrast was attributed to the dissolution of Cu in the alloy phase, which reconstructed the alloy surface and increased the specific surface area. Consistently with the proposed mechanism, their catalytic performance was not degraded, but enhanced (Fig. 5b). Furthermore, we also calculated the TOF of the CuPt alloy and Pt NPs. After yielding 1.2 × 10⁵ s hydrogen in the alkaline media, the TOF of the CuPt alloy was elevated from 3.58 × 10⁻² to 8.86 × 10⁻² (Fig. S8†).
All parameters indicated that the CuPt alloy showed a superior durability under alkaline conditions. Therefore, it could be concluded that the higher activity and superior stability made the CuPt alloy a promising catalyst for HER over the full pH range.
For comparison, we also evaluated the electrocatalytic performance of the commercial Pt/C (20 wt%) towards HER under different pH conditions. Catalytic parameters for commercial Pt/C are shown in Fig. S9.† All parameters indicated that pure Pt NPs showed a superior durability and low overpotential. This contrast could be attributed to the high mass ratio of Pt and the small diameter of Pt NPs.
The catalytic performance
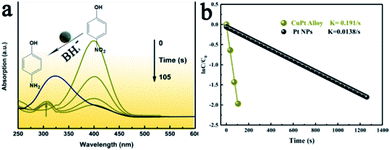
To determine the superior catalytic performance of the as-obtained CuPt alloy in other applications, we choose the reduction of 4-NP to 4-aminophenol as a model reaction. The detailed procedures are in the Experimental section. As illustrated in Fig. 6a, the absorption of the 4-NP solution was 310 nm. Upon the addition of NaBH4, the pH value of the solution increased, and the absorption of 4 nitro-phenolate at 403 nm became dominant. It took about 105 s for 4-NP to achieve the reduction. The reaction rate constant could be obtained from the slope of the fitting line in Fig. 6b. In the presence of the as-synthesized CuPt alloy, the rate constant was calculated to be 0.191 s−1. In the presence of the pure Pt NP, the reduction required 1260 s (Fig. S10†). The rate constant of pure Pt NP was 0.0138 s−1, which only 7.2% of the value of the CuPt alloy. This excellent performance could be attributed to the stronger adsorption energy of the 4-NP molecule onto the CuPt alloy than in case of pure Pt NP.35 Since the rate constant is an important parameter to evaluate the catalyst efficiency, this study determines the enhanced catalytic activity of the CuPt alloy. It can be concluded that a preferable d-band structure modulated by Cu atoms enables a cost-effective CuPt alloy with promising applications.Conclusions
In summary, we demonstrated an effective approach to achieve a low cost and high stability electro-catalyst for HER. A CuPt alloy with a diameter of 20–30 nm was first synthesized by the one-pot hydrothermal method. The catalytic performance of the CuPt alloy at different pH values was systematically investigated. It was revealed that the preferable d-band structure endowed the CuPt alloy with enhanced activity. The reconstruction of the CuPt alloy surface in the electrocatalytic process overcame the degradation of activity by increasing the specific surface area. These two factors enabled the CuPt alloy to have more satisfactory durability and lower overpotentials than that of Pt NPs for HER. This study constructed a cost-effective catalyst with enhanced performance. The simple and salable synthesis is suitable for mass production, which would offer a new insight to construct other alloyed nanomaterials. The efficient and durable catalytic performance of the CuPt alloy over the full pH range would be beneficial to the hydrogen evolution process. Since the efficient activities can also be applied in the reduction of 4-NP, it also opens up new avenues for the utilizing of Cu-based alloys in other catalytic applications.Author contributions
Xinmei Liu, Chunyang Yang and Xue Li designed and performed experiments and analyzed data. Wenlong Yang, and Chen Liang provided intellectual input, Jiaqi Lin, wrote the manuscript.Conflicts of interest
All authors contributed to the discussion. The authors declare no competing financial interest.Acknowledgements
This work was supported by the Guangdong Basic and Applied Basic Research Foundation (No. 2019A1515110585).Notes and references
- Z. Ge, B. Fu, J. Zhao, X. Li, B. Ma and Y. Chen, J. Mater. Sci., 2020, 1–24 Search PubMed.
- M. Zeng and Y. Li, J. Mater. Chem. A, 2015, 3, 14942–14962 RSC.
- X. Li, L. Zhao, J. Yu, X. Liu, X. Zhang, H. Liu and W. Zhou, Nano-Micro Lett., 2020, 12, 131 CrossRef CAS PubMed.
- J. F. Callejas, C. G. Read, C. W. Roske, N. S. Lewis and R. E. Schaak, Chem. Mater., 2016, 28, 6017–6044 CrossRef CAS.
- J. Wang, F. Xu, H. Jin, Y. Chen and Y. Wang, Adv. Mater., 2017, 29, 1605838 CrossRef PubMed.
- B. You and Y. Sun, Acc. Chem. Res., 2018, 51, 1571–1580 CrossRef CAS PubMed.
- M. I. Jamesh, J. Power Sources, 2016, 333, 213–236 CrossRef CAS.
- M. A. Abbas and J. H. Bang, Chem. Mater., 2015, 27, 7218–7235 CrossRef CAS.
- A. B. Laursen, R. B. Wexler, M. J. Whitaker, E. J. Izett, K. U. D. Calvinho, S. Hwang, R. Rucker, H. Wang, J. Li, E. Garfunkel, M. Greenblatt, A. M. Rappe and G. C. Dismukes, ACS Catal., 2018, 8, 4408–4419 CrossRef CAS.
- X. Zou and Y. Zhang, Chem. Soc. Rev., 2015, 44, 5148–5180 RSC.
- B. Hinnemann, P. G. Moses, J. Bonde, K. P. Jørgensen, J. H. Nielsen, S. Horch, I. Chorkendorff and J. K. Nørskov, J. Am. Chem. Soc., 2005, 127, 5308–5309 CrossRef CAS PubMed.
- Y. Li, H. Wang, L. Xie, Y. Liang, G. Hong and H. Dai, J. Am. Chem. Soc., 2011, 133, 7296–7299 CrossRef CAS PubMed.
- E. J. Popczun, J. R. McKone, C. G. Read, A. J. Biacchi, A. M. Wiltrout, N. S. Lewis and R. E. Schaak, J. Am. Chem. Soc., 2013, 135, 9267–9270 CrossRef CAS PubMed.
- Q. Yun, Q. Lu, X. Zhang, C. Tan and H. Zhang, Angew. Chem., Int. Ed., 2018, 57, 626–646 CrossRef CAS PubMed.
- A. Han, H. Zhang, R. Yuan, H. Ji and P. Du, ACS Appl. Mater. Interfaces, 2017, 9, 2240–2248 CrossRef CAS PubMed.
- P. C. K. Vesborg, B. Seger and I. Chorkendorff, J. Phys. Chem. Lett., 2015, 6, 951–957 CrossRef CAS PubMed.
- P. Yu, F. Wang, T. A. Shifa, X. Zhan, X. Lou, F. Xia and J. He, Nano Energy, 2019, 58, 244–276 CrossRef CAS.
- J. Tan, X. He, F. Yin, X. Liang, B. Chen, G. Li and H. Yin, J. Mater. Sci., 2019, 54, 4589–4600 CrossRef CAS.
- Z. Fang, L. Peng, Y. Qian, X. Zhang, Y. Xie, J. J. Cha and G. Yu, J. Am. Chem. Soc., 2018, 140, 5241–5247 CrossRef CAS PubMed.
- L.-L. Feng, G. Yu, Y. Wu, G.-D. Li, H. Li, Y. Sun, T. Asefa, W. Chen and X. Zou, J. Am. Chem. Soc., 2015, 137, 14023–14026 CrossRef CAS PubMed.
- C. Wang, H. Xu, H. Shang, L. Jin, C. Chen, Y. Wang, M. Yuan and Y. Du, Inorg. Chem., 2020, 59, 3321–3329 CrossRef CAS PubMed.
- C.-H. Cui, H.-H. Li, X.-J. Liu, M.-R. Gao and S.-H. Yu, ACS Catal., 2012, 2, 916–924 CrossRef CAS.
- H.-H. Li and S.-H. Yu, Adv. Mater., 2019, 31, 1803503 CrossRef PubMed.
- T. Zhang, X. Liu, X. Cui, M. Chen, S. Liu and B. Geng, Adv. Mater. Interfaces, 2018, 5, 1800359 CrossRef.
- J. Greeley, T. F. Jaramillo, J. Bonde, I. B. Chorkendorff and J. K. Norskov, Nat. Mater., 2006, 5, 909–913 CrossRef CAS PubMed.
- C. Hu, L. Zhang and J. Gong, Energy Environ. Sci., 2019, 12, 2620–2645 RSC.
- J. Greeley, T. F. Jaramillo, J. Bonde, I. B. Chorkendorff and J. K. Norskov, Nat. Mater., 2006, 5, 909–913 CrossRef CAS PubMed.
- X. Liu, H. Zheng, Z. Sun, A. Han and P. Du, ACS Catal., 2015, 5, 1530–1538 CrossRef CAS.
- X. Liu, S. Cui, Z. Sun and P. Du, Chem. Commun., 2015, 51, 12954–12957 RSC.
- X.-F. Zhang, A.-J. Wang, L. Zhang, J. Yuan, Z. Li and J.-J. Feng, ACS Appl. Energy Mater., 2018, 1, 5054–5061 CrossRef CAS.
- X.-Y. Huang, L.-X. You, X.-F. Zhang, J.-J. Feng, L. Zhang and A.-J. Wang, Electrochim. Acta, 2019, 299, 89–97 CrossRef CAS.
- S. Chen, H. Su, Y. Wang, W. Wu and J. Zeng, Angew. Chem., Int. Ed., 2015, 54, 108–113 CrossRef CAS PubMed.
- Y. Qi, T. Bian, S. I. Choi, Y. Jiang, C. Jin, M. Fu, H. Zhang and D. Yang, Chem. Commun., 2014, 50, 560–562 RSC.
- X. Liu, Y. Sui, X. Yang, Y. Wei and B. Zou, ACS Appl. Mater. Interfaces, 2016, 8, 26886–26894 CrossRef CAS PubMed.
- Z. D. Pozun, S. E. Rodenbusch, E. Keller, K. Tran, W. Tang, K. J. Stevenson and G. Henkelman, J. Phys. Chem. C, 2013, 117, 7598–7604 CrossRef CAS PubMed.
Footnote |
| † Electronic supplementary information (ESI) available. See DOI: 10.1039/d0ra09386f |
| This journal is © The Royal Society of Chemistry 2021 |


