 Open Access Article
Study of Ag precipitation and mechanical properties of Ti–Ta–Ag ternary alloy
Jun-Min Zhang,
Zong-Yan Zhao *,
Qing-Hua Chen,
Xing-Hu Chen and
Yin-He Li
Faculty of Materials Science and Engineering, Kunming University of Science and Technology, Kunming, Yunnan 650093, China. E-mail: zzy@kust.edu.cn
First published on 13th January 2021
Abstract
Ti–25Ta–xAg alloy samples with different content of Ag were prepared by spark plasma sintering method. X-ray diffraction, microscopic metallographic, scanning electron microscopy, and transmission electron microscopy were used to analyze the phase structure and morphology of the alloy samples. Ti–Ta–Ag can form a stable ternary alloy system. Furthermore, with the increase of Ag content and sintering temperature, Ag will be precipitated at the grain boundary. In order to explore the precipitation mechanism of Ag in the alloy and its influence on the mechanical properties, the crystal structure, electronic structure, and elastic constant under different Ag solid solubility were calculated systematically by using first-principles calculations. The results show that the critical temperature of Ag in Ti–Ta–Ag ternary alloy is about 2200 K, and the high temperature is favorable for the aging precipitation of Ag. The lattice constants and mechanical properties of (Ti1−xAgx)3Ta solid solution suddenly change when the Ag solid solubility x value is equal to 0.8, and their changes will follow different rules. The internal mechanism of this phenomenon is that the 4d10 electronic states of Ag have changed from obvious local electronic states to mixed local and non-local electronic states. These results provide theoretical guidance for the application of Ti–Ta–Ag ternary alloys in biomedicine.
1. Introduction
Since the 1940s, biomedical materials have become a focus of research and development. Metal materials are implanted into the human body as artificial knee joints, femoral joints, dental implants, tooth roots, and denture metal scaffolds, due to their good strength, toughness and excellent processing performance. According to statistics, at present, 70–80% of biomedical materials are metal materials.1 Among them, Ti and Ti-based alloys have gradually taken the leading position in the field of hard tissue repair and replacement materials, and become the preferred biomedical metal materials.2 Commercial pure Ti has been successfully applied to human body as bone repair, replacement material, and dental material, but there are two major problems, such as low strength and poor biocompatibility.3,4 Therefore, a series of Ti-based alloys for medical implantation have been developed and applied. Currently, Ti–6Al–4V, Ti–5Al–2.5Fe, Ti–6Al–7Nb, Ti–Ni, and other Ti-based alloys are widely used.5,6 However, recent studies have found that there are still some problems with the Ti-based alloys mentioned above: V and Al can lead to neurological disorders and other diseases, as well as particulate accumulation in the tissues near the implant materials;7,8 the elastic modulus of Ti–5Al–2.5Fe and Ti–6Al–7Nb is 4–10 times that of human bone, which is easy to cause “stress shield” and cause implant loosing or fracture;9 Ni is also one of the controversial toxic elements, with potential side effects of sensitization, teratogenesis and carcinogenesis.10 Therefore, the development of new biological Ti-based alloys with excellent biocompatibility, low elastic modulus, and high strength without Al and V has become one of the key development directions of biomedical metal materials, at present.To improve the comprehensive mechanical properties of Ti-based alloy, many methods are adopted at present, such as: additive manufacturing, porous powder metallurgy, severe plastic deformation, alloy strengthening, surface modification, heat treatment or thermo-mechanical processing, and so on.11–13 The modified Ti-based alloys (such as, Ti–6Al–4V, β-type Ti alloys, etc.) have comparable or even better mechanical properties, corrosion behavior, and biocompatibility compared with pure Ti metal. Among them, alloying means can not only effectively improve its strength, formability and creep strength, but also add alloying elements to give it special properties according to needs. Therefore, in recent years, researchers have gradually developed the binary system such as: Ti–Mo,14 Ti–Nb,15 Ti–Ta,16–18 and Ti-based polynary alloys based on these binary systems. Ti–Ta alloy, as a biomedical metal material, not only has excellent mechanical properties of other alloys, but also has good corrosion resistance.16,19 Zhou et al. found that Ti-25 wt% Ta has the lowest elastic modulus and the highest strength/elastic modulus ratio. From the perspective of mechanical compatibility, this alloy is most likely to be applied in the field of biological metal materials.17 Meanwhile, Zhou et al. pointed out that the elastic modulus of Ti–Ta alloy was closely related to Ta content, phase composition and phase structure. For example, for Ti-50 wt% Ta alloy, the elastic modulus of sample that is aging-treated at 500 °C is 16 GPa, which is higher than that of sample that is aging-treated at 600 °C.18
In order to improve the biocompatibility of Ti-based alloys, Ti–Ta–NM alloys made by adding noble metal (NM) elements has become a new research hotspot. Ag is a kind of broad-spectrum germicidal material with super antibacterial properties.20,21 The addition of Ag to Ti-based alloys can increase the open-circuit potential and decrease the corrosion current density. Zheng et al. carried out a study on Ti-based alloys containing Ag.22–25 Their results showed that the Ti–Ni–Ag ternary alloy added with trace amounts of Ag had little effect on the shape memory effect of the alloy, and the antibacterial property of the alloy was significantly improved;22 the addition of trace Ag can effectively improve the corrosion resistance of pure Ti in artificial saliva solution.23 Zhang et al. found that Ti–Ag alloy exhibits higher corrosion potential and greater impedance than CP-Ti alloys.5,7 Furthermore, Ti–Ag alloy shows that the nano/micron Ti2Ag phase showed strong dispersion strengthening performance, and the presence of elemental Ag in the form of solid solution in the microstructure could improve the corrosion resistance of the alloy, and the corrosion resistance of the alloy was better with the increase of content.8 In addition, Ag reduced the Young's modulus and increased the antibacterial activity of Ti–At alloy.10 Although Ag has good antibacterial properties, it should be noted that Ag may also bring cytotoxicity. Oh et al. found that when the Ag content was controlled within a certain range (0–4.5wt%), the cytotoxicity of Ti–Ag alloy on mouse fibrocytes was very small or even negligible.26 Albers et al. also found that Ag showed significant cytotoxicity to osteoblasts and osteoclasts when the size of Ag was reduced to a certain degree (50 nm and below), while Ag at size 3 μm showed no cytotoxicity.27 Therefore, the size and content of Ag should be controlled so as to minimize its cytotoxicity while maintaining its excellent antimicrobial properties.
Recently, it has been found that Ag will be precipitated in the form of elemental and irregular micron-size particles in Ti–Ag-based ternary alloy system, so that such as shape memory effect and antibacterial properties will be significantly changed.25,28 Therefore, it is necessary to understand the precipitation mechanism of Ag in Ti–Ta–Ag ternary alloy system for its biomedical application. The properties of Ti–25Ta–xAg alloys were prepared through Spark Plasma Sintering (SPS) techniques. SPS is a new powder metallurgy sintering technology. It applies a specific sintering power source and pressing pressure to the metal powder by means of an electrified electrode, and the sample is rapidly prepared by discharge activation, thermoplastic deformation and cooling. SPS technology has the characteristics of sintering in the process of pressure. The plasma produced by pulse current and the pressure in the sintering process are beneficial to reduce the sintering temperature of the powder. Because of its low voltage and high pulse current, the powder can be sintered rapidly and compactly.29 The effects of temperature and properties on the precipitation behavior of Ag were analyzed. Then, the first-principles calculation is used to systematically analyze the solid solution behavior, microstructure and corresponding electronic structure of the ternary alloy formed by introducing Ag on the basis of Ti–25Ta binary alloy. The precipitation mechanism of Ag in Ti–Ta–Ag ternary alloy was analyzed in combination with the above two studies.
2. Method and details
2.1 Sample preparation
Ti, Ta, and Ag powder with particle size (≤55, ≤30, 7–10 μm, respectively) and purity (>99.5%) were used in the present work. The process of ball milling and mixing is as follows: Ti, Ta, and Ag raw materials were weighed according to mass fraction (75 − x)%, 25% and x% (x = 0, 1.5, 3 and 4.5) respectively, and combined with ZrO2 ball milling media were put into the vacuum ball grinding tank for powder mixing. The powder mixture is weighed 100 g each time and sealed into the grinding ball tank. Then the grinding ball tank is vacuumized to about 10 Pa in the vacuum glove box (model QFX-1). Argon gas is filled into the grinding ball tank as protective gas. The above process is repeated for three times to ensure that the gas in the grinding ball tank is completely argon. The ball grinding speed was set at 150 RPM and the time was 20 hours.The process of spark plasma sintering is as follows: the ball grinded metal powder is filled into a graphite mold (Ø20 mm × 50 mm). Then, the mold is put into the spark plasma equipment (SPS-150-75). The temperature was raised to the required temperature (i.e. 750, 850, and 950 °C) at the heating rate of 90 °C min−1, and then kept for 5 min, and then the pulse current was turned off to allow the sample to cool rapidly with the furnace. During the sintering process, the vacuum degree in the furnace is kept at 2–8 Pa, and the axial pressure of 30 MPa is applied.
2.2 Sample characterization
Rigaku Model D/Max-2200X diffractometer was used for phase analysis. The experiment was carried out at room temperature with a scanning range of 30–90° and a scanning rate of 4° min−1. Philip XL370 type scanning electron microscope with accelerating voltage of 30 kV was used to observe the morphology of the sample, and EDS energy spectrum was used for further analysis of its phase. The morphologies of the specimens were observed by Tecnai G2 type transmission electron microscope produced by FEI Company in the United States. The Nano Indenter G200 Nano indentation instrument produced by Agilent Company in the United States was used to measure its mechanical properties. The initial contact load was set as 0.015 mN, the maximum load was set as 20 mN, and the loading and unloading time was both 30 seconds.2.3 First-principle calculations
All theoretical calculation work in this paper is completed by CASTEP (Cambridge Serial Total Energy Package) module in Materials Studio.30 The ultra-soft pseudopotential method of plane wave is used to describe the interaction between electron and ion, which can save time and resources while ensuring a certain precision. The electron wave function is expanded through a plane wave base set, where the truncation energy of the plane wave was set to 350 eV. The exchange association of electron–electron interactions can be described by the PBEsol functional in the generalized gradient approximation (GGA), which is a more accurate theoretical calculation method for solid materials. The convergence criteria for the optimization of geometric structure are set as follows: the total energy difference between two adjacent ion steps is less than 1.0 × 10⁻⁶ eV per atom; the interatomic interaction force is less than 0.1 eV nm−1; the atomic stress is less than 0.02 eV Å−1; the atomic displacement is less than 5.0 × 10⁻⁵ nm; the energy convergence standard of the electron step in the SCF operation is 5.0 × 10⁻⁷ eV per atom. Other relevant settings were as follows: k-points was set to 5 × 5 × 3, FFT network was set to 36 × 36 × 60.The calculation model is based on the Ti0.75Ta0.25 model (2 × 2 × 2 supercell) of hexagonal closed packing (i.e. Ti hcp or α-Ti phase) structure in our previous Ti–Ta binary alloy work.31 SQS method was used to further construct Ti–25Ta–xAg (which is the usual labeling method in the experimental study of alloys) ternary alloy. Two ternary solid solutions (Ti1−xAgx)3Ta and Ti3Ta1−xAgx (which is the usual labeling method in the study of solid solution theory. In order to be consistent with the literature, we adopt two labeling methods simultaneously in this paper) are obtained by replacing Ti and Ta atoms with Ag atoms respectively. Firstly, the model is optimized completely including lattice constant and atomic coordinates, and then the calculation of single point energy, electronic structure and elastic constant is carried out.
3. Results and discussions
3.1 Phase and microstructure of Ti–Ta–Ag ternary alloy
Fig. 1 shows the X-ray diffraction pattern of Ti–25Ta–xAg alloys at different Ag contents and sintering temperatures. After sintering at 950 °C without Ag incorporation, the XRD patterns of the samples include α-Ti phase, Martensite α′′ and β-Ti phase, as well as a small amount of unmelted Ta diffraction peaks. The high temperature phase is β-Ti phase. In the sintering process of SPS, the cooling rate is very fast (up to 2000 °C h−1), which is equivalent to the quenching process. The high temperature β-Ti phase is retained, and most of it is converted into α-Ti phase and Martensite α′′ phase. The melting point of Ta is 2996 °C, while that of Ti is 1678 °C. There is a big difference in the melting point of the two metal elements, and there will be no melting in the low-temperature rapid sintering process. However, at the sintering temperature of 950 °C, it can be found that Ta and Ti form homogeneous solid solution. After the addition of Ag, Ag related diffraction peaks appeared in the alloy, indicating that Ag in the alloy was precipitated as a single substance. As shown in Fig. 1(a), at the same sintering temperature (950 °C), Ag precipitation in ternary alloy became more and more obvious with the increase of Ag content in the raw material. As shown in Fig. 1(b), for the same Ag content (x = 4.5), the characteristic diffraction peak of Ag is the most obvious at 850 °C, indicating that high-temperature sintering will precipitate Ag from Ti–25Ta alloy, and the higher the sintering temperature is, the greater the precipitate quantity will be. When the sintering temperature reaches 950 °C, the characteristic diffraction peak of Ag is relatively weak, because the melting point of Ag is about 960 °C, and the Ag precipitated at high temperature will be vaporized. According to the results of X-ray diffraction characterization, it can be preliminarily concluded that Ag is easy to dissolve in α-Ti phase during SPS high-temperature sintering and forms supersaturated solid solution in high-energy non-equilibrium state. Due to its low melting point (960 °C), Ag can melt and accumulate at the grain boundary of α-Ti phase, solidify and precipitate at the grain boundary during the subsequent rapid cooling process. At the same time, some Ag precipitation occurs during the phase transition from β-Ti phase to α-Ti phase.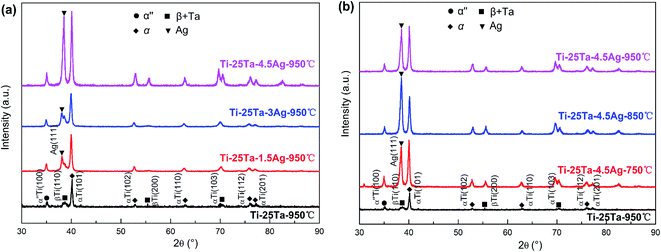 | ||
| Fig. 1 XRD patterns of Ti–25Ta–xAg ternary alloys: (a) different Ag content under sintering temperature of 950 °C; (b) different sintering temperature with Ag content as x = 4.5. | ||
It can be found the intensity of Ag increase with increasing the temperature of heat treatment. This finding indicates the precipitation of Ag. The precipitation of Ag may significantly influence the mechanical properties of the samples. Therefore, in order to quantitatively analyze the precipitation amount of Ag, we further obtained the volume fractions of Ag in the samples as shown in Table 1, by integrating the area of the diffraction peak in the XRD pattern.32,33 The volume fraction of Ag increases monotonously as SPS temperature elevated since the Ag phase is prone to precipitation at a proper temperature. By contrast, the volume fractions of α-Ti increases monotonously from 48.6% to 50.1%, the volume fractions of α′′-Ti and β-Ti + Ta decreases monotonously from 32.5% to 30.9% and from 17.8% to 16.9%, respectively.
| Sample | α-Ti | α′′-Ti | β-Ti + Ta | Ag |
|---|---|---|---|---|
| Ti–25Ta–4.5Ag-750 °C | 48.6 | 32.5 | 17.8 | 1.1 |
| Ti–25Ta–4.5Ag-850 °C | 49.3 | 31.6 | 17.3 | 1.8 |
| Ti–25Ta–4.5Ag-950 °C | 50.1 | 30.9 | 16.9 | 2.1 |
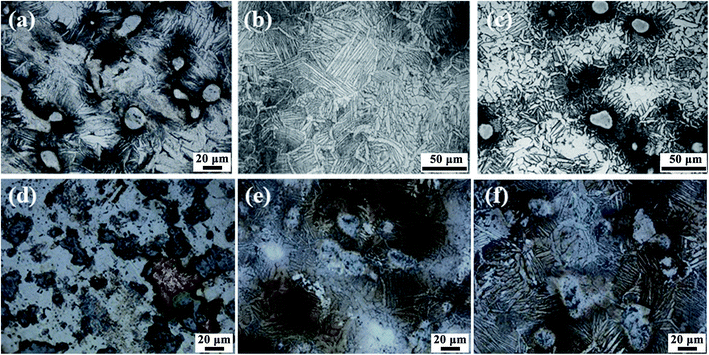
Fig. 2 shows the metallographic and microscopic characterization results of different samples. According to the results of X-ray diffraction analysis and metallographic chart (GB/T 6611-2008), the irregular polygon area in the alloy sample can be identified as α-Ti phase, the acicular region as martensite α′′, and the lamellar region as β-Ti phase. Among them, the small area without corrosion is insoluble Ta, and the silver white spot area is precipitated Ag. There is a large amount of unmelted Ta in the sintered products sintered at 750 °C, and the size of unfused Ta is large. With the increase of sintering temperature, it can be seen that the size of unmelted Ta decreases obviously, which indicates that with the increase of sintering temperature, the unmelted Ta melts in the sintering process and forms an alloy with Ti. With the increase of sintering temperature, the acicular and lamellar regions also decrease obviously, while the polygonal grain size increases, which indicates that α-Ti phase is the main crystal structure of Ti–25Ta–xAg ternary alloy. The more Ag is mixed in the sample preparation, or the higher the sintering temperature is, the more silvery white spot area increases obviously, which indicates that the content and sintering temperature are the key factors to determine the precipitation of Ag.
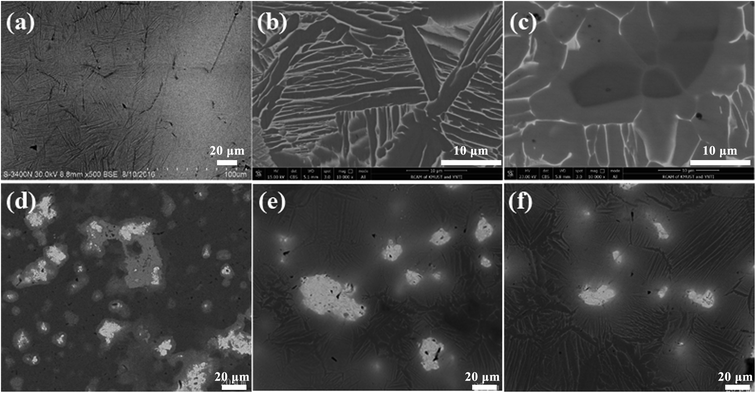
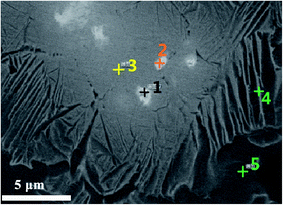
Based on the morphology observation in Fig. 3, and the selected area energy spectrum detection in Fig. 4 and Table 2, it can be concluded that the white bright area in the SEM photo is Ta rich area, the gray white area is β-Ti phase, and the black area is α-Ti phase. With the increase of sintering temperature, the amount and size of unfused Ta in the sintered products decrease obviously. This is consistent with the observation of X-ray diffraction and metallographic microscope, indicating α-Ti phase solid solution can be formed between Ti and Ta at higher sintering temperature. The gray dot area in SEM images is the enrichment area of Ag, that is, Ag precipitated during rapid cooling. It can be observed from Fig. 3 and 4 that Ag precipitates at the grain boundary, which indicates that a large amount of Ag precipitates at the grain boundary during the rapid cooling process (i.e. the phase transformation process from β-Ti phase to α-Ti phase). The size of precipitated Ag particles is about 2–3 μm. Therefore, under the above conditions, Ti–25Ta–xAg alloy has no potential cytotoxicity, which is very important for the biomedical application of Ti–Ta–Ag ternary alloy.
| Element (wt%)/no. | 1 | 2 | 3 | 4 | 5 |
|---|---|---|---|---|---|
| Ti | 23.31 | 23.28 | 78.70 | 82.58 | 96.69 |
| Ta | 76.69 | 76.72 | 21.30 | 14.41 | 3.31 |
| Ag | 0 | 0 | 0 | 3.01 | 0 |
According to the X-ray diffraction pattern of sample shown in Fig. 1, Ag diffraction peaks appear in Ti–25Ta–xAg alloy, and Ag in the alloy exists in a single state. As shown in the SEM images in Fig. 4, Ag exists in the gray lamellar region. In order to further analyze the location and morphology of Ag in Ti–25Ta–xAg alloy, the lamellar sample of Ti–25Ta–4.5Ag alloy was sintered at 950 °C and the sample was analyzed by TEM images, as shown in Fig. 5. It can be observed that Ag precipitates at grain boundary, which indicates that Ag precipitates at grain boundary in large quantities during the rapid cooling process (i.e. the phase transition process from phase to phase). The size of precipitated Ag particles is about 2–3 μm, so Ti–25Ta–xAg alloy has no potential cytotoxicity under the above conditions, which is very important for the biomedical application of Ti–25Ta–xAg ternary alloy.
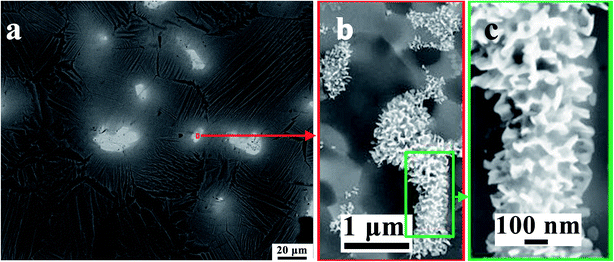 | ||
| Fig. 5 The microstructure of Ti–25Ta–4.5Ag alloy: (a) TEM image, (b) selected region of gray area and (c) the enlarged view of lamellar Ag precipitated particle. | ||
3.2 Energy and thermodynamic properties of Ti–Ta–Ag ternary alloy
Fig. 6(a) shows the enthalpy of formation and binding energy of (Ti1−xAgx)3Ta solid solution calculated by first-principles. With the increase of Ag content, the absolute value of binding energy of solid solution decreases linearly, which indicates that the interatomic interaction of α-Ti phase Ti–25Ta alloy weakens with the addition of Ag. In other words, the precipitation of Ag is relatively easy to occur at high content. The formation enthalpy ΔH shows a parabolic distribution with x = 0.5 symmetry axis, which indicates that (Ti1−xAgx)3Ta solid solution well conforms to the characteristics of regular solution. The mixing energy parameter is −0.38 eV per atom. Therefore, in (Ti1−xAgx)3Ta solid solution, Ti atoms and Ag atoms are adjacent atoms to each other, and there is a strong interaction between them, that is, Ag atoms in the solid solution will not form segregation. The solid solubility curve and spontaneous decomposition curve as shown in Fig. 6(b), i.e. binodal curve and spinodal curve, can be further obtained by using the alloy transformation theory.34 The most important result is that the transition temperature Tc of (Ti1−xAgx)3Ta solid solution is about 2200 K. Above this temperature, (Ti1−xAgx)3Ta becomes a stable solution. On this basis, the solubility curve at low solubility is further analyzed, and the results are shown in Fig. 6(c). It can be found that more Ag can be dissolved in Ti–25Ta matrix at high temperature. Therefore, after aging treatment, more Ag precipitates will be obtained in Ti–25Ta–xAg. This is consistent with the experimental observation in section 3.1. In fact, in order to understand the precipitation behavior of Ag more accurately, it is necessary to use the phase diagram as shown in ref. 35 and 36. However, the phase diagram of Ti–Ta–Ag ternary alloy is still lacking in the published literature. Under this situation, it is an effective choice to analyze the precipitation behavior of Ag by using solubility curve and limitation.3.3 Lattice constants of Ti–Ta–Ag ternary alloy
The most important characteristic of solid solution or alloy is that the structure and properties change regularly with the change of solid solubility. Fig. 7 shows the lattice constants of (Ti1−xAgx)3Ta solid solution obtained by first-principles calculation. It was found that the lattice constant of (Ti1−xAgx)3Ta solid solution changed discontinuously according to Vegard's law. When the solid solubility x is less than 0.8, the lattice constant changes according to the second-order Vegard's Law: the bending factors of lattice constants a and b are smaller, close to the first-order linear changes; and the bending factors of lattice constant c are larger. When the solid solution degree x is greater than 0.8, the lattice constant changes linearly according to the first order Vegard's law. In addition, it should be noted that the change direction of lattice constants a and b is opposite to that of lattice constant c. The variation range of lattice constants of (Ti1−xAgx)3Ta solid solution is less than 0.25 Å with the change of solid solubility. The results show that the volume effect of Ti–25Ta–xAg alloy is not obvious. In the calculation process, we found that the atomic displacement of (Ti1−xAgx)3Ta solid solution is small after structural optimization, and the crystal structure still keeps the characteristics of hexagonal close packed structure in the whole process of solid solubility x changing from 0 to 1. This is due to the fact that the radii of Ti and Ag atoms are quite close, so the internal reason for the discontinuous change of lattice constant of (Ti1−xAgx)3Ta solid solution is not the structural factor.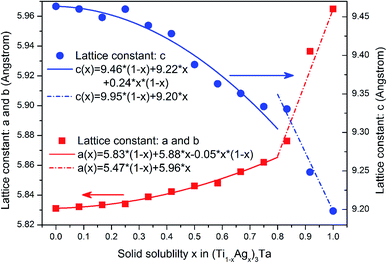 | ||
| Fig. 7 Lattice constant and its variation rule of (Ti1−xAgx)3Ta solid solution calculated by first-principles. | ||
3.4 Mechanical properties of Ti–Ta–Ag ternary alloy
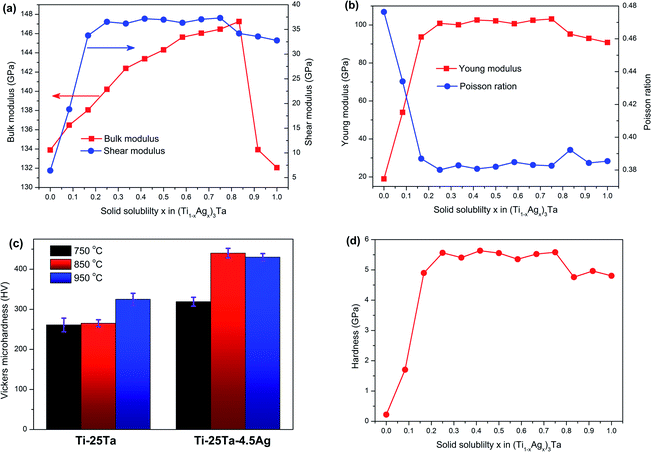
According to the basic theory of first-principle, the elastic constants of solid solution can be calculated conveniently, and the macroscopic mechanical properties reflecting the stability and resistance to external stress of (Ti1−xAgx)3Ta solid solution can be further analyzed. In order to investigate the effects of Ag addition on the mechanical properties of Ti–25Ta alloy, we further calculated the elastic constants of (Ti1−xAgx)3Ta solid solution. According to the calculation results, it is found that the elastic constant Cij of (Ti1−xAgx)3Ta solid solution satisfies born criterion during the change of solid solubility x from 0 to 1, indicating that the Ti–25Ta–xAg alloy is mechanically stable. Based on the calculation results of elastic constant Cij, the bulk elastic modulus B, shear modulus G, Young's modulus E and Poisson's ratio ν as shown in Fig. 8(a) and Fig. 8(b) can be obtained by Voigt–Reuss–Hill approximation method. It can be seen from the figure that except bulk elastic modulus, the other three mechanical properties increase sharply with the increase of x when the solid solubility x of Ag is less than 0.25. However, when the solid solubility x of Ag is greater than 0.25, the change range of these three mechanical properties is very small. The results show that the introduction of a small amount of Ag into Ti–25Ta alloy can significantly enhance the deformation resistance and stiffness of the alloy under shear stress, but also significantly reduce the plasticity and brittleness of the alloy. When the solid solubility x of Ag is less than 0.8, the bulk elastic modulus B increases linearly with the increase of x, which indicates that the ability of (Ti1−xAgx)3Ta solid solution to keep constant under pressure is gradually enhanced. However, when the solid solubility x of Ag is greater than 0.8, the deformation resistance of (Ti1−xAgx)3Ta solid solution decreases sharply.In order to characterize the effect of Ag precipitation on the wear resistance of Ti–25Ta–xAg alloy. Firstly, the micro mechanical properties of the samples were measured by nanoindentation. Fig. 8(c) shows the Vickers microhardness of Ti–25Ta–xAg samples with different Ag contents at different sintering temperatures. With the increase of sintering temperature, the density of Ti–25Ta–xAg alloy increases, which leads to the increase of hardness of the alloy with the increase of sintering temperature. At the same time, the modulus and hardness of α-Ti phase are the highest, followed by martensitic α′′, and β-Ti phase are the lowest. The morphology and energy spectrum analysis show that with the increase of sintering temperature, α-Ti phase and martensitic α′′ phase precipitate, while β-Ti phase gradually transforms into α-Ti phase, which also makes the hardness of Ti–25Ta–xAg alloy increase. The hardness of Ti–25Ta–xAg alloy increases significantly when Ag content is low, but the improvement of hardness is not obvious with the increase of Ag content, which is related to the precipitation of Ag in Ti–25Ta–xAg alloy. Using the relationship H = (1 − 2ν)E/6(1 + ν),37 we further estimated the hardness value of (Ti1−xAgx)3Ta solid solution, and the results are shown in Fig. 8(d). It can be seen from the figure that when the solid solubility x of Ag is less than 0.25, the hardness value of (Ti1−xAgx)3Ta solid solution increases rapidly with x; when x is greater than 0.25, the change range of hardness value tends to decrease. The theoretical calculation results are in good agreement with the experimental results. The hardness values measured in this work are similar to those of most commercial biocompatible materials, but lower than those of Ti1−xAux alloy developed by Svanidze et al.38 This suggests that Ti–Ta–Ag ternary alloy can be used as biomaterials, but its SPS preparation process needs to be further optimized to obtain better mechanical properties.
3.5 Electronic structure of Ti–Ta–Ag ternary alloy
In the above analysis of crystal structure and mechanical properties, we found that the lattice constants and mechanical properties of (Ti1−xAgx)3Ta solid solution will change obviously when x value of Ag solid solubility is equal to 0.8, and their changes will follow different laws. In the above analysis, we also proved that this change is independent of structural factors. In order to explore the internal mechanism, the electronic structure of (Ti1−xAgx)3Ta solid solution was further analyzed. Fig. 9 shows the density of states (DOS) diagrams of four typical solid solutions of (Ti1−xAgx)3Ta. It can be seen from the figure that the width of the conduction band peak of (Ti1−xAgx)3Ta solid solution is gradually narrowed with the increase of x value of Ag solid solution. At the same time, the density of states at Fermi level (EF) decreases with the increase of x value of Ag solid solubility. These two results indicate that the metallicity of (Ti1−xAgx)3Ta solid solution decreases with the increase of Ag solubility x. It is particularly noteworthy that the valence electron configuration of Ag is 4d105s1, in which the 4d10 electronic state is full-shell, so it shows a relatively narrow peak in the density of states diagram, belonging to the local electronic state. However, when the solid solubility x of Ag is greater than 0.8, the density of states peak corresponding to Ag-4d electronic states become wider and overlaps with Ta-5d electron states at Fermi level to form a new conduction band peak. This shows that the 4d10 electronic state of Ag has the characteristics of nonlocal electronic states. This situation is completely different from that when x value of Ag solid solubility is less than 0.8. Therefore, it can be considered that the internal reason for the sudden change of lattice constant and mechanical properties of (Ti1−xAgx)3Ta solid solution when x value of Ag solid solubility x is 0.8 is that the 4d10 electronic state of Ag changes from obvious local electronic state to local and nonlocal mixed electronic states.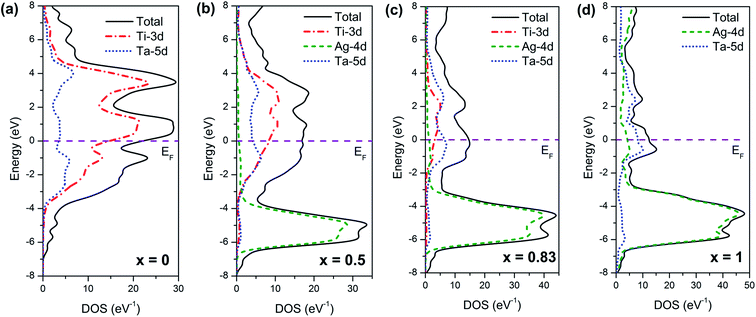 | ||
| Fig. 9 The density of states of typical (Ti1−xAgx)3Ta solid solutions calculated by first-principles: (a) x = 0, (b) x = 0.5, (c) x = 0.83, (d) x = 1. | ||
4. Conclusions
Ti–25Ta–xAg alloys with different Ag contents were prepared by spark plasma at different sintering temperatures. Through systematic phase and morphology analysis, it is found that Ti–25Ta–xAg sample is composed of α-Ti phase, martensite α′′ phase, β-Ti phase, a small amount of unmelted Ta, and Ag. Ag precipitates at the grain boundary, the size of precipitated particles is about 3 μm, and the amount of precipitation is less than 4.5 wt%. Nano indentation test and theoretical calculation show that low content of Ag can significantly enhance the hardness, deformation resistance and stiffness of Ti–25Ta–xAg alloy, but its plasticity and brittleness will be significantly reduced. The results of first-principles calculation show that the lattice constants and mechanical properties of (Ti1−xAgx)3Ta solid solution change obviously when the Ag solid solubility x is 0.8, and their changes will follow different laws. The intrinsic mechanism of this phenomenon is that the 4d10 electronic state of Ag changes from an obvious localized electronic states to local- and nonlocal-mixed electronic states. These results provide significant theoretical guidance for the application of Ti–Ta–Ag ternary alloys in biomedicine.Conflicts of interest
The authors declare no competing financial interests.Acknowledgements
The authors acknowledge financial support from the National Natural Science Foundation of China (Grant No. 11964015).References
- M. Niinomi, M. Nakai and J. Hieda, Acta Biomater., 2012, 8, 3888–3903 CrossRef CAS.
- Q. Chen and G. A. Thouas, Mater. Sci. Eng., R, 2015, 87, 1–57 CrossRef.
- J. L. Xu, L. Z. Bao, A. H. Liu, X. J. Jin, Y. X. Tong, J. M. Luo, Z. C. Zhong and Y. F. Zheng, Mater. Sci. Eng., C, 2015, 46, 387–393 CrossRef CAS.
- H. Wang, M. Cheng, J. Hu, C. Wang, S. Xu and C. C. Han, ACS Appl. Mater. Interfaces, 2013, 5, 11014–11021 CrossRef CAS.
- Z.-T. Yu, M.-H. Zhang, Y.-X. Tian, J. Cheng, X.-Q. Ma, H.-Y. Liu and C. Wang, Front. Mater. Sci., 2014, 8, 219–229 CrossRef.
- H. F. Li, K. J. Qiu, W. Yuan, F. Y. Zhou, B. L. Wang, L. Li, Y. F. Zheng and Y. H. Liu, Sci. Rep., 2016, 6, 37428 CrossRef CAS.
- M. F. Brunella, M. Bestetti and A. B. Markov, La Metallurgia Italiana, 2013, 105, 41–51 Search PubMed.
- R. Luo, Z. Liu, F. Yan, Y. Kong and Y. Zhang, Appl. Surf. Sci., 2013, 266, 57–61 CrossRef CAS.
- W.-T. Lee, J.-Y. Koak, Y.-J. Lim, S.-K. Kim, H.-B. Kwon and M.-J. Kim, J. Biomed. Mater. Res., Part B, 2012, 100, 1044–1052 CrossRef.
- H. Li, Y. Zheng, Y. T. Pei and J. T. M. De Hosson, J. Mater. Sci.: Mater. Med., 2014, 25, 1249–1255 CrossRef CAS.
- L.-C. Zhang and L.-Y. Chen, Adv. Eng. Mater., 2019, 21, 1801215 CrossRef.
- L.-C. Zhang, L.-Y. Chen and L. Wang, Adv. Eng. Mater., 2020, 22, 1901258 CrossRef CAS.
- L.-Y. Chen, Y.-W. Cui and L.-C. Zhang, Metals, 2020, 10, 1139 CrossRef.
- F. F. Cardoso, P. L. Ferrandini, E. S. N. Lopes, A. Cremasco and R. Caram, J. Mech. Behav. Biomed. Mater., 2014, 32, 31–38 CrossRef CAS.
- K. Zhuravleva, M. Bönisch, S. Scudino, M. Calin, L. Schultz, J. Eckert and A. Gebert, Powder Technol., 2014, 253, 166–171 CrossRef CAS.
- Y. L. Zhou, M. Niinomi, T. Akahori, H. Fukui and H. Toda, J. Mater. Sci. Eng. A, 2005, 398, 28–36 CrossRef.
- Y.-L. Zhou and M. Niinomi, Mater. Sci. Eng., C, 2009, 29, 1061–1065 CrossRef CAS.
- Y.-L. Zhou and M. Niinomi, J. Alloys Compd., 2008, 466, 535–542 CrossRef CAS.
- D. Mareci, R. Chelariu, D.-M. Gordin, G. Ungureanu and T. Gloriant, Acta Biomater., 2009, 5, 3625–3639 CrossRef CAS.
- Y. Zhou, J. Yang, T. He, H. Shi, X. Cheng and Y. Lu, Small, 2013, 9, 3445–3454 CrossRef CAS.
- Z. Zhang, J. Zhang, B. Zhang and J. Tang, Nanoscale, 2013, 5, 118–123 RSC.
- L. Hou, L. Li and Y. Zheng, J. Mater. Sci. Technol., 2013, 29, 330–338 CrossRef CAS.
- B. B. Zhang, Y. F. Zheng and Y. Liu, Dent. Mater., 2009, 25, 672–677 CrossRef CAS.
- L.-g. Hou, L. Li and Y.-f. Zheng, Trans. Nonferrous Met. Soc. China, 2013, 23, 1356–1366 CrossRef CAS.
- Y. F. Zheng, B. B. Zhang, B. L. Wang, Y. B. Wang, L. Li, Q. B. Yang and L. S. Cui, Acta Biomater., 2011, 7, 2758–2767 CrossRef CAS.
- K.-T. Oh, H.-M. Shim and K.-N. Kim, J. Biomed. Mater. Res., Part B, 2005, 74, 649–658 CrossRef.
- C. E. Albers, W. Hofstetter, K. A. Siebenrock, R. Landmann and F. M. Klenke, Nanotoxicology, 2013, 7, 30–36 CrossRef CAS.
- M. Wen, C. E. Wen, P. D. Hodgson and Y. C. Li, Key Eng. Mater., 2012, 520, 254–259 CAS.
- D. Chakravarty, C. S. Tiwary, C. F. Woellner, S. Radhakrishnan, S. Vinod, S. Ozden, P. A. da Silva Autreto, S. Bhowmick, S. Asif, S. A. Mani, D. S. Galvao and P. M. Ajayan, Adv. Mater., 2016, 28, 8959–8967 CrossRef CAS.
- S. J. Clark, M. D. Segall, C. J. Pickard, P. J. Hasnip, M. I. J. Probert, K. Refson and M. C. Payne, Z. Kristallogr., 2005, 220, 567–570 CAS.
- X.-M. Shao, L.-Y. Wang, J.-M. Zhang, M. Wen and Z.-Y. Zhao, Trans. Nonferrous Met. Soc. China, 2020, 30, 809–816 Search PubMed.
- L.-Y. Chen, T. Xu, S. Lu, Z.-X. Wang, S. Chen and L.-C. Zhang, Surf. Coat. Technol., 2018, 350, 436–444 CrossRef CAS.
- P. Sang, L.-Y. Chen, C. Zhao, Z.-X. Wang, H. Wang, S. Lu, D. Song, J.-H. Xu and L.-C. Zhang, Metals, 2019, 9, 1342 CrossRef CAS.
- J.-M. Xiao, Alloy Phase and Phase Transition, Metallurgical Industry Press, Beijing, 2008 Search PubMed.
- S. Kashyap, C. S. Tiwary and K. Chattopadhyay, J. Mater. Sci. Eng. A, 2013, 559, 74–85 CrossRef CAS.
- C. S. Tiwary, M. Paliwal, S. Kashyap, P. Pandey, S. Sarkar, I. Kundu, S. Bhaskar, I.-H. Jung, K. Chattopadhyay and D. Banerjee, J. Mater. Sci. Eng. A, 2020, 770, 138472 CrossRef CAS.
- R. C. D. Richardson, Wear, 1967, 10, 291–309 CrossRef CAS.
- E. Svanidze, T. Besara, M. F. Ozaydin, C. S. Tiwary, J. K. Wang, S. Radhakrishnan, S. Mani, Y. Xin, K. Han, H. Liang, T. Siegrist, P. M. Ajayan and E. Morosan, Sci. Adv., 2016, 2, e1600319 CrossRef.
| This journal is © The Royal Society of Chemistry 2021 |

