 Open Access Article
A computational perspective on the dynamic behaviour of recurrent drug resistance mutations in the pncA gene from Mycobacterium tuberculosis
Taimoor Khana,
Abbas Khan a,
Syed Shujait Alib,
Shahid Ali
 b and
Dong-Qing Wei
 *acd
*acd
aSchool of Life Sciences and Biotechnology, Shanghai Jiao Tong University, Shanghai, 200240, P.R. China. E-mail: dqwei@sjtu.edu.cn
bCenter for Biotechnology and Microbiology, University of Swat, Swat, KP, Pakistan
cState Key Laboratory of Microbial Metabolism, Shanghai-Islamabad-Belgrade Joint Innovation Center on Antibacterial Resistances, Joint Laboratory of International Cooperation in Metabolic and Developmental Sciences, Ministry of Education, School of Life Sciences and Biotechnology, Shanghai Jiao Tong University, Shanghai 200030, P.R. China
dPeng Cheng Laboratory, Vanke Cloud City Phase I Building 8, Xili Street, Nashan District, Shenzhen, Guangdong 518055, P.R. China
First published on 11th January 2021
Abstract
Tuberculosis is still one of the top 10 causes of death worldwide, particularly with the emergence of multidrug-resistant tuberculosis. As the most effective first-line anti-tuberculosis drug, pyrazinamide also develops resistance due to the mutation in the pncA gene. Among these mutations, seven mutations at positions F94L, F94S, K96N, K96R, G97C, G97D, and G97S are classified as high-level resistance mutations. However, the resistance mechanism of Mtb to PZA (pyrazinamide) caused by these mutations is still unclear. In this work, we combined molecular dynamics simulation, molecular mechanics/generalized-Born surface area calculation, principal component analysis, and free energy landscape analysis to explore the resistance mechanism of Mtb to PZA due to F94L, F94S, K96N, K96R, G97C, G97D, and G97S mutations, as well as compare interaction changes in wild-type and mutant PZA-bound complexes. The results of molecular mechanics/generalized-Born surface area calculations indicated that the binding free energy of PZA with seven mutants decreased. In mutant systems, the most significant interactions with His137 and Cys138 were lost. Besides, PCA and FEL confirmed significant variations in the protein dynamics during the simulation specifically by altering the Fe2+ binding and its destabilization. Furthermore, mutants also flipped the β-sheet 2, which also affects the binding of Fe2+ and PZA. In the G97D mutant, reported as most lethal, mutation causes the binding pocket to change considerably, so that the position of PZA has a large movement in the binding pocket. In this study, the resistance mechanism of PZA at the atomic level is proposed. The proposed drug-resistance mechanism will provide valuable guidance for the design of anti-tuberculosis drugs.
Introduction
Drug resistance is a significant challenge for potent drugs ineffective in the TB therapy. Pyrazinamide (PZA) is a core drug used in Mycobacterium tuberculosis (hereafter called Mtb) treatment. It has a proven synergistic effect along with rifampin (RIF) and isoniazid (INH) to shorten the Mtb treatment duration span from 9 to 6 months.1 Due to the complex underlying mechanism and complicated molecular basis, drug resistance by Mtb is of great concern. Bacterial pyrazinamidase enzyme (PZase) converts PZA into its active form pyrazinoic acid (POA),2 which inhibits the Mtb growth at low pH values.2 POA mainly targets the vital RpsA ribosomal protein S1 of M. tuberculosis.3 It also inhibits the fatty acid biosynthesis pathway by downregulating the FASI gene expression.4 POA also binds to aspartate decarboxylase (PanD)and inhibits the mycobacterial coenzyme A biosynthesis.5 PZase is encoded by the pncA gene of Mycobacterium tuberculosis (Mtb). Among predisposing genetic factors, the pyrazinamide resistance is driven by mutations in pyrazinamidase (pncA), which hinder the drug activation.6,7 Genotypic prediction suggests high sensitivity (91.3%) in pyrazinamide resistance due to mutations in the upstream of the pncA gene.6,8 Previous observations also suggest pncA mutations as significant (72–99%) contributors to the PZA resistance.9 The pncA gene is a potent antibiotic target and is absent in mammals.Mutations in PZase span from the coding region to the promoter region. Unlike other drugs, the INH and PZA drug resistance is more restricted to a specific small genomic region. Previously, Miotto et al. presented a comprehensive grading of mutations in the Mtb multi-drug-resistant.10 In this study, seven high-confidence re-current mutations in the metal binding site and PZA binding of PZase, namely F94L, F94S, K96N, K96R, G97C, G97D, and G97S were studied. These mutations dramatically affect the enzyme activity, and they were observed in the majority of investigations. The three-dimensional structure of PZase consists of six parallel β-sheets surrounded by a-helices.11 In the present study, we tried to analyze the molecular mechanism behind the PZA drug resistance in each mutation, namely, F94L, F94S, K96N, K96R, G97C, G97D and G97S. Mutations occurring in the pncA gene are associated with structural changes and are ultimately linked to pyrazinamide (PZA) resistance.12 In this regard, in silico techniques such as molecular docking and MD simulation were widely utilized to study protein dynamics in various environments.13–16 Computational methods are of great interest to explore biological mechanisms such as drug binding,17 DNA/RNA dynamics, and interaction and protein dynamics feature determination.18,19 They unveil conformational changes caused during the binding of the drug and target protein.20–22 Previous studies have also reported the drug resistance mechanism in Mycobacterium tuberculosis.23
In order to better explain the resistance mechanism, we analyzed mutations already known to have a stronger effect on the structure and function of the protein. The wild-type and mutant pncA interactions were studied to differentiate between the conformational changes in the presence of PZA. MD simulation of 200 ns was carried out to unveil the mechanism of drug resistance and conformational changes in PZase caused by these mutations. Native and mutant PZases in both the apo and PZA bound states were studied. The AutoDock Vina was used to dock PZA in the WT and three mutant PZases. The resultant conformation from the AutoDock was subjected to energy minimization. Subsequently, the minimized structures were simulated using the AMBER14 software package. Moreover, we performed multiple analyses on wild-type and mutants to know the role of these mutations in the mechanism of PZA resistance. Such investigations will aid in the better understanding of TB diagnosis, drug resistance mechanisms, and future therapeutic designs.
Material and methods
Retrieval of PZase and PZA
The three-dimensional structure of the PZase enzyme from Mycobacterium tuberculosis was retrieved from the PDB databank using the PDB ID 3PL1.11 The structure was checked for any missing atoms and chain breaks. The crystal water molecules were removed from the structure. The MOE structure preparation module was used to assign a correction protonation state and add any missing atoms. As there is no mutant crystal structure available for PZase, the PyMOL software was used to create PZase mutants.24 The mutagenesis module was used with default parameters to generate each mutant. The structure of the PZA molecule was downloaded from the PubChem database with accession ID CID1046.Molecular docking
The structure of the PZA molecule was downloaded in the 2D format from the PubChem database. The Open Babel software, version 8, was used to minimize the structure. To minimize the structure of the PZA molecule, universal force field was used. For the optimization purpose, the conjugate gradient algorithm was used. The minimized and optimized structure of PZA was docked into the binding pocket of the PZase enzyme using the AutoDock server.25 The default value for cluster RMSD, 4 Å, and the docking type were set to the protein-small ligand as the analysis parameter. The resultant top scoring complexes were subjected to molecular dynamics simulation using the Amber14 software. For interaction visualization molecular operating environment (MOE).50Molecular dynamics simulation
Molecular dynamics simulation was performed to check the stability of the PZA molecule in the active site of wild-type PZase and mutant PZase. Amber14 was used for MD simulation.26 FF14SB force field was used to define the protein. Eight systems WT, F94L, F94S, K96N, K96R, G97C, G97D, and G97S were subjected to MD simulation. Each system was solvated in a rectangular shape water box with a TIP3P water molecule. Subsequently, the counter ions were added to neutralize each system. The two steps of the energy minimization protocol were employed to remove the bad clashes in the system. In the first step, the steepest descent algorithm was used for 6000 cycles. In the second step, the conjugate gradient algorithm was used for 3000 cycles. After minimization, each system was heated up to 300 K. Subsequently, each system was equilibrated in two steps: in the first step, the systems were equilibrated at a constant pressure of 1 atm with a weak restraint. In the second step, the system was equilibrated without any restraint. Finally, the production step was run for 100 ns. The temperature of the system was controlled with a Langevin thermostat.27 The long-range electrostatic interaction was treated with the particle mesh Ewald algorithm with a cutoff distance of 10.0 Å.28 The SHAKE algorithm was used to treat the covalent bond.29 The GPU-supported PMEMD.CUDE performed the production step of molecular dynamics simulation for each system, and the CPPTRAJ package was used to analyze the trajectories in Amber 14.30Principal component analysis and Gibbs' free energy calculation
Principal component analysis was carried out to capture the high-amplitude fluctuations.31 Cpptraj package was used to calculate the covariance matrix considering Cα. Next, the covariance matrix was diagonalized to calculate the eigenvectors and eigenvalues. For high-amplitude fluctuations, the whole trajectory containing 5000 snapshots was used. The direction of motion is shown by the eigenvectors and the corresponding eigenvalues show the mean square fluctuation. The first principal component PC1 and the second principal component PC2 were plot against each other to monitor the motion. The lowest energy stable state of each system was captured through free energy landscape analysis (FEL). The minimal energy stable state is shown by the deep valleys, while the intermediate conformations are shown by boundaries between deep valleys.32 The g_sham module of Gromacs was used to construct the FEL. In the present study, the first two principal components were used to calculate the FEL based on the following equation:ΔG(PC1, PC2) = KB![[thin space (1/6-em)]](https://www.rsc.org/images/entities/char_2009.gif) ln ln![[thin space (1/6-em)]](https://www.rsc.org/images/entities/char_2009.gif) P(PC1, PC2) P(PC1, PC2) |
Binding affinity calculations
The binding free energy of WT and mutant PZases with the PZA molecule was calculated through the MMPBSA.py script.33–38 The last 10 ns equilibrated trajectory containing 500 snapshots was used to calculate the binding free energy. The binding free energy was calculated using the following equation:| ΔGbind = ΔGcomplex − [ΔGreceptor − ΔGligand] |
| G = Gbond + Gele + Gvdw + Gpol + Gnpol − TS |
Results
Binding modes of Fe2+ and PZA to the wild and mutant receptors
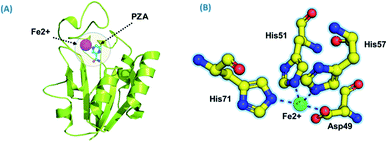
Using PDB ID 3PL1, the crystallized apo structure PZase was downloaded from the protein databank. Mutants F94L, F94S, G97C, G97D, G97S, K96N, and K96R were created by means of the mutagenesis module in the PyMOL software. All the structures were minimized prior to molecular docking to eliminate bad contacts between the newly mutated residues and also among other residues. Following the minimization process, the docking process was completed. As defined previously His71, Lys96, His137 and Cys138 were defined in the docking grid. Two residues, namely, His137 and Cys138 were reported to be involved in hydrogen bonding interactions with the oxygen atom of PZA. The complex structure of wild-type PZase and PZA is given in Fig. 1(A), while the Fe2+ binding pattern is given in Fig. 1(B). In the present study, similar results were obtained.The docking scores of all the complexes, including the wild type and mutants, are given in Table 1. It can be seen that the docking score for the wild type was reported to be −5.21 kcal mol−1. As given in Fig. 2, the interaction pattern of the wild type is different from that of the mutants. Among the key interactions formed by the His71 residue of the wild type with the nitrogen atom of the main scaffold of PZA. The PZA tail formed three interactions with Lys96, His137 and Cys138. The binding of the wild type with PZA shows stronger interactions with the most important residues. The docking score for the F94L mutant was reported to be −4.69 kcal mol−1. The only two interactions formed by F94L include His71 and Cys138. In the case of F94S, the docking score was reported to be −4.73 kcal mol−1. Residues Lys96 and Tyr103 were actively involved in the hydrogen bonding. Thus, this group of mutations affect the binding of PZA differently than the wild type. In the second group, three mutations G97C, G97D and G97S were investigated. The docking score for G97C substitution was reported to be −4.14 kcal mol−1, with three interactions with Lys96, Tyr103 and Cys138 residues. The G97D mutant docking score was reported to be −3.22 kcal mol−1. Among the total number of hydrogen bonds formed by the G97D mutant complex includes Lys96 and Tyr103. Herein, the key interaction with Cys138 is lost. The substitution G97S significantly affected the overall binding of PZA. The docking score for G97S, −4.94 kcal mol−1, was reported with only one interaction with Tyr103. This group of mutations significantly affected the binding of PZA. In the case of the K96N mutant, the docking score was reported to be −3.97 kcal mol−1, while for K96R, the docking score was reported to be −4.26 kcal mol−1. The K96N formed three key interactions with His71, Lys96 and Tyr103. The K96R mutations formed two key interactions with Lys96 and Tyr103. Hence, the docking results confirm that this specific substitution has an impact on the binding of PZA. The top scorer conformations were subjected to MD simulation to check the effect of the dynamics of the mutation on the PZase structure and binding strength with the PZA drug.
| S. no | Complex | Docking score |
|---|---|---|
| 1 | Wild | −5.21 kcal mol−1 |
| 2 | F94L | −4.69 kcal mol−1 |
| 3 | F94S | −4.73 kcal mol−1 |
| 4 | G97C | −4.14 kcal mol−1 |
| 5 | G97D | −3.22 kcal mol−1 |
| 6 | G97S | −4.94 kcal mol−1 |
| 7 | K96N | −3.97 kcal mol−1 |
| 8 | K96R | −4.26 kcal mol−1 |
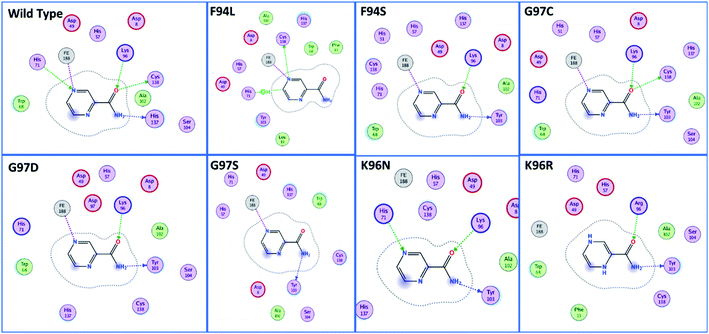 | ||
| Fig. 2 Binding patterns of the wild type and each mutant are shown. The mutants were grouped into three groups based on the substitution position. | ||
Dynamics stability of the wild and mutant systems
The dynamic behaviour of the wild and mutant (PZA bound) systems was accessed by the 200 ns simulation trajectory analysis. To determine the impact of mutations related to the structure–function features, different aspects were estimated. For the stability index, root-mean-square deviation (RMSD) of all the systems, including the wild type and seven mutants, was calculated. Since the start of the simulation, the RMSD of the wild-type systems has increased up to 5 Å. This trend was observed until 25 ns. Afterward, the system equilibrated, and the RMSD remained uniform until 200 ns. In this system (wild type), the average RMSD was observed to be 4.5 Å; however, no significant convergence was observed. A little stability drift between 140 and 150 ns was observed, which shows that the wild-type system remained stable during this 200 ns simulation time. For the mutants, we grouped the mutations based on the residue number. Two mutations reported in place of F94, three mutations in place of G97, while two mutations in K96 can be seen. In the first group, in the case of F94L, the stability followed the same pattern as wild types until 60 ns. The RMSD gradually increased up to 3.0 Å but then suddenly decreased and continued the same pattern until 125 ns. Later on, the complex reported consistent perturbation, and the stability converged significantly. It can be clearly seen that the RMSD significantly converged after 125 ns and remained unaltered until 200 ns. In the case of F94S, the structure showed a continuous increase in the RMSD until 170 ns. Afterward, significant convergence was observed. The average RMSD for the first 150 ns remained to be 2.5 Å, while for the remaining 50 ns, it increased up to 6.0 Å. Thus, these two mutations (F94L and F94S) induced structural de-stability during the simulation and caused internal structural perturbation.In the second group (G97C, G97D, and G97S), the mutation recurrence occurred three times. During the 200 ns simulation time, the complex G97C system remained stable for the first 120 ns. The average RMSF for the 120 ns remained to be 2.5 Å; however, the structure reported significant convergence afterward. This structural perturbation remained consistent, and the RMSD was reported to be 4.0 Å. In the case of G97D, a powerful de-stability effect was observed. For the first 10 ns, the RMSD increased up to 2.5 Å and then suddenly decreased. The systems showed a stable pattern for 20–50 ns, but then, a great perturbation was observed. The RMSD gradually increased up to 6.0 Å between 50 and 140 ns, and significant convergences were reported. Between 150 and 175 ns, the RMSD decreased and remained uniform but increased again and remained higher until 200 ns. This result (G97D) indicates the apparent effect of mutation-induced destabilization and, eventually, the impact on the binding of PZA. In the case of G97S, the RMSD remained uniform. The structure attained stability at 4.0 Å; however, no significant convergence was reported until 160 ns. Afterward, acceptable convergences between 160 and 200 ns with a lower RMSD were also reported.
In the third group, two replacements for K96 were reported. During the simulation, K96N showed a stable behaviour until 90 ns. However, a small convergence was observed between 90 and 100 ns. This system remained stable, and the average RMSD for this complex was reported to be 2.0 Å. In contrast, the K96R system remained unstable. Initially, for the first 75 ns, the average RMSD was reported to be 3.0 Å; however, a strong convergence between 75 and 100 ns with an increment in the RMSD was observed. Afterward, the RMSD decreased, and acceptable convergence until 200 was reported. RMSDs of all the systems are given in Fig. 3.
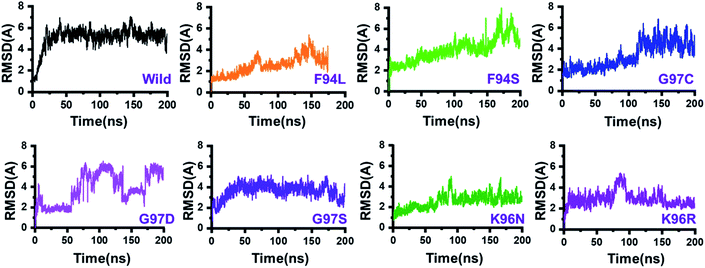 | ||
| Fig. 3 Dynamics stability of the wild-type and mutant systems. The x-axis shows the time in nanoseconds, while the y-axis shows RMSD in Å. | ||
Structural and residual flexibility of the wild-type and mutant systems
Root-mean-square fluctuation (RMSF) of all the systems, including the wild type and mutants, was calculated to understand the residual flexibility pattern of each system. In all the systems, a more similar pattern of flexibility was observed; however, the differences were spotted in the flexibility values. For the wild type, the lower RMSF values were reported. In the case of the first 50 residues, a similar pattern of flexibility was reported except for F94S, which showed a little higher fluctuation between 25 and 35 residues. For all the systems, the region between 50 and 75 fluctuated higher than any other region. The complex G97D reported to be highly destabilizing was found to have an unusual flexibility drift between 50 and 75 ns. Afterward, no significant flexibility drift was reported. These results significantly justify that the binding of PZA and the reported substations differently affected the residues' internal dynamics. RMSFs of all the systems are given in Fig. 4.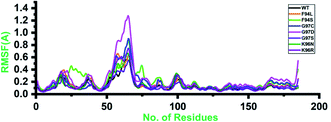 | ||
| Fig. 4 Residual flexibility of the wild-type and mutant systems. The x-axis shows the total number of residues, while the y-axis shows RMSF in Å. | ||
Structural compactness of the PZA-bound wild-type and mutant systems
In order to comprehend how these complexes behaved during the simulation time and how it impacted the structural compactness during molecular dynamics simulation, we calculated the radius of gyration (Rg) as a function of time (Fig. 5). Structural compactness of the wild-type and mutant systems is a defined feature that could help us grasp our understanding on how the internal dynamics are affected. In the case of the wild type, the average Rg value was reported to be 16.5 Å. Initially, until 15 ns, the Rg value increased from 15.5 Å to 17.0 Å. Afterward, the Rg value remained flat, and with time a gradual decrease in the Rg value was observed. In the mutants, this pattern was significantly different. As can be seen, the F94L mutant shows a higher Rg value than the wild type. The initial Rg value was reported to be 16.0 Å until 110 ns; however, significant convergence was observed, and the Rg value increased from 16.0 Å to 17.0 Å. The increased value remained uniform until 200 ns. In the case of F94S, the Rg value gradually increased until 200 ns, but no major convergence was observed except between 175 and 200 ns. In the other group of mutations, G97C started with a higher Rg value (17.0 Å) than the others. The Rg value remained uniform until 60 ns; however, significant convergence between 60 and 120 ns was reported. Afterward, the Rg value increased greatly, and the average Rg value for the last 80 ns remained to be 17.5 Å. In the case of G97D, the results are firmly in agreement with the RMSD results. The system significantly reported RMSD convergence.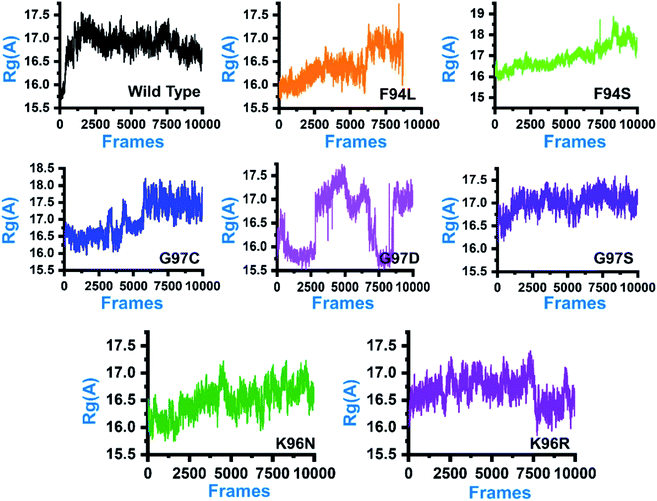 | ||
| Fig. 5 Structural compactness of the wild-type and mutant systems. The x-axis shows the total number of frames, while the y-axis shows Rg in Å. | ||
Similarly, here, the Rg value for G97D also remained very uncertain. The Rg value started from 16.5 Å and remained uniform until 50 ns, but significant convergence was observed, and until 150 ns, the Rg value was reported to be 17.5 Å. Afterward, the Rg remained lower at 16.0 Å between 150 and 175 ns, but again increased uncertainly up to 17.0 Å. In the case of G97S, the Rg value remained uniform until 200 ns. The average Rg value for G97S was reported to be 17.0 Å. The K96N system reported a continuous increment in the Rg value from 16.0 Å to 16.5 Å. A uniform Rg value for K96R was observed until 150 ns, and then suddenly, the Rg value decreased, and the average Rg value for the rest of the simulation time remained to be 16.0 Å. Overall, these results clearly explain how differently the internal dynamics of each system is impacted by the mutation and eventually contributed to the PZA resistance. The Rg values of all the systems are given in Fig. 5.
Dimensionality reduction and clustering of the protein motions
Principal component analysis (PCA) was conducted to explain the protein motion and clustering of the associated structural frames. PCA is a statistical approach that incorporates a smaller number of uncorrelated variables called principal components into several correlated variables. The eigenvectors were measured and provided in Fig. 6 to comprehensively explain the effect of the substitution on the protein motion.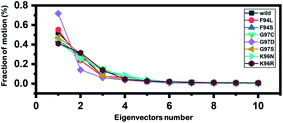 | ||
| Fig. 6 Fractions of the first ten eigenvectors. Using the MD trajectory, the fraction of motions was calculated and given in percentage against the eigenvector numbers. | ||
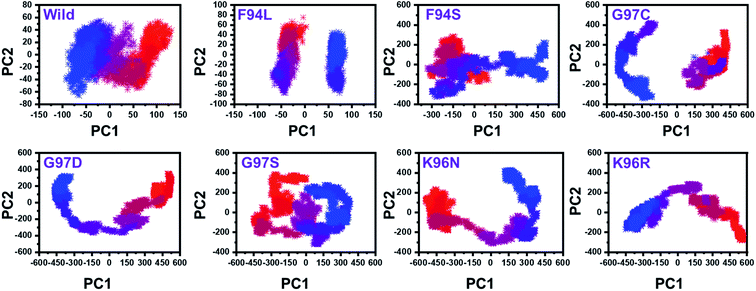
From the PCs, we can understand the overall and internal motions. In the wild type, the total contributed variance by the first three eigenvectors to the total motions was reported to be 52%. While in the case of F94L and F94S, the variance by the three eigenvectors was observed to be 55% and 42%, respectively. In the other group of mutations such as G97S, G97D, and G97C, the variance by the first three eigenvectors was reported to be 44%, 71%, and 47%, respectively. This confirms that G97D as shown in RMSD, RMSF, and Rg is also the most lethal mutation here too. In the case of K96N, the contributed variance by the first three eigenvectors to the total motions was reported to be 42%, while in the case of K96R, it was recorded to be 41%. The other eigenvectors are shown localized or overall motions. Hence, it is confirmed that the mutation has also impacted the total trajectory motion and, thus, the internal dynamics behaviour. To further gain convincible attributes, the first two PCs, i.e. PC1 and PC2, were drawn against each other. Different colours (red to blue) reflect the conformational transition from one to another. Each dot in Fig. 7 depicts a single frame of the trajectory. As compared to the WT, the mutant complexes covered a greater region of the phase space. Together, both of these observations suggest that mutations had a substantial influence on the structure that has contributed to the PZA drug resistance.
Destabilization of Fe2+ ion by mutation-induced conformational changes
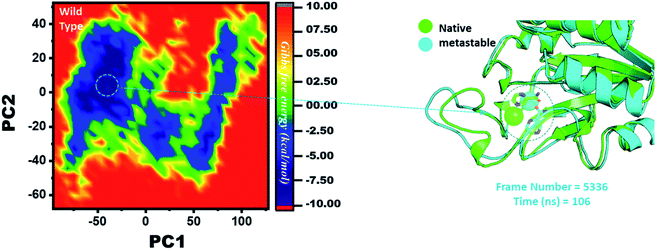
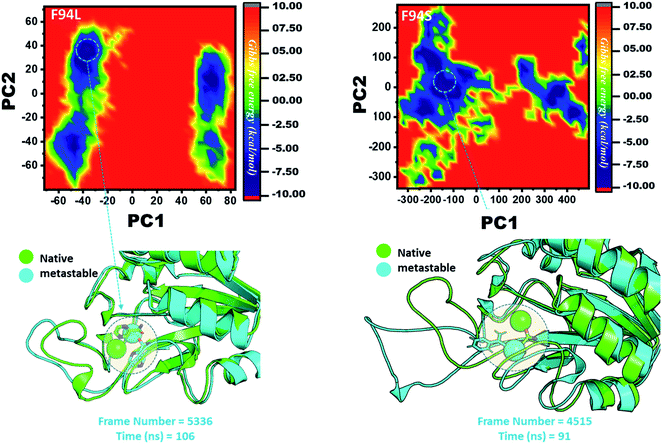
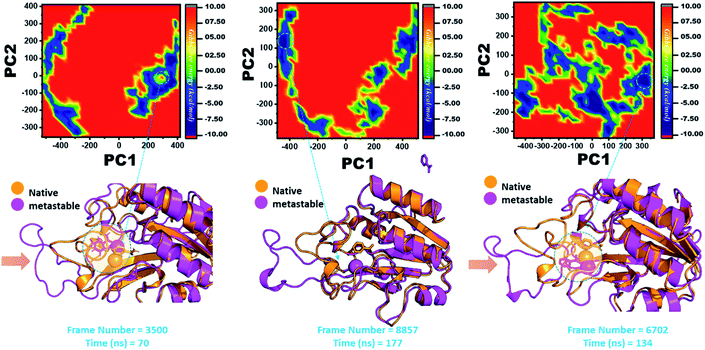
Three histidine residues and one asparagine residue coordinate the Fe2+ ion. Li/Merz ion parameters for the divalent Fe2+ ion were used to generate the topology. Mutation-induced Fe2+ destabilization during simulation was determined using the free energy landscape. It was found that Fe2+ is greatly influenced by the mutations. As given in RMSD and RMSF, the stability of each system is differentially affected, while the residual flexibility also showed variations. As presented in Fig. 8, the wild type possesses a similar topology to that of the native state. The lowest energy conformation was attained at 109 ns (frame number 4660). The only metastable state extracted from the wild-type trajectory is given below, which shows that the protein topology did not alter significantly during the simulation.However, as presented in Fig. 9, the mutant systems F94L and F94S showed destabilization of the Fe2+ ion. The structural coordinates extracted from the simulation trajectory at 106 ns (frame number 5336) represent the lowest conformation of F94L, while for F94S the structural coordinates are extracted from the simulation trajectory at 91 ns (frame number 4515). In the case of F94L and F94S, the Fe2+ ion is significantly affected by the transformation of the conformation.
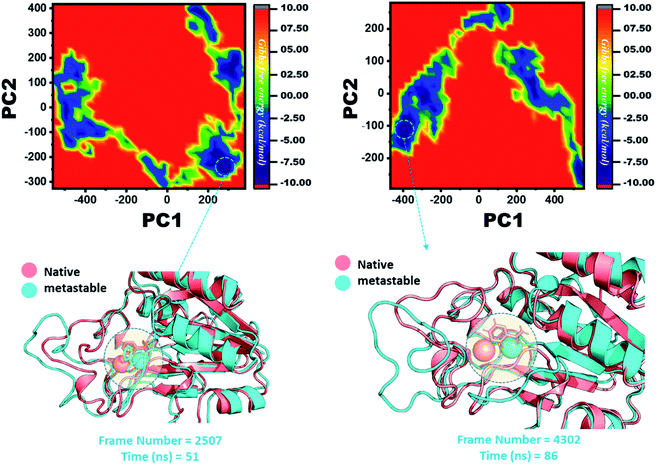
In the same way, in G97C, G97D, and G97S, a significant effect was observed, and the lowest energy conformation state for G97C was attained at 70 ns (frame number 3500). As given in RMSD and RMSF, the structural dynamics are not significantly affected by the F97C mutation, and hence, the effect is obvious. The results are uniform, and thus F94C is a comparatively less-lethal mutation than the others. However, as reported above, G97D was significantly involved in structural destabilization and Fe2+ rearrangements. Along with the Fe2+ replacement and distortion of the coordination, the β-sheet 2 also flipped and thus caused a displacement of Asp49 residues, which forms Fe2+ coordination along with the three histidine residues. The lowest conformational state of G97D was extracted at 170 ns (frame number 8857) after attaining the equilibrium.
In the case of G97S, the lowest energy conformation was extracted (frame number 6702) and compared with the native state. The comparison revealed that here the Fe2+ ion, along with the β-strand 2, is affected in a lower proportion than the other. Hence, these results indicate that the destabilization of the Fe2+ ion and the structural rearrangement of the protein may be the possible reasons behind resistance to PZA. The FEL graphs of G97C, G97D and F94S are given in Fig. 10.
The other group of mutants also produced a different effect. In the case of K96N and K96R, the lowest energy conformation was extracted (frame number 2507 and 4302) and compared with the native state. The comparison revealed that here the Fe2+ ion, along with the β-strand 2, is affected in a lower proportion by K96N than by K96R. Hence, these results indicate that the destabilization of the Fe2+ ion and the structural rearrangement of the protein may be the possible reasons behind the resistance to PZA. The FEL graphs of K96N and K96R are given in Fig. 11.
MMGBSA analysis to estimate the binding affinity
The MM-GBSA approach was employed to assess the binding affinity of the receptor and ligand.1,2 The last 10 ns trajectory, 500 snapshots, was used for the exploration of the dominant forces between the protein and ligand. The binding free energies of the seven mutants (F94L, F94S, G97C, G97D, G97S, K96N and K96R) and WT systems were calculated from the retrieved snapshots. The total binding free energies, ΔGbind, of WT and mutants (WT/-8.13, F94L/-5.17, F94S/-6.81, G97C/-4.31, G97D/-2.03, G97S/-0.25, K96N/-5.09, and K96R/-5.21) were calculated, and they are expressed in kcal mol−1 (Table 2).| Complex | vdW | Elec | ΔPS | SASA | ΔGbind |
|---|---|---|---|---|---|
| Wild | −19.25 | −23.37 | 23.48 | −3.19 | −8.13 |
| F94L | −15.37 | −14.21 | 17.15 | −5.24 | −5.17 |
| F94S | −2.34 | −79.44 | 77.25 | −2.28 | −6.81 |
| G97C | −2.20 | −71.50 | 80.71 | −1.58 | −4.31 |
| G97D | −2.48 | −98.95 | 85.20 | −2.16 | −2.03 |
| G97S | −0.80 | −0.85 | 0.13 | −0.04 | −0.25 |
| K96N | −3.09 | −92.37 | 97.70 | −2.13 | −5.09 |
| K96R | −3.65 | −91.22 | 91.24 | −3.12 | −5.21 |
The total energies of mutants compared to the WT indicate that these mutations drop the binding strength of PZA. The contribution of vdW, Elec, and ΔPS energies to the binding energies of the mutants compared to the WT was significantly low. It explores that the mutated proteins have a weak binding power to PZA. The mutations which are not involved in the direct interaction with PZA affect the orientation of the active site residues involved in direct contact with PZA.
Discussion
PZA was effectively used against Mtb, as the first-line drug during the treatment of TB. However, drug resistance poses a serious challenge to the global eradication of tuberculosis. The major and primary cause of development of resistance is mutation in the pncA gene. However, mutations in the rpsA and panD genes also contribute to the development of resistance to the PZA drug at a lower level. However, combined mutations in the pncA, rpsA and panD genes are also reported.14,39,40 New findings have helped to detect novel pncA gene mutations.41 Here, we investigated the high confidence–current mutations in the pncA gene to explore the associated mechanism of resistance against PZA. In the present study, we studied the resistant mechanism of seven recurrent mutations F94L, F94S, G97C, G97D, G97S, K96N and K96R included in high-confidence mutations. The data provide insights into the PZA resistance mechanism, which would be helpful in designing new anti-tuberculosis therapeutic approaches and strategies. Our analyses suggested different RMSD and RMSF values for native and mutant PZase, which reflects the stability of the native protein over mutants. A similar finding has also been reported in previous studies on native and mutant (W68R, W68G and K96R) PZase.42,43The docking results indicate the involvement of His137 and Cys138 in the formation hydrogen bonds with PZA, which has been reported in previous studies. The calculated docking score for the wild type was −5.21 kcal mol−1, whereas the docking scores for mutants, F94L (−4.69 kcal mol−1), F94S (−4.73 kcal mol−1), G97C (−4.14 kcal mol−1), G97D (−3.22 kcal mol−1), G97S (−4.94 kcal mol−1), K96N (−3.97 kcal mol−1) and for K96R (−4.26 kcal mol−1), were different from that of the wild type. The variation in these values indicates the effect of these substitutions on binding with PZA. The estimated RMSD values for wild-type as well as mutant-type systems are used to check the stability of the systems. The RMSD value for the wild-type system increased to 5 Å (at 25 ns), and after attainment of the equilibrium, the RMSD value remains uniform until 200 ns, whereas in mutant-type systems, fluctuations and perturbations were observed in all seven mutant systems. On the basis of residue numbers, these mutants are placed in three groups: F94 (F94L and F94S), G97 (G97C, G97D, and G97S) and K96 (K96N and K96R). The fluctuations and perturbations (highest in G97D) indicate destabilization, which has an impact on the binding of PZA.
The Rg pattern for the wild type and mutants is different. For the wild type, initially Rg increases from 15 Å to 17 Å and then it remains flat with a slight decrease at the end, whereas different patterns of increase/decrease are observed in mutants, particularly in G97D. These patterns suggest that the internal dynamics of each system is impacted by the mutation and eventually contributed to the PZA resistance. RMSD, RMSF, PC and Rg inferences suggest that G97D is the most lethal mutation and can contribute to the development of drug resistance.
Using computational modeling approaches, we first investigated the impact of these substitutions on the binding of the PZA drug. The initial results revealed that these recurrent mutations significantly affected the binding affinity as compared to the wild type. Previous studies have also reported similar results and suggested that the mutations near the active site and in the distal parts may affect the protein activity.44 In the mutant form, a reduction in the number of hydrogen bonds is observed, which affects the protein-ligand interactions. The molecular shifts associated with these mutations reduce the interactions between PZase and PZA, eventually leading to the development of PZA drug resistance.
Furthermore, we also explored the possible mechanism of the drug resistance caused by these mutations using biophysical methods. From 200 ns simulations, we revealed that the wild type remained stable, whereas in the mutant form (G97D), the protein destabilized significantly. AS reported earlier that the Fe2+ ion influences the catalysis of this enzyme activity;45–49 however, mutations can alter these activities. In the current research, novel mutations (F94L, F94S, G97C, G97D, G97S, K96N and K96R) in the pncA gene are shown to have a metal ion effect (Fe2+) on PZase, which is likely to influence the enzyme activity associated with the conversion of PZA into POA. The modification of the function of the enzyme during the conversion of PZA into POA leads to the development of resistance to PZA drugs.
In order to verify the effect of mutations on the function of PZase and to discover the factors responsible for the resistance provided to PZA drugs, comprehensive analyses were carried out. By altering the stability, flexibility and function of the enzyme, these mutations influence the activity of PZase during the conversion of PZA into POA. In latent TB therapy, mutations due to the modification of amino acid residues led to the unavailability of POA required for bacteriostatic and bactericidal activities. These findings provide insights into the mechanism of drug resistance due to mutations that alter protein properties and may thus contribute to the design of new medicines for the treatment of tuberculosis.
Conclusion
In summary, this study provides a deep insight into the mechanism of resistance caused by recurrent mutations. Our analysis suggests that G97D is the most destabilizing and highly resistant mutation, which significantly affects the protein dynamics. These results provide a structural insight, which could aid the development of new anti-tuberculosis drugs.Authors' contribution
TK conceptualized the study. TK and AK did the analysis. SSA and SA worked on the graphics. TK, AK, SSA, SA wrote the manuscript. DQW is an academic supervisor. He revised and proof read the manuscript and supervised the study.Availability of data and materials
All the data will be provided on reasonable demand.Funding
Dong-Qing Wei is supported by the grants from the Key Research Area Grant 2016YFA0501703 of the Ministry of Science and Technology of China, the National Natural Science Foundation of China (Contract no. 61832019, 61503244), the Natural Science Foundation of Henan Province (162300410060) and Joint Research Funds for Medical and Engineering and Scientific Research at Shanghai Jiao Tong University (YG2017ZD14).Conflicts of interest
The authors declare no conflict of interest.Acknowledgements
The computations were partially performed at the Center for High-Performance Computing, Shanghai Jiao Tong University. We are thankful to Prof. Dr. Zhiping Xie (School of Life Sciences and Biotechnology, Shanghai Jiao Tong University) for his guidance and support. We acknowledge their help.References
- M. A. Steele and R. M. Des Prez, Chest, 1988, 94, 845–850 CrossRef CAS.
- Y. Zhang and D. Mitchison, International Journal of Tuberculosis and Lung Disease, 2003, 7, 6–21 CAS.
- R. Shi, N. Itagaki and I. Sugawara, Mini-Rev. Med. Chem., 2007, 7, 1177–1185 CAS.
- O. Zimhony, J. S. Cox, J. T. Welch, C. Vilchèze and W. R. Jacobs, Nat. Med., 2000, 6, 1043–1047 CrossRef CAS.
- P. Gopal, W. Nartey, P. Ragunathan, J. Sarathy, F. Kaya, M. Yee, C. Setzer, M. S. S. Manimekalai, V. Dartois and G. Grüber, ACS Infect. Dis., 2017, 3, 807–819 CrossRef CAS.
- A. Scorpio and Y. Zhang, Nat. Med., 1996, 2, 662–667 CrossRef CAS.
- A. Scorpio, P. Lindholm-Levy, L. Heifets, R. Gilman, S. Siddiqi, M. Cynamon and Y. Zhang, Antimicrob. Agents Chemother., 1997, 41, 540–543 CrossRef CAS.
- K. Konno, F. M. Feldmann and W. McDermott, Am. Rev. Respir. Dis., 1967, 95, 461–469 CAS.
- Y. Zhang and W. Yew, International Journal of Tuberculosis and Lung Disease, 2009, 13, 1320–1330 CAS.
- P. Miotto, B. Tessema, E. Tagliani, L. Chindelevitch, A. M. Starks, C. Emerson, D. Hanna, P. S. Kim, R. Liwski and M. Zignol, Eur. Respir. J., 2017, 50 CrossRef CAS.
- S. Petrella, N. Gelus-Ziental, A. Maudry, C. Laurans, R. Boudjelloul and W. Sougakoff, PLoS One, 2011, 6, e15785 CrossRef CAS.
- X. Wu, W. Lu, Y. Shao, H. Song, G. Li, Y. Li, L. Zhu and C. Chen, Infect., Genet. Evol., 2019, 72, 147–150 CrossRef CAS.
- Z. Dolatkhah, S. Javanshir, A. S. Sadr, J. Hosseini and S. Sardari, J. Chem. Inf. Model., 2017, 57, 1246–1257 CrossRef CAS.
- M. Junaid, C.-D. Li, J. Li, A. Khan, S. S. Ali, S. B. Jamal, S. Saud, A. Ali and D.-Q. Wei, J. Biomol. Struct. Dyn., 2020, 1–14 CrossRef.
- V. Bhardwaj, R. Singh, P. Singh, R. Purohit and S. Kumar, J. Theor. Biol., 2020, 486, 110094 CrossRef CAS.
- R. Singh, V. Bhardwaj, P. Das and R. Purohit, J. Biomol. Struct. Dyn., 2020, 38, 5126–5135 CrossRef CAS.
- V. K. Bhardwaj, R. Singh, J. Sharma, P. Das and R. Purohit, Computer Methods and Programs in Biomedicine, 2020, 105494 CrossRef.
- V. K. Bhardwaj, R. Singh, J. Sharma, V. Rajendran, R. Purohit and S. Kumar, J. Biomol. Struct. Dyn., 2020, 1–13 Search PubMed.
- R. Singh, V. K. Bhardwaj, J. Sharma, P. Das and R. Purohit, Genomics, 2020, 1–9 Search PubMed.
- V. Bhardwaj and R. Purohit, J. Biomol. Struct. Dyn., 2019, 1963–1974 Search PubMed.
- V. K. Bhardwaj and R. Purohit, J. Biomol. Struct. Dyn., 2020, 1–17 Search PubMed.
- V. Bhardwaj and R. Purohit, Genomics, 2020, 3729–3738 CrossRef CAS.
- V. Rajendran and R. Sethumadhavan, J. Biomol. Struct. Dyn., 2014, 32, 209–221 CrossRef CAS.
- D. Scientific, C. San Carlos and W. L. DeLano, CCP4 Newsletter on Protein Crystallography, 2002, 2.40–40.44 Search PubMed.
- D. Schneidman-Duhovny, Y. Inbar, R. Nussinov and H. J. Wolfson, Nucleic Acids Res., 2005, 33, W363–W367 CrossRef CAS.
- R. Salomon-Ferrer, D. A. Case and R. C. Walker, Wiley Interdiscip. Rev.: Comput. Mol. Sci., 2013, 3, 198–210 CAS.
- R. Zwanzig, J. Stat. Phys., 1973, 9, 215–220 CrossRef.
- T. Darden, D. York and L. Pedersen, J. Chem. Phys., 1993, 98, 10089–10092 CrossRef CAS.
- J.-P. Ryckaert, G. Ciccotti and H. J. Berendsen, J. Comput. Phys., 1977, 23, 327–341 CrossRef CAS.
- A. W. Gotz, M. J. Williamson, D. Xu, D. Poole, S. Le Grand and R. C. Walker, J. Chem. Theory Comput., 2012, 8, 1542–1555 CrossRef CAS.
- A. Amadei, A. B. Linssen and H. J. Berendsen, Proteins, 1993, 17, 412–425 CrossRef CAS.
- T. X. Hoang, A. Trovato, F. Seno, J. R. Banavar and A. Maritan, Proc. Natl. Acad. Sci. U. S. A., 2004, 101, 7960–7964 CrossRef CAS.
- B. R. Miller 3rd, T. D. McGee Jr, J. M. Swails, N. Homeyer, H. Gohlke and A. E. Roitberg, J. Chem. Theory Comput., 2012, 8, 3314–3321 CrossRef.
- F. Chen, H. Liu, H. Sun, P. Pan, Y. Li, D. Li and T. Hou, Phys. Chem. Chem. Phys., 2016, 18, 22129–22139 RSC.
- H. Sun, L. Duan, F. Chen, H. Liu, Z. Wang, P. Pan, F. Zhu, J. Z. H. Zhang and T. Hou, Phys. Chem. Chem. Phys., 2018, 20, 14450–14460 RSC.
- L. Xu, H. Sun, Y. Li, J. Wang and T. Hou, J. Phys. Chem. B, 2013, 117, 8408–8421 CrossRef CAS.
- H. Sun, Y. Li, S. Tian, L. Xu and T. Hou, Phys. Chem. Chem. Phys., 2014, 16, 16719–16729 RSC.
- S. J. Lee, S. J. Shin, M. H. Lee, M.-G. Lee, T. H. Kang, W. S. Park, B. Y. Soh, J. H. Park, Y. K. Shin and H. W. Kim, PLoS One, 2014, 9, e104351 CrossRef.
- A. Akhmetova, U. Kozhamkulov, V. Bismilda, L. Chingissova, T. Abildaev, M. Dymova, M. Filipenko and E. Ramanculov, International Journal of Tuberculosis and Lung Disease, 2015, 19, 179–184 CrossRef CAS.
- W. Shi, J. Chen, J. Feng, P. Cui, S. Zhang, X. Weng, W. Zhang and Y. Zhang, Emerging Microbes Infect., 2014, 3, 1–8 CrossRef.
- S. I. Malik, S. Ali, N. Masood, T. Nadeem, A. S. Khan and M. T. Afzal, BMC Infect. Dis., 2019, 19, 116 CrossRef.
- M. Aggarwal, A. Singh, S. Grover, B. Pandey, A. Kumari and A. Grover, J. Cell. Biochem., 2018, 119, 2567–2578 CrossRef CAS.
- C. Vats, J. K. Dhanjal, S. Goyal, A. Gupta, N. Bharadvaja and A. Grover, BMC Genomics, 2015, 1–14 Search PubMed.
- J.-H. Yoon, J.-S. Nam, K.-J. Kim and Y.-T. Ro, World J. Microbiol. Biotechnol., 2014, 30, 2821–2828 CrossRef CAS.
- H. M. Baker, B. F. Anderson and E. N. Baker, Proc. Natl. Acad. Sci. U. S. A., 2003, 100, 3579–3583 CrossRef CAS.
- U. C. Chaturvedi and R. Shrivastava, FEMS Immunol. Med. Microbiol., 2005, 43, 105–114 CrossRef CAS.
- N. G. Leferink, C. R. Pudney, S. Brenner, D. J. Heyes, R. R. Eady, S. S. Hasnain, S. Hay, S. E. Rigby and N. S. Scrutton, FEBS Lett., 2012, 586, 578–584 CrossRef CAS.
- K. Salazar-Salinas, P. A. Baldera-Aguayo, J. J. Encomendero-Risco, M. Orihuela, P. Sheen, J. M. Seminario and M. Zimic, J. Phys. Chem. B, 2014, 118, 10065–10075 CrossRef CAS.
- M. M. Yamashita, L. Wesson, G. Eisenman and D. Eisenberg, Proc. Natl. Acad. Sci. U. S. A., 1990, 87, 5648–5652 CrossRef CAS.
- S. Vilar, G. Cozza and S. Moro, Curr. Top. Med. Chem., 2008, 8, 1555–1572 CrossRef CAS.
| This journal is © The Royal Society of Chemistry 2021 |

