 Open Access Article
Enhanced extraction of organophosphorus pesticides from fruit juices using magnetic effervescent tablets composed of the NiFe2O4@SiO2@PANI-IL nanocomposites†
Dechao Chen,
Sai Ma,
Xiaofan Zhang,
Xuedong Wang,
Ming Gao,
Jieyi Li* and
Huili Wang *
*
School of Environmental Science and Engineering, Suzhou University of Science and Technology, Suzhou 215009, China. E-mail: 100913915@qq.com; whuili@163.com; Fax: +86-512-68095950; Tel: +86-512-68095950
First published on 5th January 2021
Abstract
The reported ionic liquid (IL)-based magnetic effervescent tablets are a result of direct addition of ILs and magnetic nanoparticles (MNPs). In effervescent reaction-enhanced microextraction procedures, the dissociation between ILs and MNPs easily leads to loss of ILs due to aqueous solubility, thereby decreasing the extraction efficiency. Herein, we attached a hydrophilic IL ([BMIM]Br) onto the surface of NiFe2O4@SiO2@polyaniline (NiFe2O4@SiO2@PANI-IL) to prepare novel core–shell-like multi-layer nanocomposites. Magnetic effervescent tablets were composed of Na2CO3 as an alkaline source, tartaric acid as an acidic source and as-synthesized nanocomposites as an extractant. The nanocomposites were used in an effervescent reaction-enhanced magnetic solid-phase extraction (ERMSE) for the extraction of four organophosphorus pesticides (OPPs) in fruit juices prior to HPLC-DAD detection. Under optimized conditions, this method provided low limits of detection (0.06–0.17 μg L−1), high recoveries (80.6–97.3%) and excellent precision (1.1–5.2%) for OPP quantification in five fruit juices. Notably, the three-layer core–shell nanocomposites were efficiently recycled for at least eight extraction cycles with a recovery loss of <10%. The novelty of this study lies in: (1) for the first time, the ILs-based hybrid magnetic nanocomposites were prepared with appropriate pore size/volume and more active sites for OPPs; (2) the combination of the nanocomposites with effervescent tablets realizes rapid dispersion of CO2 bubbles, and convenient magnetic separation/collection into one synchronous step; and (3) due to there being no requirement of electrical power, it is feasible for use in field conditions. Thus, the ERMSE method has excellent potential for conventional monitoring of trace-level OPPs in complex fruit juice matrices.
1. Introduction
Organophosphorus pesticides (OPPs) play an important role in controlling agricultural insects; however, their high toxicity has raised great public concern, especially in various foods.1 The residues of OPPs in fruit juices constitute a serious risk to human health.2 The Chinese government set the maximum residue limits of 10–50 μg kg−1 for OPPs in fruits and their related products (GB2763-2016, China Food and Drug Administration).3 To ensure safety of fruit juices for human consumption, sensitive, rapid and robust analytical methodologies are required for OPP detection in fruit juices.Compared to traditional methods, magnetic solid-phase extraction (MSPE) overcomes several shortcomings, such as use of large volumes of organic solvent, requirement for specialized devices and time-consuming processing.4,5 Among magnetic adsorbents utilized for MSPE, magnetic nanoparticles (MNPs) are widely used in the adsorption of OPPs due to their excellent characteristics. Among them, NiFe2O4 has received wide attention because of its advantageous properties, such as high surface area and strong magnetic response.6–8 However, due to the high chemical reactivity of bare NiFe2O4, it readily oxidizes in air leading to a loss of dispersibility and adsorption capacity. Hence, a protective layer is often applied to ensure chemical stability and enhance dispersibility.9–11
Silica is often selected as a coating layer for NiFe2O4 MNPs because of its chemical stability, biocompatibility and ease for surface modification.9,10 For example, methyl blue was adsorbed from aqueous solution by magnetic 0.9NiFe2O4/0.1SiO2 nanocomposites.11 Some modification of nanocomposite surfaces by either functionalization or coating with other solid support or functional groups (e.g., natural, conductive, and synthetic polymers) is required to enhance resolution and extraction efficiency.12 Among the conductive polymers, polyaniline (PANI) has attracted a great deal of attention due to its multifunctional properties (e.g., hydrophobicity, acid–base character, π–π interactions and electrical activity), easy synthesis and permeable porous structure.13,14 In the synthesis of PANI, it is possible to add amphiphilic compounds, called surfactants, which interact with each other to form molecular aggregates, called micelles, which form a porous media.15 Consequently, PANI is applied in separation science, in areas such as packing material in MSPE and fiber material for SPME.16 Especially, PANI has been modified with MNPs to extract various types of pollutants from environmental matrices, such as prepared Fe3O4@SiO2@polyaniline (PANI) MNPs to adsorb Se and Te,17 PANI nanofiber synthesized on graphene oxide (PANI-GO) surfaces for extraction of Pb2+ in food samples18 and restricted access macroporous magnetic polyaniline for coumarin detection in rat plasma.15
Ionic liquids (ILs) refer to a class of organic salts composed of various inorganic and organic anions and organic cations.19,20 By changing the structure of ionic moieties or polymerization, the properties of ILs can be modified and optimized for different target analytes.21 In recent years, ILs have been employed to increase the extraction efficiency by loading them onto the surface of polymers or MNPs,22 which can interact with organic chemicals via electrostatic interactions, hydrogen bonding, π–π stacking and hydrophilic/hydrophobic interactions. Generally, the prominent benefits of using ILs as coating materials on MNPs are to improve the selectivity, sensitivity and extraction efficiency for target analytes.23 Notably, the integration of ILs with PANI will supply more surface-active groups (e.g., carboxyl, hydroxyl and ammonium groups), yielding stronger molecular interactions between PANI-IL and targeted chemicals.
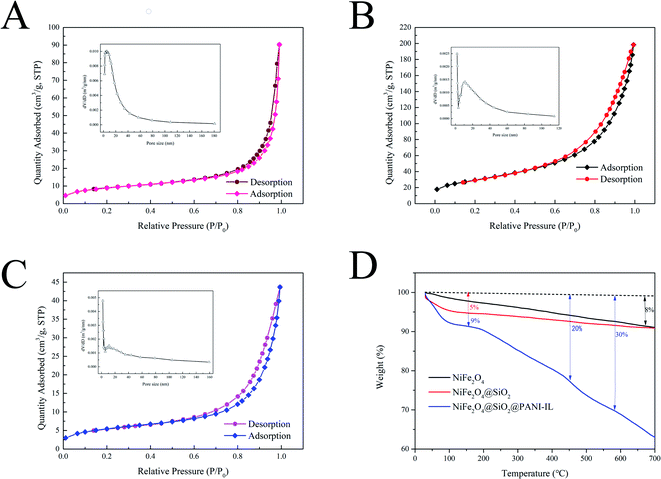
Based on the above considerations, magnetic nanocomposites based on the combination of NiFe2O4@SiO2, PANI and ILs were prepared, hereafter referred to as NiFe2O4@SiO2@PANI-IL. The MNPs were employed as an adsorbent in an effervescent reaction-enhanced microextraction for efficient extraction of OPPs in fruit juices. The NiFe2O4@SiO2@PANI-IL nanocomposites demonstrated several advantages aimed at improving the dispersibility of nanocomposites and extraction efficiency, such as moderate specific surface area and pore size, an abundance of surface-active groups, rapid magnetic separation and reduced agglomeration of nanoparticles. Nowadays, effervescent reaction-enhanced microextraction is based on a simple reaction that generates CO2 bubbles, which accelerates the dispersion of MNPs in solution.24,25 The process of magnetic effervescent tablet-assisted dispersive extraction can eliminate the use of dispersive solvents in microextraction, realize rapid magnetic separation, avoid centrifugation/stirring steps and save processing time.
The aim of this work was to develop a novel magnetic nanocomposite based on IL-coated NiFe2O4@SiO2@PANI hybrid MNPs. Subsequently, the hybrid nanocomposites were employed in an effervescent reaction-enhanced magnetic solid-phase extraction (ERMSE) for preconcentration/extraction of four common OPPs from fruit juice samples prior to detection by liquid chromatography. Under optimized conditions, the ERMSE methodology demonstrated efficient adsorption/extraction of trace-level OPPs, thereby showing excellent potential for routine monitoring of OPPs in fruit juices.
2. Experimental
2.1. Reagents and materials
Analytical standards for four OPPs (methamidophos, malathion, parathion, diazinon) with 99% purity, and analytical-grade FeCl3·6H2O and Ni(NO3)2·6H2O were purchased from Zhongke Quality Inspection Biotechnology (Beijing, China). Chromatographic-grade methanol, acetonitrile, ethanol, acetone and ethyl acetate were obtained from Aladdin (Shanghai, China). A series of analytical-grade chemicals were acquired from Tansoole (Shanghai, China): sodium hydroxide (NaOH), sodium carbonate (Na2CO3), hydrochloride acid (HCl), polyethylene glycol (PEG), tartaric acid (TTA), tetraethoxysilane (TEOS), aniline, ammonium persulfate (APS) and the ionic liquid, 1-butyl-3-methylimidazolium bromide ([BMIM]Br). Each OPP standard was dissolved in methanol to prepare a stock solution (100 mg L−1) and stored at 4 °C. Ultrapure water (>18.2 MΩ-cm, Millipore, Billerica, MA, USA) was used throughout this study. The 0.22 μm nylon (NL) and 0.45 μm polyether sulfone (PES) membrane filters were purchased from Anpel Scientific Instrument (Shanghai, China).2.2. Instrumentation
Quantification of OPPs was performed on a Shimadzu HPLC-DAD (LC-20AT). A Zorbax Eclipse XDB-C18 column (5 μm, 150 mm × 4.6 mm) was used for separating the analytes. HPLC-DAD operational conditions were as follows: flow rate, 0.9 mL min−1; column temperature, 30 °C; mobile phase, methanol–water at 65%:35% v/v; detection wavelength, 270 nm and injection volume, 20 μL. The structure and morphology of nanomaterials were characterized by scanning electron microscopy (SEM, Sigma300, Germany) and transmission electron microscopy (TEM, JEM2010, USA). Fourier-transform infrared (FT-IR) spectra were recorded on a Nicolet IS50 spectrometer with a range of 400–4000 cm−1. Powder X-ray diffraction (XRD) of nanomaterials was obtained by an EDX-720 X-ray power diffractometer (Agilent, USA) with a Cu Kα source (1.54056 Å) at room temperature between 5° and 90° 2θ. Brunauer–Emmett–Teller (BET) surface area was measured by N2 adsorption–desorption at 77 K using an ASAP 2020 system (Quantachrome, USA). Magnetic properties were investigated using a vibrating sample magnetometer (VSM, San Diego, CA, USA) with an applied field between −20![[thin space (1/6-em)]](https://www.rsc.org/images/entities/char_2009.gif) 000 Oe and 20
000 Oe and 20![[thin space (1/6-em)]](https://www.rsc.org/images/entities/char_2009.gif) 000 Oe at room temperature. Zeta potential was measured using a zeta potential analyzer (Malvern, UK). Thermogravimetric analysis (TGA) was determined at a heating rate of 10 °C min−1 over a temperature range of 50 to 700 °C under nitrogen flow (SDT Q600 Thermal Analyzer, Perkin Elmer, Waltham, MA, USA).
000 Oe at room temperature. Zeta potential was measured using a zeta potential analyzer (Malvern, UK). Thermogravimetric analysis (TGA) was determined at a heating rate of 10 °C min−1 over a temperature range of 50 to 700 °C under nitrogen flow (SDT Q600 Thermal Analyzer, Perkin Elmer, Waltham, MA, USA).
2.3. Synthesis of NiFe2O4@SiO2@PANI-IL nanocomposites
2.4. Preparation of the magnetic effervescent tablets
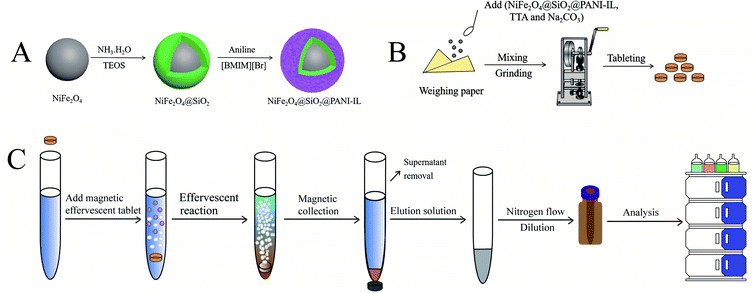
Initially, Na2CO3 and TTA were dried in an oven for 1 h at 60 °C and stored in a desiccator before use. Then, a mixture of Na2CO3 (212 mg) and TTA (300 mg), and 15 mg of prepared NiFe2O4@SiO2@PANI-IL nanocomposites were mixed and manually blended in an agate mortar. After grinding, the power was compressed into a magnetic effervescent tablet (8 mm diameter × 2.5 mm thickness) by a 5T/8MM 5T Punch Press (Shanghai, China). The as-pressed effervescent tablets were stored in a desiccator at room temperature prior to use (Fig. 1B).2.5. Fruit juice sample preparation
Five types of fruit juice samples (apple, pear, orange, peach and mango) were provided by Jialefu Supermarket (Suzhou, China). Aliquots (30 mL) of the fresh juice samples were centrifuged at 5000 rpm for 10 min and the supernatants filtered through a 0.45 μm membrane filter. Finally, the filtrate was diluted 1![[thin space (1/6-em)]](https://www.rsc.org/images/entities/char_2009.gif) :
:![[thin space (1/6-em)]](https://www.rsc.org/images/entities/char_2009.gif) 2 using Milli-Q ultrapure water for use in the following ERMSE procedures.
2 using Milli-Q ultrapure water for use in the following ERMSE procedures.
2.6. ERMSE procedures
A schematic illustration of the ERMSE method is depicted in Fig. 1C. First, an aliquot (8 mL) of the pretreated juice was introduced into a 15 mL conical centrifuge tube. Next, a magnetic effervescent tablet was placed into the tube where it produced a vigorous reaction of bubbles (CO2) throughout the reaction vessel. The effervescent tablet remained active for ∼3–4 min, resulting in homogeneous dispersion of the nanocomposites throughout the aqueous solution. Then, the nanocomposite adsorbent enriched with the analytes was collected by placing an external magnet alongside the centrifuge tube. The supernatant was carefully discarded by pipette, and an appropriate volume of elution solvent added to elude the OPPs from the nanocomposites. The collected eluate was filtered using a 0.45 μm filter, and redissolved in 100 μL methanol after being dried with a gentle nitrogen gas flow. Finally, 20 μL of the resulting solution was subjected to HPLC/DAD detection.3. Result and discussion
3.1. Characterization of NiFe2O4@SiO2@PANI-IL MNPs
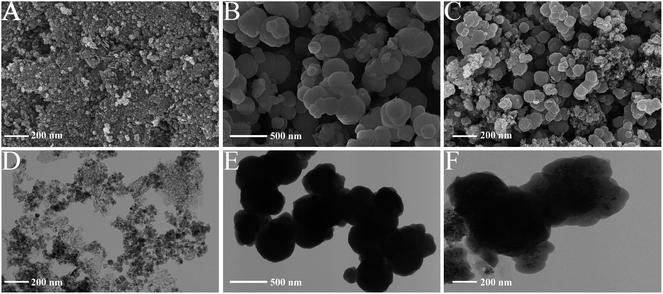
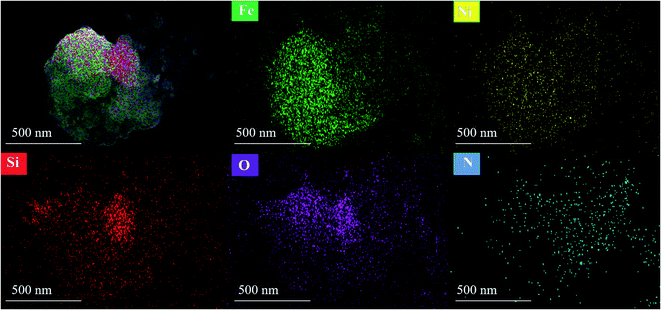
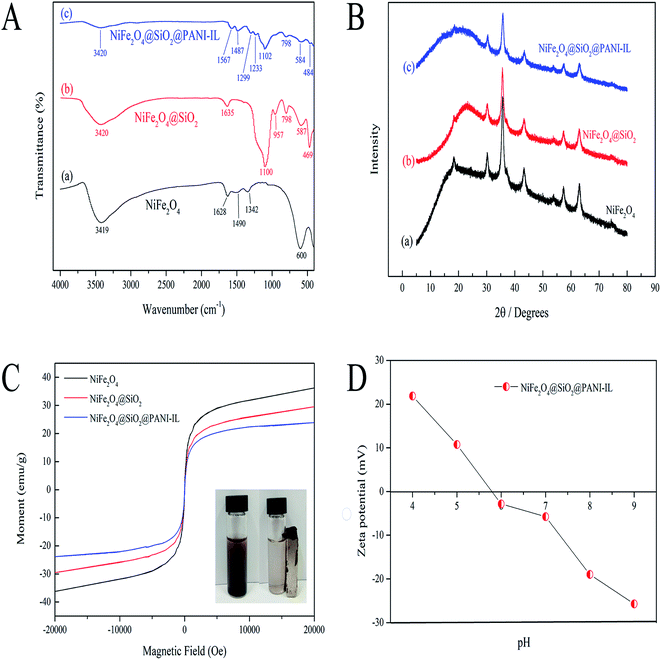
![[double bond, length as m-dash]](https://www.rsc.org/images/entities/char_e001.gif) O, N–O and O–H, respectively. Compared to the NiFe2O4 spectrum, new peaks around 700–1000 and 1100 cm−1 appeared in both NiFe2O4@SiO2 and NiFe2O4@SiO2@PANI-IL nanocomposites, which were attributed to the C–H stretching vibration and Si–O–Si lattice vibration of SiO2, respectively. These results indicate that SiO2 was successfully encapsulated on the surface of the NiFe2O4 MNPs by physical and chemical adsorption. The peaks at 1299 and 1487 cm−1 were related to the C
O, N–O and O–H, respectively. Compared to the NiFe2O4 spectrum, new peaks around 700–1000 and 1100 cm−1 appeared in both NiFe2O4@SiO2 and NiFe2O4@SiO2@PANI-IL nanocomposites, which were attributed to the C–H stretching vibration and Si–O–Si lattice vibration of SiO2, respectively. These results indicate that SiO2 was successfully encapsulated on the surface of the NiFe2O4 MNPs by physical and chemical adsorption. The peaks at 1299 and 1487 cm−1 were related to the C![[double bond, length as m-dash]](https://www.rsc.org/images/entities/char_e001.gif) O and C
O and C![[double bond, length as m-dash]](https://www.rsc.org/images/entities/char_e001.gif) C groups of PANI-IL. The typical stretching vibration peak of C
C groups of PANI-IL. The typical stretching vibration peak of C![[double bond, length as m-dash]](https://www.rsc.org/images/entities/char_e001.gif) N at 1233 cm−1, resulting from PANI and [BMIM]Br, indicated that the PANI-IL was successfully attached onto the surface of NiFe2O4@SiO2. Hence, FT-IR analysis verified the successful preparation of the NiFe2O4@SiO2@PANI-IL nanocomposites.
N at 1233 cm−1, resulting from PANI and [BMIM]Br, indicated that the PANI-IL was successfully attached onto the surface of NiFe2O4@SiO2. Hence, FT-IR analysis verified the successful preparation of the NiFe2O4@SiO2@PANI-IL nanocomposites.
3.2. Optimization of ERMSE operational parameters
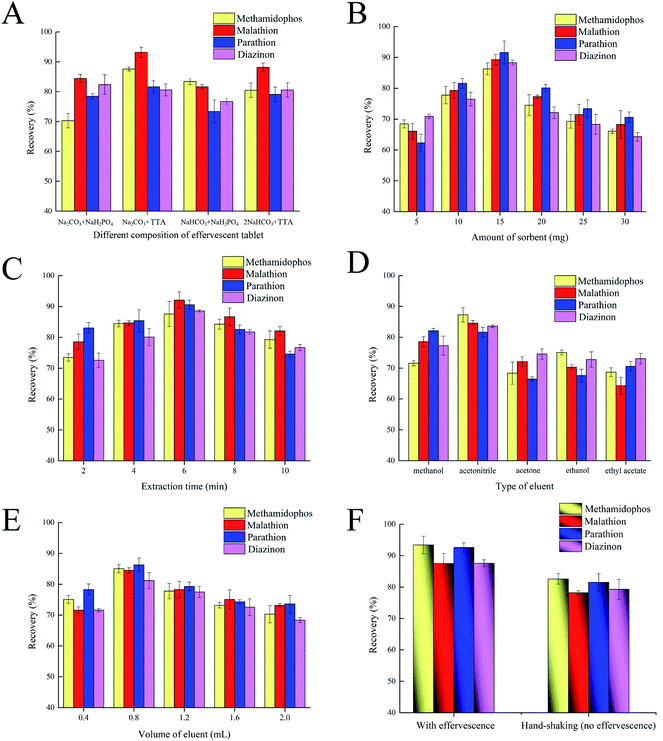
Elution solvent volume was examined over the range of 0.4 to 2.0 mL for ERs of the four OPPs. The ERs increased from 0.4 to 0.8 mL of acetonitrile, but decreased with further increases from 0.8 to 2.0 mL (Fig. 6E). When the volume of elution solvent was <0.8 mL, OPPs were not completely desorbed, which consequently contributed to a lower ER. Theoretically, the larger the volume of eluent, the higher the extraction recovery. However, the volume of eluent is always chosen as a compromise between achieving complete immersion of the nanomaterials and minimizing analyte dilution to reduce the required volume of elution solvent.32 In this investigation, when the volume of acetonitrile was larger than 0.8 mL, the hybrid nanocomposites were over-immersed. Under such circumstance, due to saturated or excessive adsorption by nanocomposites, the volume of eluent collected after elution would be greatly lost, thus leading to the decrease of extraction recovery. Thus, an elution solvent volume of 0.8 mL was selected as the optimum volume.
Based on the optimization studies, the selected experimental conditions were: Na2CO3 + TTA as tablet acidic and alkaline sources; eluent, 0.8 mL of acetonitrile; composite mass, 15 mg; and extraction/adsorption time, 6 min.
3.3. Comparison of ERs with effervescence and no effervescence (hand-shaking)
To evaluate whether an effervescent reaction is conductive to enhanced dispersive efficiency for the NiFe2O4@SiO2@PANI-IL nanocomposites, we compared the ERs for OPPs in the presence or absence of effervescent reaction. Direct addition of nanocomposites with a 4 min hand-shaking yielded ERs for the four OPPs in the range of 79.3 to 85.4% (Fig. 6F). In contrast, use of the effervescent tablets (CO2 bubbles lasting for ∼4 min) increased the average ERs to the range of 88.4 to 93.7%, an absolute increase of ∼9.0% as compared to hand-shaking treatments. In particular, ERs for methamidophos and parathion reached as high as 93.7 and 92.8%, respectively, upon effervescent reaction (Fig. 6F). Therefore, we posit that integration of NiFe2O4@SiO2@PANI-IL into the effervescent tablet contributed to greater dispersion of the nanocomposites, thereby increasing the ERs for OPPs in the ERMSE method. Moreover, utilization of effervescent tablets avoids the need for an external physical energy source, such as ultrasound or vortexing, making the methodology feasible for remote and outdoor use.3.4. Comparison of ERs by NiFe2O4, NiFe2O4@SiO2 and NiFe2O4@SiO2@PANI-IL
The effects of SiO2 and PANI-IL coatings on the ERs for OPPs were investigated among the three MNPs (NiFe2O4, NiFe2O4@SiO2 and NiFe2O4@SiO2@PANI-IL) using the aforementioned optimized conditions. When NiFe2O4 was used as the adsorbent/extractant, the average ER for OPPs was 56.7%, which compared to 75.4 % for the NiFe2O4@SiO2 treatment (Fig. S1†). This ∼19% increase in ERs can be ascribed to the SiO2-coated NiFe2O4 having increased contact area with analytes in the aqueous solution and reduced agglomeration of MNPs, thereby improving the adsorption efficiency. In contrast, SiO2@PANI-IL-coated NiFe2O4 nanoparticles yielded average ERs as high as 88.3%, an increase of ca. 31% and 13% over those of NiFe2O4 and NiFe2O4@SiO2, respectively. These results demonstrate that the introduction of SiO2, PANI and IL onto the surface of NiFe2O4 nanoparticles prominently enhance adsorption/extraction efficiency for OPPs.3.5. Validation of the ERMSE/HPLC-DAD method
Under optimized conditions, this proposed method was evaluated in the context of linear range (LR), coefficient of determination (R2), limits of detection (LODs, based on S/N = 3), limits of quantitation (LOQs, based on S/N = 10), as well as intra- and inter-day precisions. The LRs were 0.21–0.58–500 μg L−1 for methamidophos, malathion, parathion and diazinon (Table 1). R2 values ranged from 0.9945 to 0.9991, and the LODs and LOQs were 0.06–0.17 μg L−1 and 0.21–0.58 μg L−1 for the four OPPs, respectively. Intra- and inter-day precisions, expressed as relative standard deviations (RSDs), were 1.5–4.3% and 1.1–5.2%, respectively, at three fortification levels (5, 20 and 200 μg L−1; n = 6).| Analyte | Liner range (μg L−1) | R2 | LODs (μg L−1) | LOQs (μg L−1) | Intra-day RSDs (%, n = 6) | Inter-day RSDs (%, n = 6) | ||||
|---|---|---|---|---|---|---|---|---|---|---|
| Low | Medium | High | Low | Medium | High | |||||
| a (1) LRs, linear ranges; R2, coefficients of determination; LODs, limits of detection at S/N = 3; LOQs, limits of quantitation at S/N = 10; and RSDs, relative standard deviations (n = 6). (2) Precision experiments were conducted under the following conditions: (a) OPPs at the three fortification levels in apple juice; (b) NiFe2O4@SiO2@PANI-IL nanocomposites as absorbent, 15 mg; acetonitrile as eluant, 0.8 mL; extraction time, 6 min; Na2CO3 + TTA, 8 mm diameter × 2.5 mm thickness. (3) “Low, Medium and High” indicates 5, 20 and 200 μg L−1 fortification levels in apple fruit samples, respectively. | ||||||||||
| Methamidophos | 0.45–500 | 0.9963 | 0.13 | 0.45 | 2.3 | 4.2 | 3.2 | 1.1 | 3.4 | 4.8 |
| Malathion | 0.37–500 | 0.9987 | 0.11 | 0.37 | 2.4 | 1.5 | 4.3 | 4.4 | 3.7 | 5.2 |
| Parathion | 0.17–500 | 0.9991 | 0.17 | 0.58 | 3.3 | 1.8 | 3.6 | 3.2 | 2.1 | 4.6 |
| Diazinon | 0.21–500 | 0.9945 | 0.06 | 0.21 | 1.9 | 3.8 | 3.5 | 2.8 | 4.5 | 3.6 |
3.6. Real sample analysis
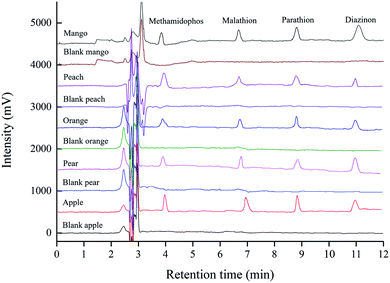
To evaluate real-world applicability, five fruit juice samples (apple, pear, orange, peach, mango) were extracted by the ERMSE method, and subsequently analyzed by HPLC/DAD. Good ERs were obtained for all four OPPs from the fruit juice samples: methamidophos = 81.3–96.5%, malathion = 80.6–95.4%, parathion (83.5–97.1%) and diazinon (81.4–97.3%) (Table 2). Fig. 7 shows typical chromatograms of the four OPPs detected in fruit juices by the ERMSE/HPLC-DAD method. In summary, the newly developed method satisfies the technical requirements for trace-level detection of OPPs in complex fruit juice matrices with high precision and accuracy.| Sample | Methamidophos | Malathion | Parathion | Diazinon | ||||||||
|---|---|---|---|---|---|---|---|---|---|---|---|---|
| Added (μg L−1) | Found (μg L−1) | ER (%) | Added (μg L−1) | Found (μg L−1) | ER (%) | Added (μg L−1) | Found (μg L−1) | ER (%) | Added (μg L−1) | Found (μg L−1) | ER (%) | |
| a (1) ER indicates extraction recovery; (2) each treatment includes three replicates (n = 3); (3) each detected value is mean ± SD (standard deviation, n = 3); (4) experimental conditions: NiFe2O4@SiO2@PANI-IL as absorbent, 15 mg; 0.8 mL of acetonitrile as eluent; extraction time, 6 min. | ||||||||||||
| Apple juice | 5 | 4.2 ± 0.04 | 84.3 | 5 | 4.8 ± 0.05 | 95.4 | 5 | 4.7 ± 0.02 | 94.6 | 5 | 4.6 ± 0.01 | 91.1 |
| 20 | 18.3 ± 0.13 | 91.3 | 20 | 18.6 ± 0.04 | 93.2 | 20 | 19.4 ± 0.17 | 97.1 | 20 | 17.5 ± 0.14 | 87.4 | |
| 200 | 191.2 ± 0.05 | 95.6 | 200 | 172.2 ± 0.28 | 86.1 | 200 | 173.2 ± 0.21 | 86.6 | 200 | 192.4 ± 0.37 | 96.2 | |
| Pear juice | 5 | 4.5 ± 0.06 | 90.2 | 5 | 4.4 ± 0.10 | 88.3 | 5 | 4.4 ± 0.03 | 87.1 | 5 | 4.3 ± 0.02 | 87.3 |
| 20 | 16.3 ± 0.21 | 81.3 | 20 | 18.2 ± 0.21 | 91.7 | 20 | 16.7 ± 0.24 | 83.5 | 20 | 16.5 ± 0.33 | 82.6 | |
| 200 | 177.2 ± 0.34 | 88.6 | 200 | 161.8 ± 0.35 | 80.9 | 200 | 182.0 ± 0.22 | 91.0 | 200 | 162.8 ± 0.24 | 81.4 | |
| Orange juice | 5 | 4.8 ± 0.01 | 96.5 | 5 | 4.7 ± 0.02 | 93.6 | 5 | 4.4 ± 0.04 | 88.6 | 5 | 4.7 ± 0.02 | 93.5 |
| 20 | 18.9 ± 0.54 | 94.3 | 20 | 16.1 ± 0.25 | 80.6 | 20 | 18.7 ± 0.13 | 93.4 | 20 | 18.9 ± 0.21 | 94.8 | |
| 200 | 166.2 ± 0.24 | 83.1 | 200 | 175.0 ± 0.13 | 87.5 | 200 | 179.4 ± 0.28 | 89.7 | 200 | 191.0 ± 0.30 | 95.5 | |
| Peach juice | 5 | 4.2 ± 0.08 | 84.3 | 5 | 4.6 ± 0.01 | 91.6 | 5 | 4.3 ± 0.02 | 85.3 | 5 | 4.9 ± 0.01 | 97.3 |
| 20 | 16.6 ± 0.15 | 82.9 | 20 | 17.7 ± 0.22 | 88.4 | 20 | 19.4 ± 0.08 | 96.8 | 20 | 17.5 ± 0.17 | 87.3 | |
| 200 | 178.2 ± 0.22 | 89.1 | 200 | 163.8 ± 0.18 | 81.9 | 200 | 170.6 ± 0.15 | 85.3 | 200 | 169.8 ± 0.41 | 84.9 | |
| Mango juice | 5 | 4.7 ± 0.11 | 93.7 | 5 | 4.2 ± 0.04 | 83.4 | 5 | 4.2 ± 0.03 | 84.5 | 5 | 4.5 ± 0.03 | 90.4 |
| 20 | 17.1 ± 0.23 | 85.5 | 20 | 18.7 ± 0.36 | 93.7 | 20 | 18.7 ± 0.19 | 93.6 | 20 | 17.8 ± 0.26 | 89.1 | |
| 200 | 181.2 ± 0.37 | 90.6 | 200 | 171.6 ± 0.21 | 85.8 | 200 | 188.4 ± 0.28 | 94.2 | 200 | 167.2 ± 0.33 | 83.6 | |
3.7. Recycling of the NiFe2O4@SiO2@PANI-IL nanocomposites
MNP reusability (i.e., recycling) is an important metric for improving the application potential of nanocomposites.33 We analyzed reusability of the NiFe2O4@SiO2@PANI-IL adsorbent by regenerating with three washing cycles of ethanol and water, and subsequent drying for use in another effervescent-tablet preparation and extraction cycle. As a result, the three-layer core–shell nanomaterial could be reused for at least eight cycles with ER losses of <10%, suggesting that the nanocomposites retains excellent recyclability and stability (Fig. S2†). Thus, the NiFe2O4@SiO2@PANI-IL nanomaterial possesses excellent characteristics for long-term use in the monitoring of trace OPPs in fruit juice samples.3.8. Comparison of the ERMSE/HPLC-DAD method with previously reported methods
A comparison of the present method with previously reported methods for the determination of OPPs was conducted in the context of type of adsorbent, RSD, LODs, extraction time and ERs (Table 3).4,5,28,29,34 The ERMSE/HPLC-DAD method has the following advantages: (1) it is fast with the whole adsorption/extraction process completed within 6 min. Effervescent tablet-assisted diffusion provides rapid and effective dispersion of the nanocomposites. The adsorption/extraction time (6 min) for the new method is prominently lower than those of MOFs-based MSPE (20 min)4 and Fe3O4@SiO2@KIT-6-based MSPE (10 min);5 (2) it possesses higher sensitivity for OPPs with LODs of 0.06–0.17 μg L−1 and higher repeatability with intra- and inter-day precisions of 1.1–5.2% as compared to those of MIL-101-based MSPE-HPLC-DAD (LODs of 0.3–1.5 μg L−1)4 and Fe3O4/C-based MSPE-HPLC-UV (LODs of 4.3–47.4 μg L−1).28 It provides comparable LODs with those of MHMS-MCNPs-based MSPE/HPLC-UV (0.07 μg L−1)29 and PIL-MNPs-based MSPE/HPLC-UV (0.01 μg L−1);34 (3) it avoids the utilization of traditional organic dispersive solvents (methanol, acetonitrile, acetone, etc.) in conventional microextraction procedures; (4) the utilization of a “green” solvent in the nanocomposites and recyclable MNCs make the method more environment friendly. Overall, the NiFe2O4@SiO2-PANI-IL-based ERMSE/HPLC-DAD method is simple, rapid, easy to use and benign to the environment, and thus shows great prospective for routine trace monitoring of OPP residues in complex fruit juice matrices.| Pretreatment method | Type of nanomaterial as adsorbent | RSD (%) | LOD (μg L−1) | Extraction time (min) | ERs (%) | References |
|---|---|---|---|---|---|---|
| a (1) MOFs, metal organic frameworks; (2) Fe3O4/C, carbon coated Fe3O4; (3) MHMS-MCNPs, mixed hemimicelle SDS-coated magnetic chitosan nanoparticles; (4) Fe3O4@SiO2@KIT-6, mesoporous KIT-6-magnetite composite; (5) PIL-MNPs, poly (ionic liquid) immobilized magnetic nanoparticles; (6) MSPE-HPLC-UV, magnetic solid-phase extraction combined with high-performance liquid chromatography-ultraviolet detection; (7) MSPE-HPLC-DAD, magnetic solid-phase extraction combined with high-performance liquid chromatography-diode array detection. | ||||||
| MSPE/HPLC-DAD | MOFs, MIL-101 | 1.1–7.8 | 0.3–1.5 | 20 | 80.2–107.5 | 7 |
| MSPE/HPLC-UV | Fe3O4/C | 2.7–7.6 | 4.3–47.4 | 5 | 79.6–103.5 | 36 |
| MSPE/HPLC-UV | MHMS-MCNPs | <4.6 | 0.07 | 3 | 74–104.8 | 29 |
| MSPE/HPLC-UV | Fe3O4@SiO2@KIT-6 | 0.1–5.5 | 0.005–0.01 | 10 | 86.6–98.8 | 8 |
| MSPE/HPLC-UV | PIL-MNPs | 4.5–11.3 | 0.01 | 2 | 81.4–112.6 | 34 |
| ETMSE/HPLC-DAD | NiFe2O4@SiO2@PANI-IL | 1.1–5.2 | 0.06–0.17 | 6 | 80.6–97.3 | This work |
3.9. Recycling of the NiFe2O4@SiO2@PANI-IL nanocomposites
MNP reusability (i.e., recycling) is an important metric for improving the application potential of nanocomposites.33 We analyzed reusability of the NiFe2O4@SiO2@PANI-IL adsorbent by regenerating with three washing cycles of ethanol and water, and subsequent drying for use in another effervescent-tablet preparation and extraction cycle. As a result, the three-layer core–shell nanomaterial could be reused for at least eight cycles with ER losses of <10%, suggesting that the nanocomposites retains excellent recyclability and stability (Fig. S2†). Thus, the NiFe2O4@SiO2@PANI-IL nanomaterial possesses excellent characteristics for long-term use in the monitoring of trace OPPs in fruit juice samples.4. Conclusions
An ERMSE method, based on utilization of effervescent tablets and NiFe2O4@SiO2@PANI-IL nancomposites, was developed for the enhanced extraction of OPPs in fruit juices prior to HPLC-DAD detection. Vigorous CO2 effervescent bubbles contributed to homogeneous dispersion of nanocomposites, which enhanced interactions between OPPs and the nanosorbents. The superparamagnetism of nanocomposites was conductive to rapid separation/collection of the adsorbent from the aqueous phase. Moreover, the attachment of SiO2, PANI and ILs onto the surface of NiFe2O4 enhanced active sites, pore size/volume and stability, thereby enhancing extraction capacity. Under optimized conditions, the ERMSE method gave high precision with RSDs of 1.1–5.2%, low LODs of 0.06–0.17 μg L−1 and satisfactory recoveries of 80.6–97.3% in apple, pear, orange, peach and mango fruit juices. Notably, the NiFe2O4@SiO2@PANI-IL nancomposites can be recycled at least eight times with ER losses <10%. Consequently, the newly developed method provides a simple, efficient, and green method requiring no dispersive solvents or auxiliary devices, thereby providing wide application value in conventional monitoring of OPPs in fruit juice matrices and potential other food/environmental matrices.Conflicts of interest
There are no conflicts of interest to declare.Acknowledgements
This work was jointly funded by the Natural Science Foundation of China (21876125 and 22076134), Project of Suzhou Sci&Tech Bureau (SYG201875, SNG2018047 and SNG2018051) and Jiangsu Postgraduate Scientific Research and Practice Innovation Program in 2020 (SJCX20_1103 and KYCX20_2781).References
- D. Li, M. He, B. Chen and B. Hu, J. Chromatogr. A, 2019, 1583, 19 CrossRef CAS.
- H. Heidaria, S. Ghanbari-Rada and E. Habibib, Journal of Food Composition and Analysis, 2020, 87, 103389 CrossRef.
- L. Du, X. Wang, T. Liu, J. Li, J. Wang, M. Gao and H. Wang, Microchem. J., 2019, 150, 104128 CrossRef CAS.
- L. Gao, L. Liu, Y. Sun, W. Zhao and L. He, Microchem. J., 2020, 153, 104364 CrossRef CAS.
- A. Lago, M. Cavalcanti, M. Rosa, A. Silveira, C. Tarley and E. Figueiredo, Anal. Chim. Acta, 2020, 1102, 11 CrossRef.
- D. Garcia-Rodriguez, R. Cela-Torrijos, R. A. Lorenzo-Ferreira and A. M. Carro-Diaz, Food Chem., 2012, 135, 259 CrossRef CAS.
- H. Zhao, Y. Dong, G. Wang, P. Jiang, J. Zhang, L. Wu and K. Li, Chem. Eng. J., 2013, 219, 295 CrossRef CAS.
- M. Ait Tamerd, B. Abraime, A. Lahmar, M. E. Marssi, M. Hamedoun, A. Benyoussef and A. E. Kenz, Superlattices Microstruct., 2020, 139, 106401 CrossRef CAS.
- H. Zhang, B. Xia, P. Wang, Y. Wang, Z. Li, Y. Wang, L. Feng, X. Li and S. Du, J. Alloys Compd., 2020, 819, 153053 CrossRef CAS.
- Z. Lia, Y. Liu, S. Zoub, C. Lu, H. Bai, H. Mu and J. Duan, Chem. Eng. J., 2020, 382, 123008 CrossRef.
- G. Su, Q. Zheng, Y. Wang, J. Liu and J. Xiang, J. Nanosci. Nanotechnol., 2018, 18, 2665 CrossRef CAS.
- G. Jimenez-Skrzypek, J. G. Salamo, D. A. Varela-Martinez, M. A. Gonzalez-Curbelo and J. Hernandez-Borges, J. Chromatogr. A, 2020, 1611, 460620 CrossRef CAS.
- C. Hu, M. He, B. Chen and B. Hu, J. Chromatogr. A, 2015, 1394, 36 CrossRef CAS.
- M. S. Shahriman, M. R. Ramachandran, N. N. M. Zain, S. Mohamad, N. S. A. Manan and S. M. Yaman, Talanta, 2018, 178, 211 CrossRef CAS.
- F. V. A. Dutra, B. C. Pires, M. M. Coelho, R. A. Costa, C. S. Francisco, V. L. Junior and K. B. Borges, Microchem. J., 2020, 153, 104490 CrossRef CAS.
- X. Yang, K. Qiao, F. Liu, X. Wu, M. Yang, J. Li, H. Gao, S. Zhang, W. Zhou and R. Lu, Talanta, 2017, 166, 93 CrossRef CAS.
- M. He, S. Su, B. Chen and B. Hu, Talanta, 2020, 207, 120314 CrossRef CAS.
- J. Wang, W. Zhu, T. Zhang, L. Zhang, T. Du, W. Zhang, D. Zhang, J. Sun, T. Yue, Y. Wang and J. Wang, Anal. Chim. Acta, 2020, 1100, 57 CrossRef CAS.
- P. Li, Y. Lu, J. Cao, M. Li, C. Yang and H. Yan, J. Chromatogr. A, 2020, 1623, 461192 CrossRef CAS.
- P. Zhou, K. Chen, M. Gao, J. Qu, Z. Zhang, R. A. Dahlgren, Y. Li, W. Liu, H. Huang and X. Wang, Food Chem., 2018, 268, 468 CrossRef CAS.
- L. Li, M. Wu, Y. Feng, F. Zhao and B. Zeng, Anal. Chim. Acta, 2016, 948, 48 CrossRef CAS.
- X. L. Yang, K. X. Qiao, F. Liu, X. L. Wu, M. Y. Yang, J. Li, H. X. Gao, S. B. Zhang, W. F. Zhou and R. H. Lu, Talanta, 2017, 166, 93 CrossRef CAS.
- Y. Li, J. Hu, W. Liu, L. Jin, P. Zhou, Y. Zhang, B. Zhang, Z. R. A. Dahlgren, X. Wang and Y. Zhou, Talanta, 2019, 195, 785 CrossRef CAS.
- P. Zhou, R. Zheng, W. Zhang, W. Liu, Y. Li, H. Wang and X. Wang, J. Anal. At. Spectrom., 2019, 34, 598 RSC.
- S. Wang, X. Pang, J. Cao, W. Cao, J. Xu, Q. Zhu, Q. Zhang and L. Peng, J. Chromatogr. A, 2015, 1418, 12 CrossRef CAS.
- H. Kavas, A. Baykal, M. S. Toprakc, Y. Köseoglu, M. Sertkol and B. Aktas, J. Alloys Compd., 2009, 479, 49 CrossRef CAS.
- N. H. Nasab and J. Safari, J. Mol. Struct., 2019, 1193, 118 CrossRef.
- X. Sun, Y. Q. Ma, S. T. Xu, Y. F. Xu and B. G. Geng, Mater. Charact., 2015, 107, 343 CrossRef CAS.
- M. George, A. K. Pandey, N. A. Rahim, V. V. Tyagi, S. Shahabuddin and R. Saidur, Sol. Energy, 2020, 204, 448 CrossRef CAS.
- W. Ding, X. Wang, T. Liu, M. Gao, F. Qian, H. Gu and Z. Zhang, Microchem. J., 2019, 150, 104109 CrossRef CAS.
- J. Wu, J. Li, Y. Chen, X. Bao, H. Tang, S. Ma, S. Zhou, M. Xu, J. Tao, W. Wang and X. Wang, Food Analytical Methods, 2019, 12, 2106 CrossRef.
- W. Ding, X. D. Wang, T. T. Liu, H. D. Gu and Z. N. Zhang, Microchem. J., 2019, 150, 104109 CrossRef CAS.
- C. Tan, J. Li, W. Liu, Q. Zhao, X. Wang and Y. Li, Chem. Eng. J., 2020, 396, 125191 CrossRef CAS.
- S. R. Bandforuzi and M. R. Hadjmohammadi, Anal. Chim. Acta, 2018, 1078, 90 CrossRef.
Footnote |
| † Electronic supplementary information (ESI) available. See DOI: 10.1039/d0ra09100f |
| This journal is © The Royal Society of Chemistry 2021 |

