
 Open Access Article
 This Open Access Article is licensed under a Creative Commons Attribution-Non Commercial 3.0 Unported Licence
Transformation details of poly(acrylonitrile) to poly(amidoxime) during the amidoximation process†
Dadong Shao *a,
Guangshun Hou*b,
Fangting Chic,
Xirui Luc and
Xuemei Rend
*a,
Guangshun Hou*b,
Fangting Chic,
Xirui Luc and
Xuemei Rend
aSchool of Environmental and Biological Engineering, Nanjing University of Science and Technology, Nanjing 210094, P R China. E-mail: shaodadong@126.com
bInstitute of Resources and Environment, Henan Polytechnic University, Jiaozuo 454000, P R China. E-mail: houguangshun@163.com
cFundamental Science on Nuclear Wastes and Environmental Safety Laboratory, Southwest University of Science and Technology, Mianyang 621010, P R China
dInstitute of Plasma Physics, Chinese Academy of Sciences, Hefei 230031, P R China
First published on 6th January 2021
Abstract
During the amidoximation process, transformation details of poly(acrylonitrile) (PAN) to poly(amidoxime) (PAO) is critical for optimizing amidoximation conditions, which determine the physicochemical properties and adsorption capabilities of PAO-based materials. Although the optimization of amidoximation conditions can be reported in the literature, a detailed research on the transformation is still missing. Herein, the effect of the amidoximation conditions (i.e. temperature, time, and NH2OH concentration) on the physicochemical properties and adsorption capabilities of PAO was studied in detail. The results showed that the extent of amidoximation reaction increased with increasing temperature, time, and NH2OH concentration. However, a considerably high temperature (>60 °C) and a considerably long time (>3 h) could result in the degradation and decomposition of PAO's surface topologies and functional groups, and then decrease its adsorption capability for U(VI). The optimal amidoximation condition was 3 h, 60 °C and 50 g L−1 NH2OH. At this condition, the PAO obtained presented the highest adsorption capability for U(VI) under experimental conditions. These results provide pivotal information on the transformation of PAO-based materials during the amidoximation process.
Introduction
Uranium is one of the basic materials for nuclear reactors; however, the conventional terrestrial uranium resources will be depleted soon.1,2 To identify a suitable and environmentally benign uranium source will be a significant issue in the near future for upkeeping nuclear reactors. The ∼4.5 billion tons of uranium in seawater is 1000 times larger than the amount in reasonable terrestrial resources and is expected to supply nuclear reactors worldwide for ∼13![[thin space (1/6-em)]](https://www.rsc.org/images/entities/char_2009.gif) 000 years.3 However, the extraction of uranium from seawater is strictly limited by its extremely low concentration (∼3.3 μg L−1), abundant competing ions, and microorganisms. To achieve the economical separation of uranium from seawater, it is necessary to develop specific materials with excellent properties such as high adsorption capability, excellent selectivity, good reusability, and durability to the marine environment.4–6
000 years.3 However, the extraction of uranium from seawater is strictly limited by its extremely low concentration (∼3.3 μg L−1), abundant competing ions, and microorganisms. To achieve the economical separation of uranium from seawater, it is necessary to develop specific materials with excellent properties such as high adsorption capability, excellent selectivity, good reusability, and durability to the marine environment.4–6
Amidoxime (AO)-based materials are extensively considered as the most promising platform for extracting trace dissolved U(VI) from seawater. The common preparation methods of PAO primarily contain two steps: polymerization of acrylonitrile, followed by amidoximation treatment with NH2OH to convert the cyano group (–C![[triple bond, length as m-dash]](https://www.rsc.org/images/entities/char_e002.gif) N) in PAN to –C(NH2)
N) in PAN to –C(NH2)![[double bond, length as m-dash]](https://www.rsc.org/images/entities/char_e001.gif) NOH.7–10 However, to date, the adsorption capabilities of PAO-based materials are still considerably than the theoretical value. To explore the reasons, abound works were preformed, which reported that open-chain AO and cyclic imide dioxime groups co-form during the amidoximation process and cyclic imide dioxime groups are more efficient in complexing U(VI) than open-chain AO under marine environment.11,12 Rao et al.13,14 reported that three derivatives of AO, including glutarimidoxioxime (HLIII, closed-ring), glutarimidedioxime (H2LI, closed-ring) and glutardiamidoxime (H2LII, open-ring), are present in PAO. These derivatives have very different complex capabilities with U(VI), and only H2LI can effectively bond to U(VI) against the competition of carbonate15–17 and vanadium18 in seawater.
NOH.7–10 However, to date, the adsorption capabilities of PAO-based materials are still considerably than the theoretical value. To explore the reasons, abound works were preformed, which reported that open-chain AO and cyclic imide dioxime groups co-form during the amidoximation process and cyclic imide dioxime groups are more efficient in complexing U(VI) than open-chain AO under marine environment.11,12 Rao et al.13,14 reported that three derivatives of AO, including glutarimidoxioxime (HLIII, closed-ring), glutarimidedioxime (H2LI, closed-ring) and glutardiamidoxime (H2LII, open-ring), are present in PAO. These derivatives have very different complex capabilities with U(VI), and only H2LI can effectively bond to U(VI) against the competition of carbonate15–17 and vanadium18 in seawater.
The conversion of PAN to PAO is fairly dependent on amidoximation conditions (such as amidoximation time, temperature and NH2OH concentration).9,17–23 High temperature, high NH2OH concentration and a long reaction time benefit the diffusion of NH2OH from solution into the PAN matrix and enhance PAN conversion and H2LI formation.13,14,21 However, because of the instability of PAO, unproper amidoximation conditions result in the degradation and decomposition of PAO.10,13,24–26 Rao et al.27,28 reported that open-chain AO and cyclic imide dioximes are the major products of PAO at low and high temperatures, respectively. Moreover, the U/V selectivity and the conversion of the ester group (–CO) to carboxylate (–COO−) on adsorbent surface depend on the amidoximation condition,18 which is important for applying PAO-based adsorbents. Therefore, it is necessary to characterize the transformation of PAN to PAO during the amidoximation process, which can provide pivotal information for optimizing amidoximation conditions, and then improve its adsorption capability for trace U(VI) in seawater.13,14
In this study, the effect of amidoximation conditions (i.e. temperature, time, and NH2OH concentration) on the physicochemical properties and adsorption capabilities of PAO were studied in detail. The results showed that the extent of amidoximation reaction increased with increase in temperature, time, and NH2OH concentration. However, a considerably high temperature and a considerably long time resulted in the degradation and decomposition of PAO surface topologies and functional groups. Furthermore, the adsorption capability of PAO for U(VI) depended on its surface property. The optimal amidoximation condition was 3 h, 60 °C and 50 g L−1 NH2OH. The results provide pivotal information on the transformation of PAO-based material during the amidoximation process.
Results and discussion
The conversion of PAN into PAO in the amidoximation process could be directly observed by macroscopic phenomena. The changes in colour and appearance below 40 °C under the experimental conditions could be neglected, which illustrated that a proper temperature was necessary for PAN conversion. Mishra et al.23 reported that the mobility of NH2OH within PAN matrix was restricted at low temperatures, restraining the performance of the amidoximation reaction. The colour of PAN changed from white to yellow when the reaction temperature was higher than 50 °C, and its appearance changed from powder to lump, and finally to a colloidal suspension. The materials obtained after vacuum drying were brittle and hard. Many researchers reported similar changes,15,29,30 and they assigned it to the conversion of PAN into PAO because larger molecules (PAO) related to higher strength and toughness compared to shorter molecules (PAN). Our results illustrated that 60 °C was enough for the amidoximation reaction under the experimental conditions.Effect of amidoximation time and temperature on surface property of PAO
Because of the faster mobility of NH2OH within the PAN matrix at higher temperatures,23 amidoximation reaction increased with the increasing temperature. A higher temperature favoured the formation of cyclic imide dioxime sites over that of open-chain AO,21 and the former had a stronger affinity for U(VI) than the latter. However, a prolonged exposure of PAO in hot solution led to the degradation and decomposition of PAO.25,26,31 The conversion details of PAN to PAO could be directly revealed by the surface properties, which were characterized by FT-IR spectroscopy, XPS spectroscopy and SEM images in this work. As can be seen from the FT-IR spectroscopy in Fig. 1, raw PAN showed characteristic peaks related to –CN stretching vibration at ∼2242 cm−1, –CN bending vibration at ∼1070 cm−1, –CH stretching vibration at ∼2935 cm−1, and –CH2 stretching vibration at ∼1452 cm−1.23,29,32 The gradual decrease of –CN peak intensities together with the appears of N–O (∼913 cm−1), N–H (∼3368 cm−1) and O–H (∼3336 cm−1)19,31,32 after the amidoximation reaction revealed the successful conversion of PAN into PAO. The N–O, N–H and O–H vibrations appeared, increased, and decreased with the performance of the amidoximation reaction. All these results confirmed the formation and deterioration of PAO in the amidoximation process. Moreover, those peaks markedly decreased with further increasing the amidoximation time (at 60 and 80 °C in this work).
 | ||
| Fig. 1 FT-IR spectra of PAN and PAO prepared at different amidoximation temperatures. C[NH2OH] = 50 g L−1. (A) 20 °C. (B) 40 °C. (C) 60 °C. (D) 80 °C. | ||
The conversion of PAN to PAO was further evidenced by XPS spectroscopy, which is usually used to identify and qualitatively measure surface functional groups. The XPS survey spectra (Fig. 2A) of PAN and PAO prepared at different amidoximation time (50 g L−1 NH2OH, 60 °C) showed the typical O 1s, N 1s, and C 1s at ∼532, ∼400, and ∼285 eV, respectively.
 | ||
| Fig. 2 XPS survey (A), N 1s (B), C 1s (C), and O 1s (D) spectra of PAN and PAO prepared at different amidoximation time. C[NH2OH] = 50 g L−1, T = 60 °C. | ||
XPS N 1s spectra (Fig. 2B) could be deconvoluted into three components of –CN, undoped amine-like nitrogen atoms (N–H), and –C(NH2)NOH, which were centered at 398.7 ± 0.1, 399.3 ± 0.1 and 400.5 ± 0.1 eV,29,33 respectively. According to the fitting results of N 1s XPS spectra (Table SI-1†), due to the conversion of PAN to PAO, the peak fraction corresponding to –C(NH2)NOH quickly increased with increasing the amidoximation time to 3 h, and then slowly decreased with further increasing the amidoximation time. Peak fractions of –CN and N–H gradually decreased and increased, respectively. The amidoximation degree (DA)9,19 of PAN could be semi-quantitatively calculated by using the ratio of the integration area of –C(NH2)NOH groups(400.5 ± 0.1 eV) to the area of N–H (399.3 ± 0.1 eV). The DA values were roughly calculated to be 0.12, 0.17, 0.24, 0.26, 0.21, 0.22, and 0.15 after amidoximation for 1, 2, 3, 4, 6, 12, and 24 h, respectively. The related weight percents of –C(NH2)NOH in PAO were roughly estimated to be 12.4%, 17.1%, 23.2%, 24.9%, 20.7%, 21.5%, and 15.3% after amidoximation for 1, 2, 3, 4, 6, 12, and 24 h at 60 °C, respectively. It revealed that parts of PAO degraded and decomposed during the amidoximation processes. Wang et al.19 reported that PAO can transform to –COO− during the amidoximation process.
XPS C 1s spectra (Fig. 2C) could be deconvoluted into five components of –CN, C–C, C–OH and –C(NH2)NOH, –CO, and –COO−, which were at 284.6 ± 0.1, 285.3 ± 0.1, 286.4 ± 0.1, 287.4 ± 0.1, and 288.6 ± 0.1 eV, respectively.19,33 XPS O 1s spectra (Fig. 2D) could be deconvoluted into three components of –COO−, CO and –C(NH2)NOH, and –OH, which were at 531.2 ± 0.1, 532.3 ± 0.1, and 533.4 ± 0.1 eV, respectively.19,34,35 According to the curve fitting results of XPS C 1s (Table SI-2†) and O 1s (Table SI-3†) spectra, C–C and–CN were first and second carbon species, and gradually decreased during the amidoximation process. Groups of –COO−, –C(NH2)NOH, and CO were the dominant oxygen species on the PAO surface. The peak fractions of –C(NH2)NOH in XPS O 1s spectra showed the same variation tendency as those in XPS N 1s spectra. Furthermore, the peak fractions of –COO− showed an opposite variation tendency as those of –C(NH2)NOH. The XPS spectra revealed that parts of PAO transformed into –COO− during the amidoximation process. We reported that 3 h was the optimum amidoximation time under our experimental conditions.
Effect of NH2OH concentration on surface property of PAO
Effect of NH2OH concentration on the conversion of PAN to PAO is presented in Fig. 3. According to the changing of –CN stretching vibration at ∼2242 cm−1, the conversion of PAN to PAO increased with the increasing NH2OH concentration under our experimental conditions. Mishra et al.23 also reported that the amidoximation degree increased linearly with increasing the NH2OH concentration.
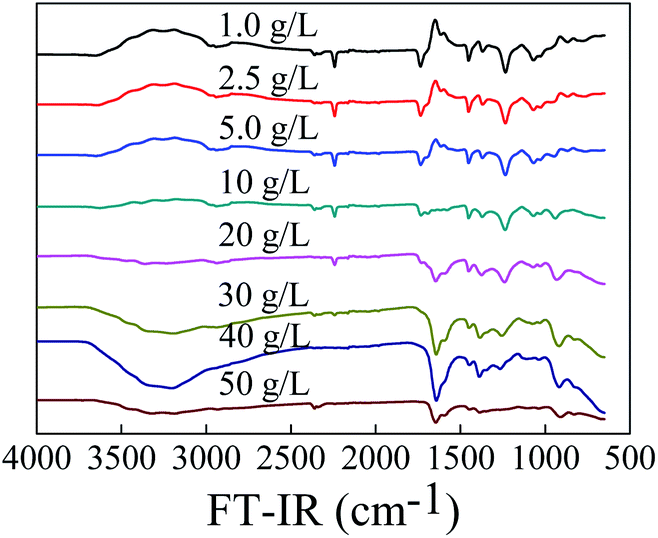 | ||
| Fig. 3 FT-IR spectra of PAO prepared at different NH2OH concentration. T = 60 °C, t = 6 h. | ||
Effect of amidoximation time on PAO morphology
Surface topology is an important indicator of reaction processing. To study the change in PAO surface topologies during the amidoximation process, the microstructures of PAN and PAO prepared at different amidoximation times were studied by a SEM image technique. SEM results further confirmed that a too long time resulted in the degradation and decomposition of PAO surface topologies. As shown in Fig. 4, the surface morphologies of PAO gradually changed from spherical shape into flake-like structures in the amidoximation process. PAN (Fig. 4A) and the PAO amidoximated for 1 h (Fig. 4B) were spherical in shape as well as presented a wrinkled surface, which could provide abound diffusion channels for NH2OH into its interior during the amidoximation process. After an amidoximation for 2 h (Fig. 4C), the surfaces of PAO were plate-like with wrinkled and crumpled structures. As the amidoximation reaction further processed, PAO surfaces (Fig. 4D–H) gradually became smooth and tight. It is well known that the interior diffusion of adsorbate in adsorbent matrix fairly depends on the steric hindrances (morphologies) of the adsorbent. The degradation of PAO topologies adversely affected the interior diffusion of U(VI) in PAO, which consequently decreased its adsorption capabilities.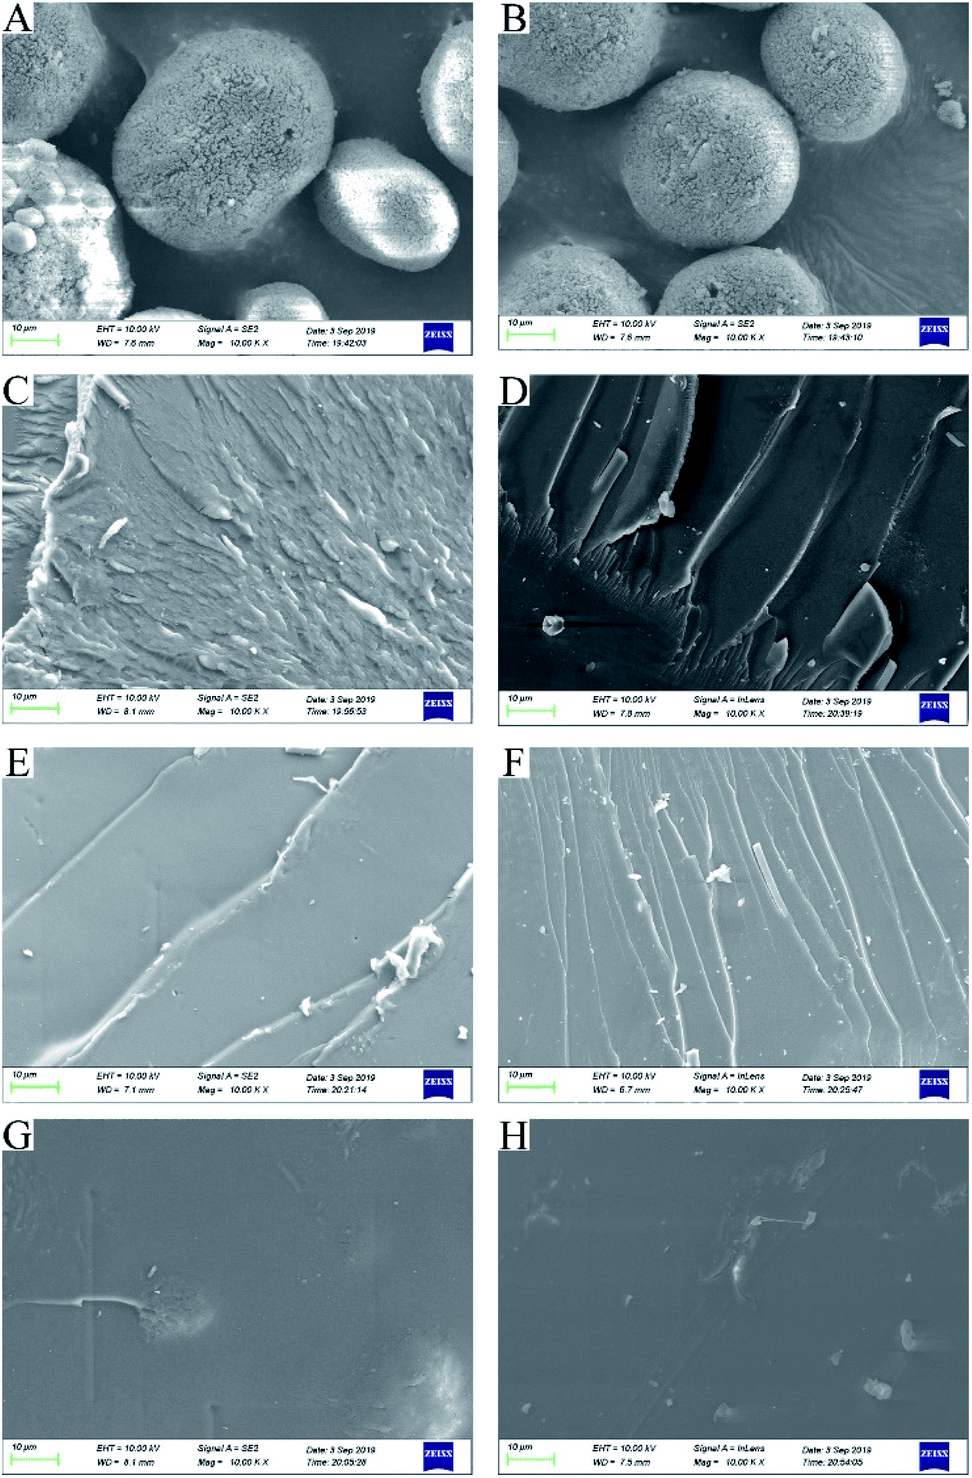 | ||
| Fig. 4 SEM images of PAN (A) and PAO (B–H) prepared at different amidoximation time. (B) 1 h, (C) 2 h, (D) 3 h, (E) 4 h, (F): 6 h, (G) 12 h, (H) 24 h. | ||
Effect of amidoximation time on thermal stability of PAO
TGA characterization was used to study the effect of amidoximation time on the thermal stability of PAO. As shown in Fig. 5A, the weight loss from room temperature up to ∼130 °C could be assigned to the loss of moisture. The weight loss at >130 °C could be assigned to the thermal decomposition and pyrolysis of PAN and PAO.9,20 The thermal stabilities of PAO quickly decreased at the first 3 h, and then slowly decreased with further increase in the amidoximation time. It revealed that PAN was gradually converted into PAO during the amidoximation process, which could be simply adjusted by controlling the amidoximation time during the fabrication processes.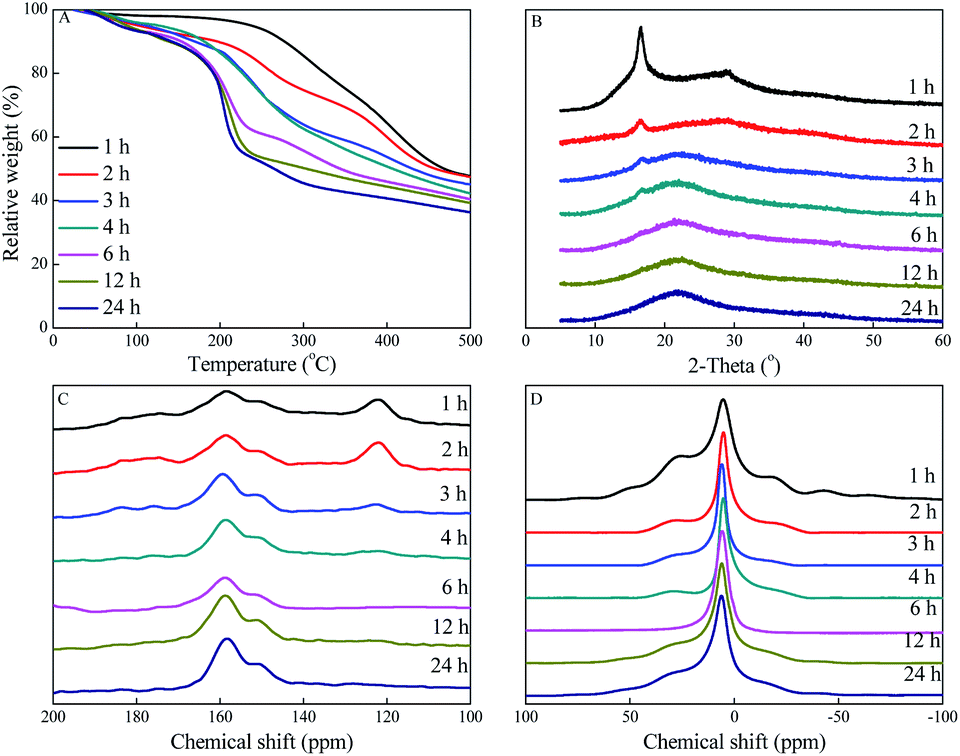 | ||
| Fig. 5 TGA curves (A), XRD patterns (B), solid-state 1H (C), and 13C (D) NMR spectra of PAO prepared at different amidoximation time. C[NH2OH] = 50 g L−1, T = 60 °C. | ||
Effect of amidoximation time on PAO framework
The framework of PAO prepared at 50 g L−1 NH2OH, 60 °C and different amidoximation time were characterized by powder XRD. As shown in Fig. 5B, the peaks at 2θ = 16.6° and 28.8° related to PAN gradually decreased with increasing the amidoximation time, and became undetectable after being amidoximated for 6 h. The new bound peak at 2θ = 22.0° related to PAO revealed that PAO had an amorphous structure, which gradually increased with increasing the amidoximation time to 6 h, and then kept the level. The XRD results confirmed the gradual conversion of PAN to PAO.Effect of amidoximation time on PAO bulk structural property
To evaluate the change of the PAO framework during the amidoximation process, the PAO materials prepared at 60 °C and 50 g L−1 NH2OH were studied by solid-state NMR spectrocosopy technique. The 13C NMR spectra of PAO materials in Fig. 5C confirmed the presence of PAN, PAO, and –COO− at ∼122, 144–169, and ∼176 ppm,10,16,24,31,36,37 respectively. The peaks at ∼122 and 144–169 ppm related to PAN and PAO gradually decreased and increased, respectively, with increasing the amidoximation time to 6 h, and then maintained at that level. It confirmed the conversion of PAN to PAO during the amidoximation process. Moreover, the broad peak composed of two signals centered at ∼151 and ∼158 ppm could be assigned to cyclic imidedioxime and open-chain AO,10,16,24,31,36,37 respectively. Similarly to the literature reports, cyclic imidedioxime was the major product,36 and the peak intensity ratio of cyclic imidedioxime (∼151 ppm) to open-chain AO (∼158 ppm) increased with increasing the amidoximation time to 6 h, and then maintained at that level. Many researches reported that a high temperature favoured the formation of cyclic imide dioxime sites over open-chain AO16,21,31,36 and the former had a stronger affinity for U(VI) than the latter. Brown et al.16 also found an incomplete cyclization of PAO even after long amidoximation times. The 1H NMR spectra of PAO confirmed the results of the 13C NMR spectra. As shown in Fig. 5D, PAO showed peaks at −64.7, −42.9, −17.2, 6.5, 27.4, and 50 ppm. Except for the peak at −6.5 ppm, all other peaks gradually decreased with increasing the amidoximation time to 6 h, and then maintained at that level. Therefore, the formation mechanism of PAO derivatives was proposed, as shown in Scheme 1.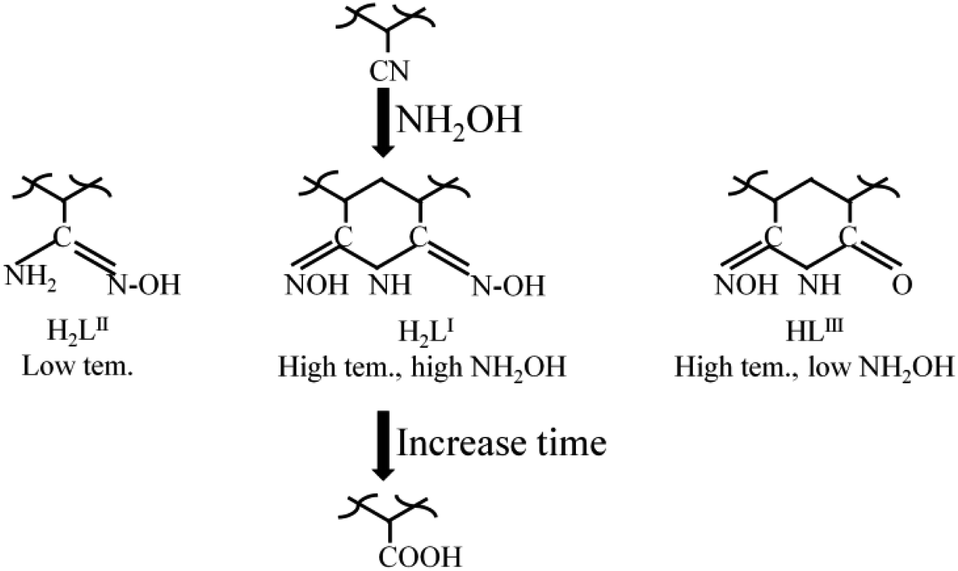 | ||
| Scheme 1 A Schematic of the formation of PAO derivatives. | ||
Effect of amidoximation time on PAO adsorption capability
To evaluate the effect of amidoximation time on the adsorption capacity of PAO for U(VI), the adsorption isotherms of U(VI) on PAO prepared at different amidoximation times (C[NH2OH] = 50 g L−1, T = 60 °C) were studied at 20 ± 1 °C in polyethylene test tube using a batch adsorption technique. To better illustrate the effect of amidoximation conditions on the adsorption capacity of PAO for U(VI), the prepared PAO was not treated with an alkaline solution. As shown in Fig. 6A, the adsorption isotherms of U(VI) on PAO increased with increasing the amidoximation time up to 3 h, and then decreased with further increasing amidoximation time, which was similar to the PAO surface changing. This indicated that the adsorption of U(VI) on PAO was primarily controlled by the PAO surface properties. Langmuir model (Cs = b × Cs,max × Ce/(1 + b × Ce), where Ce (mg L−1) is the concentration of U(VI) in supernatant after centrifugation, Cs,max (mg g−1) is the maximum adsorption capability of adsorbent, and b (L mg−1) is Langmuir constant) and Freundlich model (Cs = K × Ce1/n, where K (mg g−1) is the constant of adsorption capability, and 1/n is the constant of adsorption intensity) are used to study the adsorption isotherms. As shown in Fig. 6B, the same tendency could be found for the Cs,max data calculated from Langmuir model and the K data calculated from Freundlich model. According to the R2 values in Table SI-4†, the Langmuir model described the adsorption data better than the Freundlich model, which indicated that adsorption sites on PAO surface were uniform and homogeneous for U(VI) adsorption, and the adsorbed U(VI) only formed a monolayer on the PAO surface. The Cs,max values were 60.0, 69.0, 91.2, 81.2, 74.2, 71.4, and 64.4 mg g−1 after amidoximation for 1, 2, 3, 4, 6, 12, and 24 h, respectively. Combining the weight percent of –C(NH2)NOH in PAO, the utility ratio of –C(NH2)NOH in PAO were roughly estimated to be 12.0%, 10.0%, 9.73%, 8.08%, 8.90%, 8.22%, and 10.5% after amidoximation for 1, 2, 3, 4, 6, 12, and 24 h at 60 °C, respectively. Moreover, Abney et al.25 found that the heat-treated PAO and poly(itaconic acid) copolymer in polar aprotic solvents could increase the conversion of adjacent AO to cyclic imidedioxime, and then enhance its adsorption capability for U(VI). Therefore, we will study the effect of post heat-treatment and alkali treatment on the physicochemical properties and adsorption capabilities of PAO-based materials in the future.
 | ||
| Fig. 6 Adsorption isotherms of U(VI) on PAO prepared at different amidoximation time. T = 25 ± 1 °C, equilibrium time 24 h, mV = 0.20 g L−1, pH = 8.2 ± 0.1, I = 0.1 mol L−1 NaCl. | ||
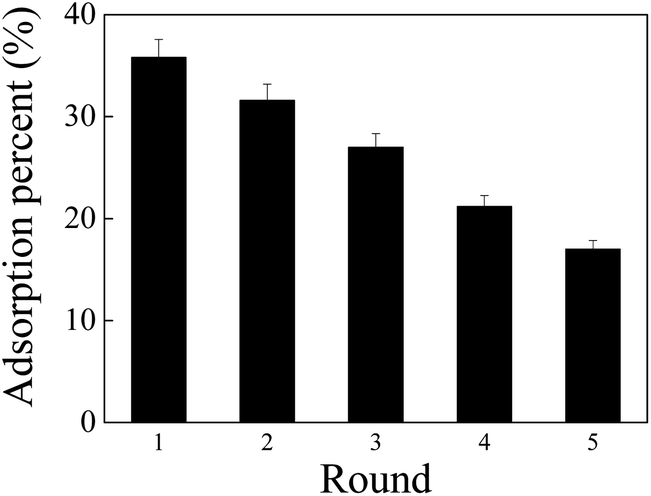
The adsorption capability of PAO-based materials for U(VI) usually decreased with increase in the cycle time. To clarify the reusability of PAO, the PAO prepared at 50 g L−1 NH2OH, 60 °C, for 3 h was selected as a representative PAO, and 0.1 mol L−1 Na2CO3 was selected as an eluting agent. As shown in Fig. 7, PAO still exhibited000 its ∼50% adsorption capability for U(VI) even after recycling five times under the experimental conditions. The results revealed excellent stability of PAO.
 | ||
| Fig. 7 Recycling application of PAO in U(VI) adsorption. T = 25 ± 1 °C, contact time: 24 h, C[U(VI)]initial = 50.0 mg L−1, mV = 0.20 g L−1, pH = 8.2 ± 0.1, and I = 0.1 mol L−1 NaCl. | ||
Conclusions
In summary, amidoximation reaction was governed by amidoximation parameters, and it increased with the increasing amidoximation temperature (to 60 °C), time (to 3 h) and NH2OH concentration (to 50 g L−1). Due to the hydrolysis degradation of PAN and PAO, considerably high temperatures and considerably long times resulted in the degradation and decomposition of PAO, and thereby decreased its adsorption capabilities. Parameters of 60 °C, 3 h, and 50 g L−1 NH2OH were reported to be the optimal amidoximation conditions in this work. The batch adsorption results were consistent with the characterization results, and the PAO prepared at optimal amidoximation conditions (60 °C, 3 h, and 50 g L−1 NH2OH) presented the highest adsorption capability under our experimental conditions. The results of this work provide pivotal information on the formation and decomposition of PAO during the amidoximation process, which highlight the necessity of optimizing the amidoximation conditions for extracting uranium from seawater.Experimental section
Amidoximation of PAN
Commercial PAN powder containing 6.9% vinyl acetate was used as-received. NH2OH solution was prepared by dissolving NH2OH·HCl in ethanol/water (4:1, V/V) solution, and the pH was adjusted to 7.0 with NaOH. We found that the solubilization of PAN in ethanol/water (4:1, V/V) could be neglected. Amidoximation reactions were performed in 100 mL glass flasks under nitrogen and electromagnetic stirring condition. The effect of amidoximation conditions (i.e. amidoximation temperature, time and NH2OH concentration) were studied in details. After the amidoximation reaction, the materials obtained were repeatedly washed with ethanol/water (4:1, V/V) to remove unreacted NH2OH, and then vacuum dried at 20 °C.
Characterization
The physicochemical properties of PAO were characterized by Fourier transform infrared (FT-IR) spectroscopy, Raman spectroscopy, scanning electron microscopy (SEM), powder X-ray diffraction (XRD), thermogravimetric analysis (TGA), X-ray photoelectron spectroscopy (XPS) and solid-state nuclear magnetic resonance (NMR) spectroscopy in detail. Except for the TGA measurement, all characterizations were performed at room temperature. FT-IR spectroscopy measurement was mounted on a Thermofisher Nicolet IS 50 FT-IR spectrometer. Raman spectroscopy analysis was performed on a LabRam HR Raman spectrometer. SEM images were obtained with a ZEISS SUPRA 40 FE-SEM. Powder XRD patterns were collected on a RigaKu D/max 2550 X-ray Diffractometer with CuKα radiation (λ = 0.15406 nm). TGA curve measurement was examined on a Shimadzu TGA-50 thermogravimetric analyzer from room temperature to 800 °C at a heating rate of 10 °C min−1 with a nitrogen flow rate of 50 mL min−1. XPS spectroscopy was performed on an ESCALab220i-XL surface microanalysis system (VG Scientific) equipped with an Al Kα (hλ = 1486.6 eV) source at a chamber pressure of 3 × 10⁻⁹ mbar. The surface charging effect was corrected with C 1s peak at 284.4 eV as a reference. Solid-state 1H and 13C NMR spectra were acquired on a Varian Inova 400 MHz spectrometer.U(VI) adsorption on PAO
U(VI) adsorption on PAO was studied at 20 ± 1 °C in polyethylene test tubes by a batch technique, and NaCl was used to control ionic strength because NaCl is the primary salt in seawater. Briefly, after PAO and NaCl were pre-equilibrated for 24 h, U(VI) and deionized water were added to achieve the desired concentrations, and the pH values of suspensions were adjusted to 8.2 ± 0.1 by adding negligible volumes of HCl or NaOH. After shaking for 24 h, the used PAO was separated from the liquid phase by centrifugation at 9000 rpm for 30 min at 20 °C, and then the supernatants were filtered by 0.45 μm membrane filters. The final U(VI) concentrations in supernatant were measured on an Optima 2100 DV inductively coupled plasma-atomic emission spectroscope (ICP-AES, Perkin Elmer). All adsorption data were the average of triplicate measurements.Reuse of PAO
To clarify the reusability of PAO, the PAO prepared at 50 g L−1 NH2OH, 60 °C for 3 h was selected as the representative PAO material, and 0.1 mol L−1 Na2CO3 was selected for the regeneration of PAO. Note that ∼50 mg U-laden PAO was regenerated in 50 mL 0.1 mol L−1 Na2CO3 solution for 24 h, followed by rinsing with deionized water and vacuum drying at 60 °C. The regenerated PAO was then reused in the following experiments.Conflicts of interest
There are no conflicts to declare.Acknowledgements
We gratefully acknowledge the financial support from the National Natural Science Foundation of China (11675210, 21976089).Notes and references
- T. Saito, S. Brown, S. Chatterjee, J. Kim, C. Tsouris, R. T. Mayes, L. J. Kuo, G. Gill, Y. Oyola, C. J. Janke and S. Dai, J. Mater. Chem. A, 2014, 2, 14674–14681 RSC.
- X. Wang, L. Chen, L. Wang, Q. Fan, D. Pan, J. Li, F. Chi, Y. Xie, S. Yu, C. Xiao, F. Luo, J. Wang, X. Wang, C. Chen, W. Wu, W. Shi, S. Wang and X. Wang, Sci. China: Chem., 2019, 62, 933–967 CrossRef CAS.
- C. Gunathilake, J. Górka, S. Dai and M. Jaroniec, J. Mater. Chem. A, 2015, 3, 11650–11659 RSC.
- W. Chouyyok, J. W. Pittman, M. G. Warner, K. M. Nell, D. C. Clubb, G. A. Gillc and R. S. Addleman, Dalton Trans., 2016, 45, 11312–11325 RSC.
- H. J. Schenk, L. Astheimer, E. G. Witte and K. Schwochau, Sep. Sci. Technol., 1982, 17, 1293–1308 CrossRef CAS.
- K. Schwochau, L. Astheimer, H. J. Schenk and E. G. Witte, Z. Naturforsch., B: Anorg. Chem., Org. Chem., 1982, 37, 214–216 Search PubMed.
- L. Astheimer, H. J. Schenk, E. G. Witte and K. Schwochau, Sep. Sci. Technol., 1983, 18, 307–339 CrossRef CAS.
- S. Morooka, T. Kato, M. Inada, T. Kago and K. Kusakabe, Ind. Eng. Chem. Res., 1991, 30, 190–196 CrossRef CAS.
- D. Shao, J. Li and X. Wang, Sci. China: Chem., 2014, 57, 1449–1458 CrossRef CAS.
- S. Brown, S. Chatterjee, M. Li, Y. Yue, C. Tsouris, C. J. Janke, T. Saito and S. Dai, Ind. Eng. Chem. Res., 2016, 55, 4130–4138 CrossRef CAS.
- C. Ling, X. Liu, X. Yang, J. Hu, R. Li, L. Pang, H. Ma, J. Li, G. Wu, S. Lu and D. Wang, Ind. Eng. Chem. Res., 2017, 56, 1103–1111 CrossRef CAS.
- A. S. Ivanov, C. J. Leggett, B. F. Parker, Z. Zhang, J. Arnold, S. Dai, C. W. Abney, V. S. Bryantsev and L. Rao, Nat. Commun., 2017, 8, 1560 CrossRef.
- C. J. Leggett, F. Endrizzi and L. Rao, Ind. Eng. Chem. Res., 2016, 55, 4257–4263 CrossRef CAS.
- F. Endrizzi, A. Melchior, M. Tolazzi and L. Rao, Dalton Trans., 2015, 44, 13835–13844 RSC.
- S. Chatterjee, V. S. Bryantsev, S. Brown, J. C. Johnson, C. D. Grant, R. T. Mayes, B. P. Hay, S. Dai and T. Saito, Ind. Eng. Chem. Res., 2016, 55, 4161–4169 CrossRef CAS.
- S. Brown, Y. Yue, L. J. Kuo, N. Mehio, M. Li, G. Gill, C. Tsouris, R. T. Mayes, T. Saito and S. Dai, Ind. Eng. Chem. Res., 2016, 55, 4139–4148 CrossRef CAS.
- H. B. Pan, C. M. Wai, L. J. Kuo, G. Gill, G. Tian, L. Rao, S. Das, R. T. Mayes and C. J. Janke, Chemistryselect, 2017, 2, 3769–3774 CrossRef CAS.
- H. B. Pan, C. M. Wai, L. J. Kuo, G. A. Gill, J. S. Wang, R. Joshi and C. J. Janke, Dalton Trans., 2020, 49, 2803–2810 RSC.
- D. Wang, J. Song, J. Wen, Y. Yuan, Z. Liu, S. Lin, H. Wang, H. Wang, S. Zhao, X. Zhao, M. Fang, M. Lei, B. Li, N. Wang, X. Wang and H. Wu, Adv. Energy Mater., 2018, 8, 1802607 CrossRef.
- D. Shao, X. Wang, X. Wang, S. Hu, T. Hayat, A. Alsaedi, J. Li, S. Wang, J. Hu and X. Wang, RSC Adv., 2016, 6, 52076–52081 RSC.
- S. Das, S. Brown, R. T. Mayes, C. J. Janke, C. Tsouris, L. J. Kuo, G. Gill and S. Dai, Chem. Eng. J., 2016, 298, 125–135 CrossRef CAS.
- C. K. Na, H. J. Park and B. G. Kim, J. Appl. Polym. Sci., 2012, 125, 776–785 CrossRef CAS.
- A. Mishra, S. Sharma and B. Gupta, J. Appl. Polym. Sci., 2011, 121, 2705–2709 CrossRef CAS.
- Y. Yuan, S. Zhao, J. Wen, D. Wang, X. Guo, L. Xu, X. Wang and N. Wang, Adv. Funct. Mater., 2019, 29, 1805380 CrossRef.
- C. W. Abney, R. T. Mayes, T. Saito and S. Dai, Chem. Rev., 2017, 117, 13935–14013 CrossRef CAS.
- S. O. Kang, S. Vukovic, R. Custelcean and B. P. Hay, Ind. Eng. Chem. Res., 2012, 51, 6619–6624 CrossRef CAS.
- G. X. Tian, S. J. Teat, Z. Zhang and L. Rao, Dalton Trans., 2012, 41, 11579–11586 RSC.
- X. Sun, C. Xu, G. Tian and L. Rao, Dalton Trans., 2013, 42, 14621–14627 RSC.
- W. Li, Q. Liu, J. Liu, H. Zhang, R. Li, Z. Li, X. Jing and J. Wang, Appl. Surf. Sci., 2017, 403, 378–388 CrossRef CAS.
- F. Huang, Y. Xu, S. Liao, D. Yang, Y. L. Hsieh and Q. Wei, Materials, 2013, 6, 969–980 CrossRef CAS.
- S. Das, C. Tsouris, C. Zhang, J. Kim, S. Brown, Y. Oyola, C. J. Janke, R. T. Mayes, L. J. Kuo, J. R. Wood, G. A. Gill and S. Dai, Ind. Eng. Chem. Res., 2016, 55, 4294–4302 CrossRef CAS.
- Y. Yue, R. T. Mayes, G. Gill, L. J. Kuo, J. Wood, A. Binder, S. Brown and S. Dai, RSC Adv., 2015, 5, 50005–50010 RSC.
- J. Zeng, H. Zhang, Y. Sui, N. Hu, D. Ding, F. Wang, J. Xue and Y. Wang, Ind. Eng. Chem. Res., 2017, 56, 5021–5032 CrossRef CAS.
- D. Shao, X. Wang, X. Ren, S. Hu, J. Wen, Z. Tan, J. Xiong, A. M. Asiri and H. M. Marwani, J. Ind. Eng. Chem., 2018, 67, 380–387 CrossRef CAS.
- D. Shao, X. Liu, T. Hayat, J. Li and X. Ren, J. Radioanal. Nucl. Chem., 2019, 319, 379–386 CrossRef CAS.
- N. Mehio, B. Williamson, Y. Oyola, R. T. Mayes, C. Janke, S. Brown and S. Dai, Ind. Eng. Chem. Res., 2016, 55, 4217–4223 CrossRef CAS.
- N. Seko, A. Katakai, M. Tamada, T. Sugo and F. Yoshii, Sep. Sci. Technol., 2004, 39, 3753–3767 CrossRef CAS.
Footnote |
| † Electronic supplementary information (ESI) available. See DOI: 10.1039/d0ra09096d |
| This journal is © The Royal Society of Chemistry 2021 |