DOI:
10.1039/D0RA08865J
(Paper)
RSC Adv., 2021,
11, 5741-5752
Leaching of iron from copper tailings by sulfuric acid: behavior, kinetics and mechanism†
Received
18th October 2020
, Accepted 11th January 2021
First published on 2nd February 2021
Abstract
Copper tailing is a widespread and intractable solid waste in copper production. Traditional leaching and recovery technology for copper tailing focuses on copper but neglects the leaching of iron. With the increase in applications and demands of iron-containing materials for environment, understanding the leaching behaviors of iron can promote the utilization of copper tailings. In this study, the kinetics and mechanism of the leaching of iron from copper tailings using sulfuric acid were studied. Under optimal conditions (40 °C, sulfuric acid concentration of 0.53 mol L−1, stirring speed of 400 rpm, solid/liquid ratio of 1![[thin space (1/6-em)]](https://www.rsc.org/images/entities/char_2009.gif) :10 and leaching time of 120 min), 66.45% of Fe, along with 65.32% of Zn and 59.95% of Cu, were leached from the tailings. The leaching of iron was confirmed to be controlled by solid-film diffusion. The reaction orders for sulfuric acid concentration, solid/liquid ratio, and stirring speed were found to be 0.85, −0.70, and 0.40, respectively. Results from XRF, XRD, and SEM indicated that oxides (including CaO, CuO, and ZnO) were leached first, after which Fe2SiO4 was preferentially reacted compared to Fe3O4. The accumulation of CaSO4 and SiO2 inhibited the further leaching of iron.
:10 and leaching time of 120 min), 66.45% of Fe, along with 65.32% of Zn and 59.95% of Cu, were leached from the tailings. The leaching of iron was confirmed to be controlled by solid-film diffusion. The reaction orders for sulfuric acid concentration, solid/liquid ratio, and stirring speed were found to be 0.85, −0.70, and 0.40, respectively. Results from XRF, XRD, and SEM indicated that oxides (including CaO, CuO, and ZnO) were leached first, after which Fe2SiO4 was preferentially reacted compared to Fe3O4. The accumulation of CaSO4 and SiO2 inhibited the further leaching of iron.
1. Introduction
Copper tailing is the residual ore left after copper extraction during a floatation process, which is more difficult to recycle as compared to the copper slag. Its main components are fayalite (Fe2SiO4) and magnetic iron oxide (Fe3O4), accounting for more than 55% of the copper tailings.1 In 2015, it is estimated that 68.7 million tons of copper tailings were produced worldwide.2 Copper tailing is often discarded into stock dumps or sold for use in cement and roadbed production.3,4 These methods not only waste limited mineral resources but also potentially damage the ecological environment.5,6 Recently, several approaches for more comprehensive utilization of copper slag have focused on pyrometallurgy. Green reductants, such as walnut shell char,7 and waste cooking oil,8 were employed to recycle iron from the waste copper slag. Fuentes et al.9 have also used reduced copper slag as a catalyst for carbon oxide hydrogenation. However, traditional pyrometallurgy is expensive and requires a large amount of energy consumption.
Hydrometallurgy is another way to recycle metals with more convenience and less energy consumption.10 If the goal is the separation of valuable metals, the leaching of iron and silicon ions is undesirable. In these cases, bioleaching11,12 and high-pressure leaching13,14 can be used to recycle copper. On the other hand, metal ions contribute to the liquid catalytic oxidation of SO2,15,16 and elements such as iron and silicon are important components for water treatment17–19 and soil remediation.20 Thus, it is important to explore the leaching behavior of metals in copper tailings to improve the application possibility of copper tailings. Rogowski et al.21 used various acids for the dissolution of metals from copper flotation tailings. However, to the best of our knowledge, the acid leaching behavior with respect to iron has rarely been reported.
Herein, a theoretical analysis of the leaching of iron from copper tailings was performed. Then, the effects of key factors on iron leaching were investigated, including the reaction temperature, sulfuric acid concentration, ratio of solid to liquid (S/L ratio), and stirring speed. The kinetics of leaching was also analyzed based on a shrinking model. The behavior of Ca, Zn, Cu, and Si in the leaching process was also studied. Characterizations including X-ray fluorescence (XRF), X-ray diffraction (XRD), X-ray photoelectron spectroscopy (XPS), scanning electron microscopy (SEM), Fourier transform infrared spectroscopy (FTIR), as well as the measurements of particle size distribution (PSD), and magnetic properties were investigated to reveal the leaching behavior of copper tailings.
2. Experimental
2.1. Materials
The copper tailings used in this study were obtained from the Yunnan Tin Group (Holding) Company Limited, China. The major element components present in the copper tailings are shown in Table 1. Other chemicals, including H2SO4 (98%, Xilong Chemical Group Co. Ltd.), were of analytical grade.
Table 1 The XRF analysis of copper tailings before and after leaching
| Component |
Raw copper tailings (wt%) |
Copper tailings after 1 h leaching (wt%) |
Copper tailings after 2 h leaching (wt%) |
| Fe |
36.76 |
28.49 |
28.44 |
| Si |
14.25 |
17.16 |
17.11 |
| Ca |
3.06 |
4.65 |
5.00 |
| Al |
2.45 |
3.62 |
3.76 |
| Zn |
2.06 |
1.65 |
1.69 |
| Mg |
1.03 |
0.32 |
0.29 |
| Na |
0.88 |
0.78 |
0.77 |
| K |
0.44 |
0.57 |
0.59 |
| Cu |
0.26 |
0.25 |
0.24 |
| S |
0.17 |
0.69 |
0.65 |
| As |
0.17 |
0.21 |
0.22 |
| Mn |
0.11 |
0.06 |
0.05 |
2.2. Instruments and procedure
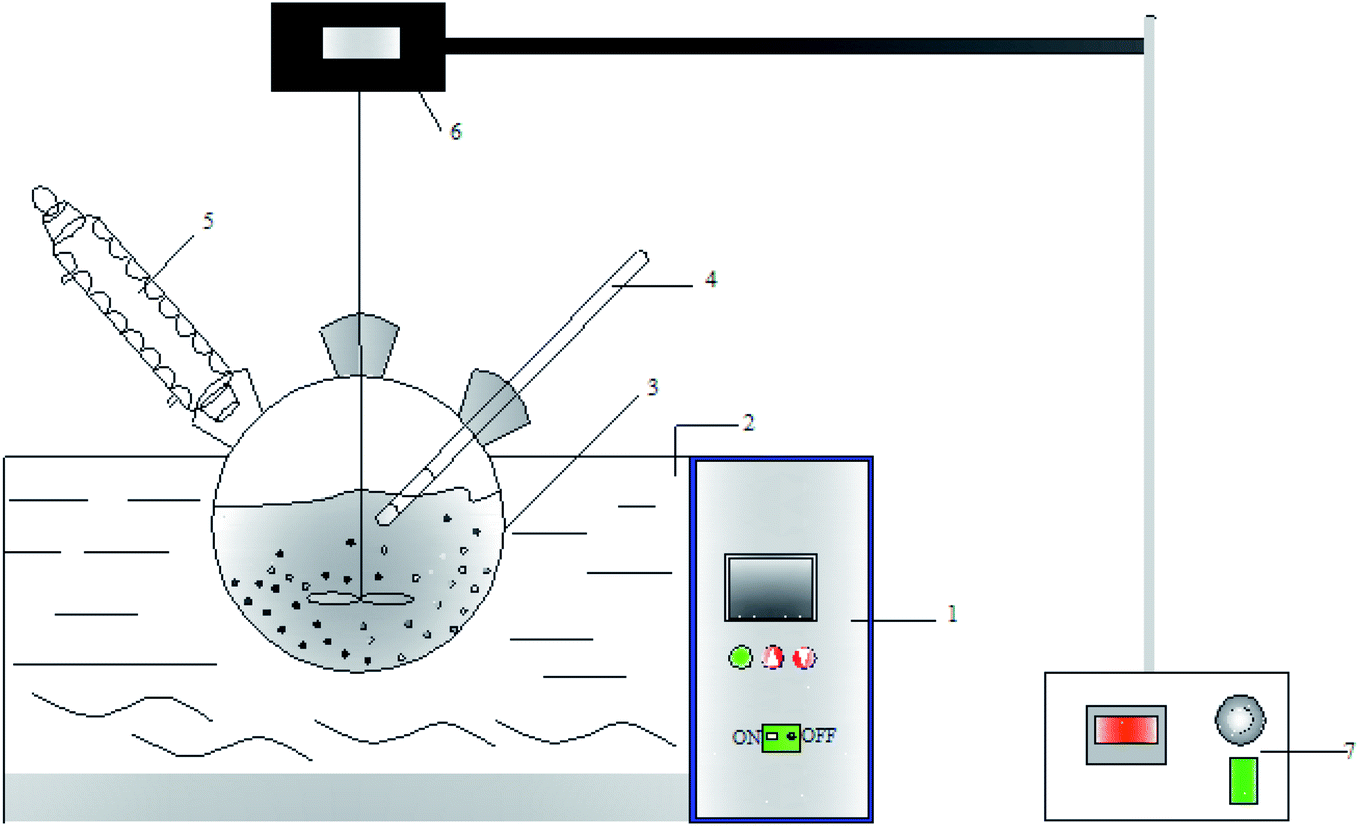
Fig. 1 shows the set-up used to study the leaching process of copper tailings. The experiments were performed according to the following procedure. First, 200 mL of the leaching agent was prepared using H2SO4 and deionized water, and poured into a three-necked round-bottom flask. The leaching agent was heated to the desired temperature. Then, the copper tailings were added into the flask at the set speed. At the desired time interval, 4 mL of the solution was removed and filtered. The iron ion concentration in the filtrate was measured via titration.15 The Ca2+, Zn2+, Cu2+ and Si4+ ion concentration in the filtrate was measured using ICP-OES (Agilent 730). Each sulfuric acid leaching experiments of copper tailings was repeated three times, and the average value of these three values was used to reported to avoid any errors.
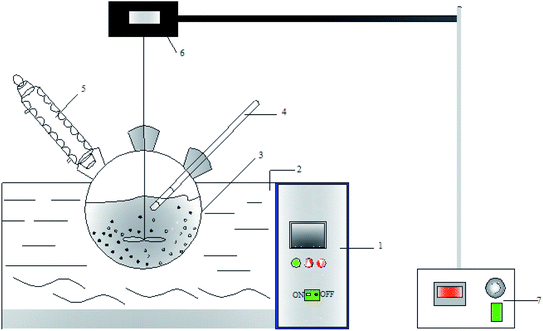 |
| | Fig. 1 Diagram of the setup used to study the leaching process: 1 – water bath thermostat; 2 – water bath; 3 – three necked round-bottom flask; 4 – thermometer; 5 – condenser; 6 – mechanical agitator; 7 – stirring speed controller. | |
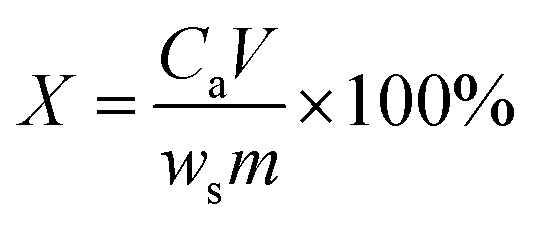
The metal ion leaching rate for Fe2+, Ca2+, Zn2+, Cu2+ and Si4+ was calculated using eqn (1).
| |
 | (1) |
where
X is the leaching rate of the target metal, %;
Ca is the ion concentration in the leachate, mg L
−1;
V is the volume of leachate,
L;
ws is the elemental content of the target metal in the copper tailings, wt%; and
m is the mass of copper tailing, g.
2.3. Kinetic analysis
In a heterogeneous solid/liquid leaching reaction system, the soluble reactants diffuse across the interface and/or through the solid layer first.22,23 The leaching is generally controlled by either diffusion through the product layer, chemical reaction at the surface of the solid particles or a mixture of diffusion and chemical reaction.
If the leaching is controlled by diffusion through the product layer, it will follow the rate equation,23 expressed in eqn (2).
| | |
1 − (2/3)X − (1 − X)2/3 = kdt
| (2) |
If the leaching is controlled by the chemical reaction at the surface of the solid particles, it will follow the rate equation,23 expressed in eqn (3).
where
X is the fraction reacted for iron;
kd and
kr are the rate constants for diffusion through the product layer and chemical reaction at the surface of the solid particles (min
−1), respectively, and
t is the leaching time (min).
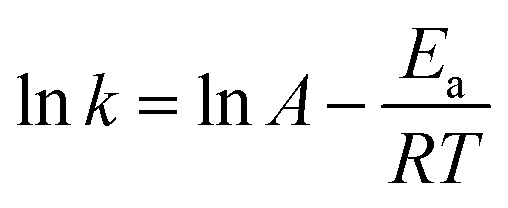
The apparent activation energy can be obtained using eqn (4).
| |
 | (4) |
where
A is the frequency factor,
Ea is the apparent activation energy,
R is the ideal gas constant (8.314 J mol
−1 K
−1), and
T is the leaching temperature (K).
2.4. Characterization of the samples
The elemental composition of the copper tailings before and after the leaching reaction was detected using an XRF spectrometer (PANalytical Axios, Holland). The crystalline phases of the tailings were identified via XRD (D8 Advance, Germany) with Cu Kα radiation (α = 0.154056 nm). XPS (Thermo Fisher, USA) was used to identify the states of the main elements in the samples. Surface morphology and composition were identified via SEM (GeminiSEM 300, Germany) with EDS (Oxford X-MAX, Germany). The functional groups and particle size distribution in the samples were recorded using an FTIR (Bruker Vertex 70, Germany) and a laser diffraction particle size analyzer (Mastersizer 3000, USA). Magnetic properties were determined using a vibrating sample magnetometer (PPMS-9, USA).
3. Results and discussion
3.1. Theoretical analysis of the leaching behavior of copper tailings
The leaching of copper tailings in the sulfuric acid solution may involve the reactions shown in eqn (5)–(10).11,24,25 The Gibbs free energy (ΔG°) is calculated to be −101.81 kJ mol−1 for Fe3O4, −203.58 kJ mol−1 for Fe2SiO4, −265.06 kJ mol−1 for CaO, −114.65 kJ mol−1 for CuO, −131.22 kJ mol−1 for ZnO, and −399.03 kJ mol−1 for CuS, implying that metallic oxide can be directly leached under acidic condition, while oxidation is necessary for the leaching of CuS.26,27| | |
Fe3O4 + H2SO4 = FeSO4 + Fe2O3 + H2O
| (5) |
| | |
Fe2SiO4 + 2H2SO4 = 2FeSO4 + H4SiO4
| (6) |
| | |
CaO + H2SO4 = CaSO4 + H2O
| (7) |
| | |
CuO + H2SO4 = CuSO4 + H2O
| (8) |
| | |
ZnO + H2SO4 = ZnSO4 + H2O
| (9) |
| | |
2CuS + O2 + 2H2SO4 = 2CuSO4 + 2S + 2H2O
| (10) |
Fig. 2(a) depicts the Eh-pH diagram of the Fe–Si–H2O system at 25 °C under aFe2+(aq) = 1. Fe3O4 leaching requires more acidic conditions than Fe2SiO4, indicating that there exists a region in which Fe2SiO4 is leached, while Fe3O4 is not leached. The plots of the Gibbs free energy change versus temperature, as shown in Fig. 2(b), further indicate that Fe3O4 and Fe2SiO4 can be leached into the sulfuric acid solution. ΔrH for both reactions is negative between 0 and 100 °C, as shown in Fig. 2(c), indicating that the two reactions are exothermic.
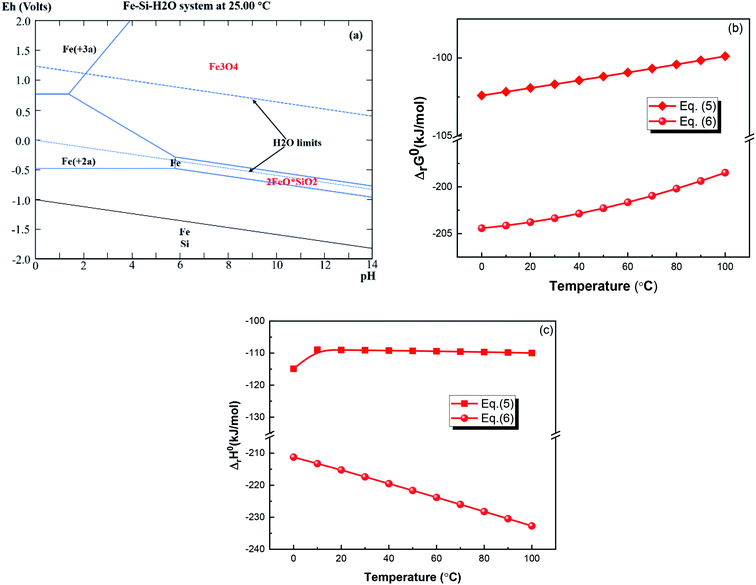 |
| | Fig. 2 (a) Eh-pH diagram of the Fe–Si–H2O system at 25 °C under aFe2+(aq) = 1, (b) ΔrG0 vs. T, and (c) ΔrH0 vs. T for eqn (5) and (6) (drawn by the HSC 6.0 chemistry software, Outokumpu Research; FactSage web, ThermFact Inc. & GTT-Technologies). | |
3.2. Leaching kinetics of iron
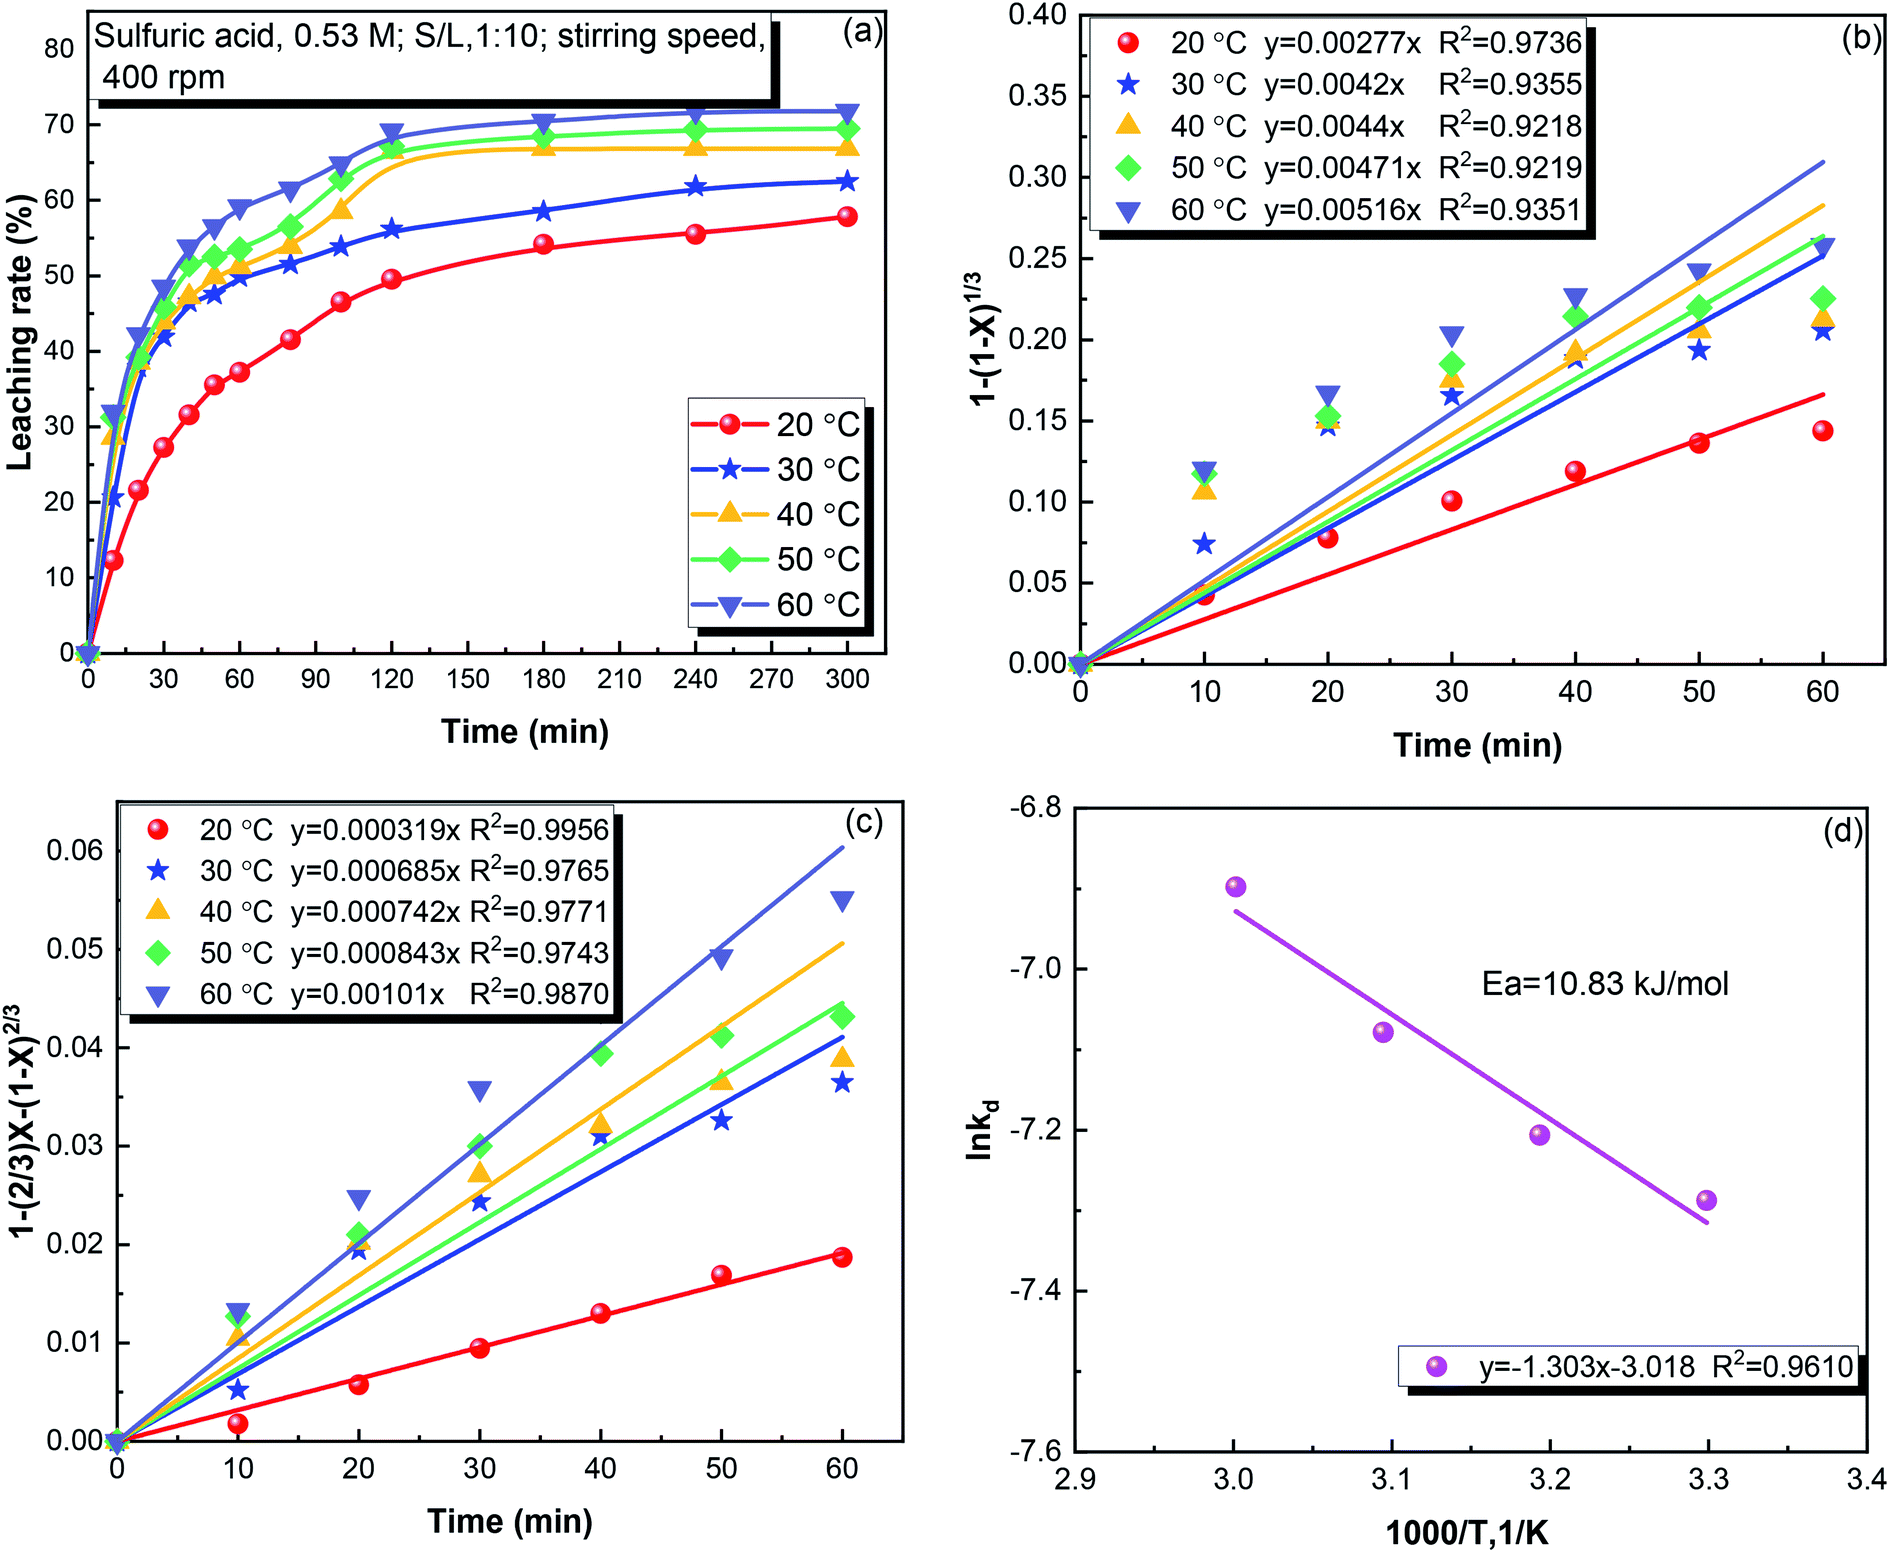
3.2.1. Effect of the leaching temperature. Temperature plays a vital role in the leaching reaction.28 The effect of temperature in the range of 20–60 °C on the leaching of iron is shown in Fig. 3. As shown in Fig. 3(a), the leaching temperature significantly affects the iron leaching. Iron leaching rapidly proceeded in the first 120 min, and then proceeded more slowly. The leaching of iron was 49.53% at 20 °C, and increased to 69.18% at 60 °C. As shown in Fig. S1,† when the leaching temperature reached 50 °C, some of the Fe3O4 gradually decomposed to increase the iron ion concentration. To separate Fe3O4, the dissolution of Fe3O4 must be avoided. Thus, 40 °C was determined to be the optimum temperature, and used for subsequent experiments.
 |
| | Fig. 3 (a) The effect of temperature on the leaching rate of iron from copper tailings, (b) 1 − (1 − X)1/3 versus time at different temperatures, (c) 1 − 2/3X−(1 − X)2/3 versus time at different temperatures, and (d) lnkd versus temperature. | |
Fig. 3(b and c) shows the fits of the iron leaching results using the chemical reaction and diffusion control model, respectively. The diffusion control model provided a better fit to the data, indicating that diffusion control was the rate-limiting process. The apparent activation energy for the iron leaching from copper tailings was calculated to be 10.83 kJ mol−1 using the Arrhenius equation, as shown in Fig. 3(d). The apparent activation energy being below 12 kJ mol−1 (ref. 23) confirms that the leaching was controlled by diffusion. Moreover, the apparent activation energy was lower than that (38.69 kJ mol−1) of pyrite cylinder (mainly consisting of Fe2O3 and Fe3O4),29 indicating that iron was not supplied by Fe3O4 in the copper tailings.
3.2.5. Kinetic model. According to the experimental results described above, the leaching of iron from copper tailings was determined to be controlled by the product diffusion model. The leaching of iron can be expressed by the following equation.| |
 | (11) |
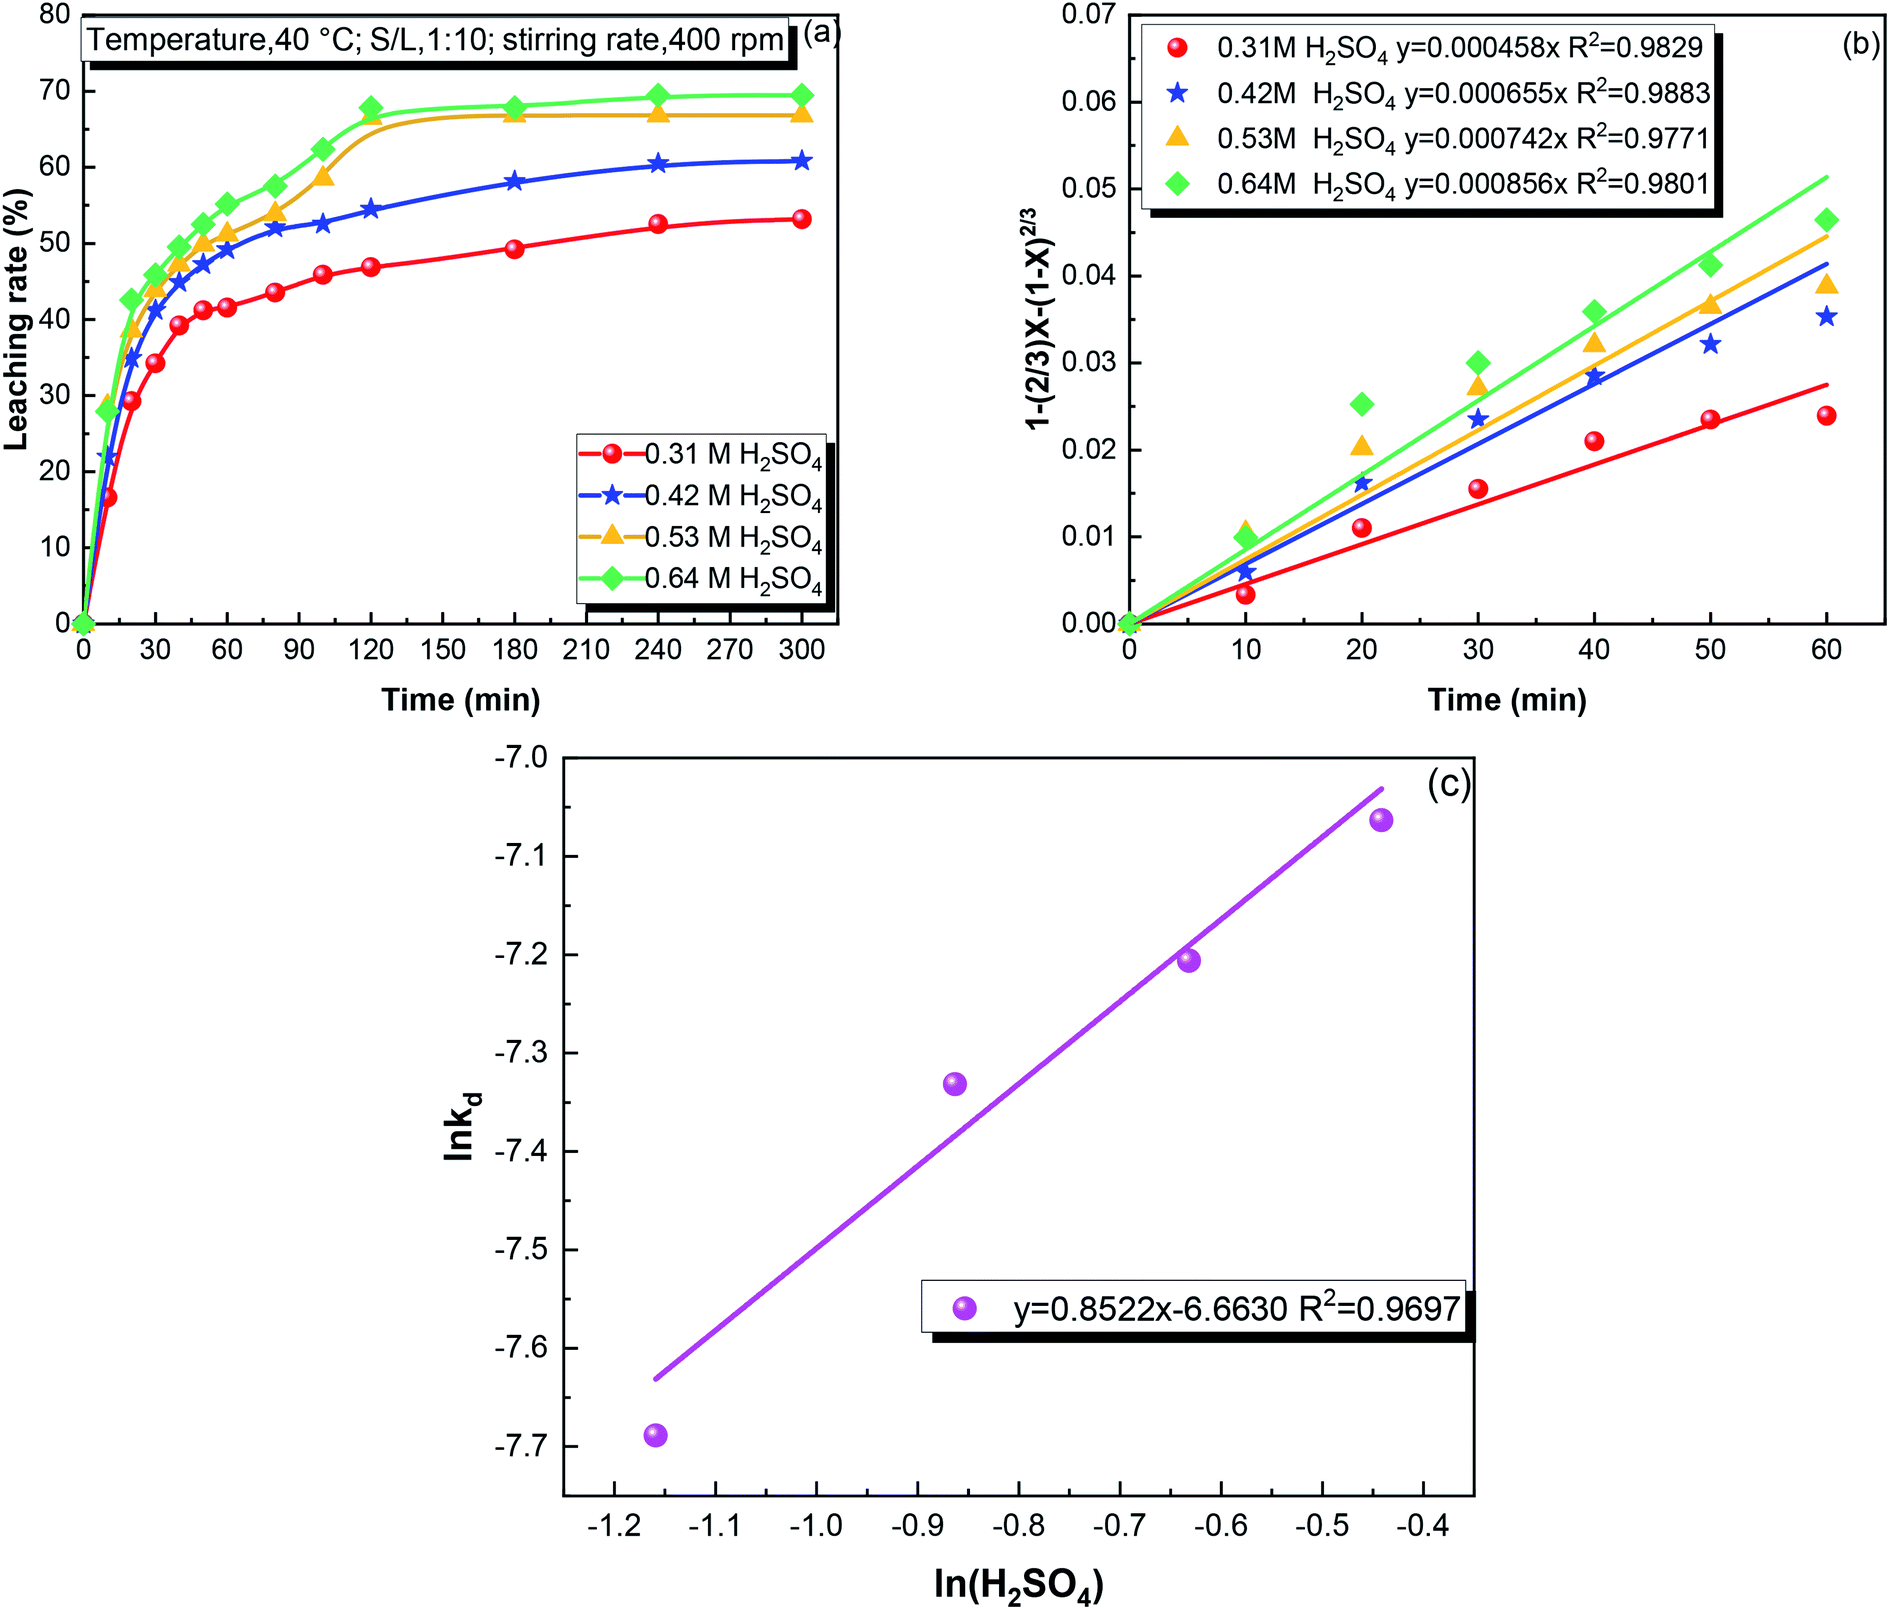
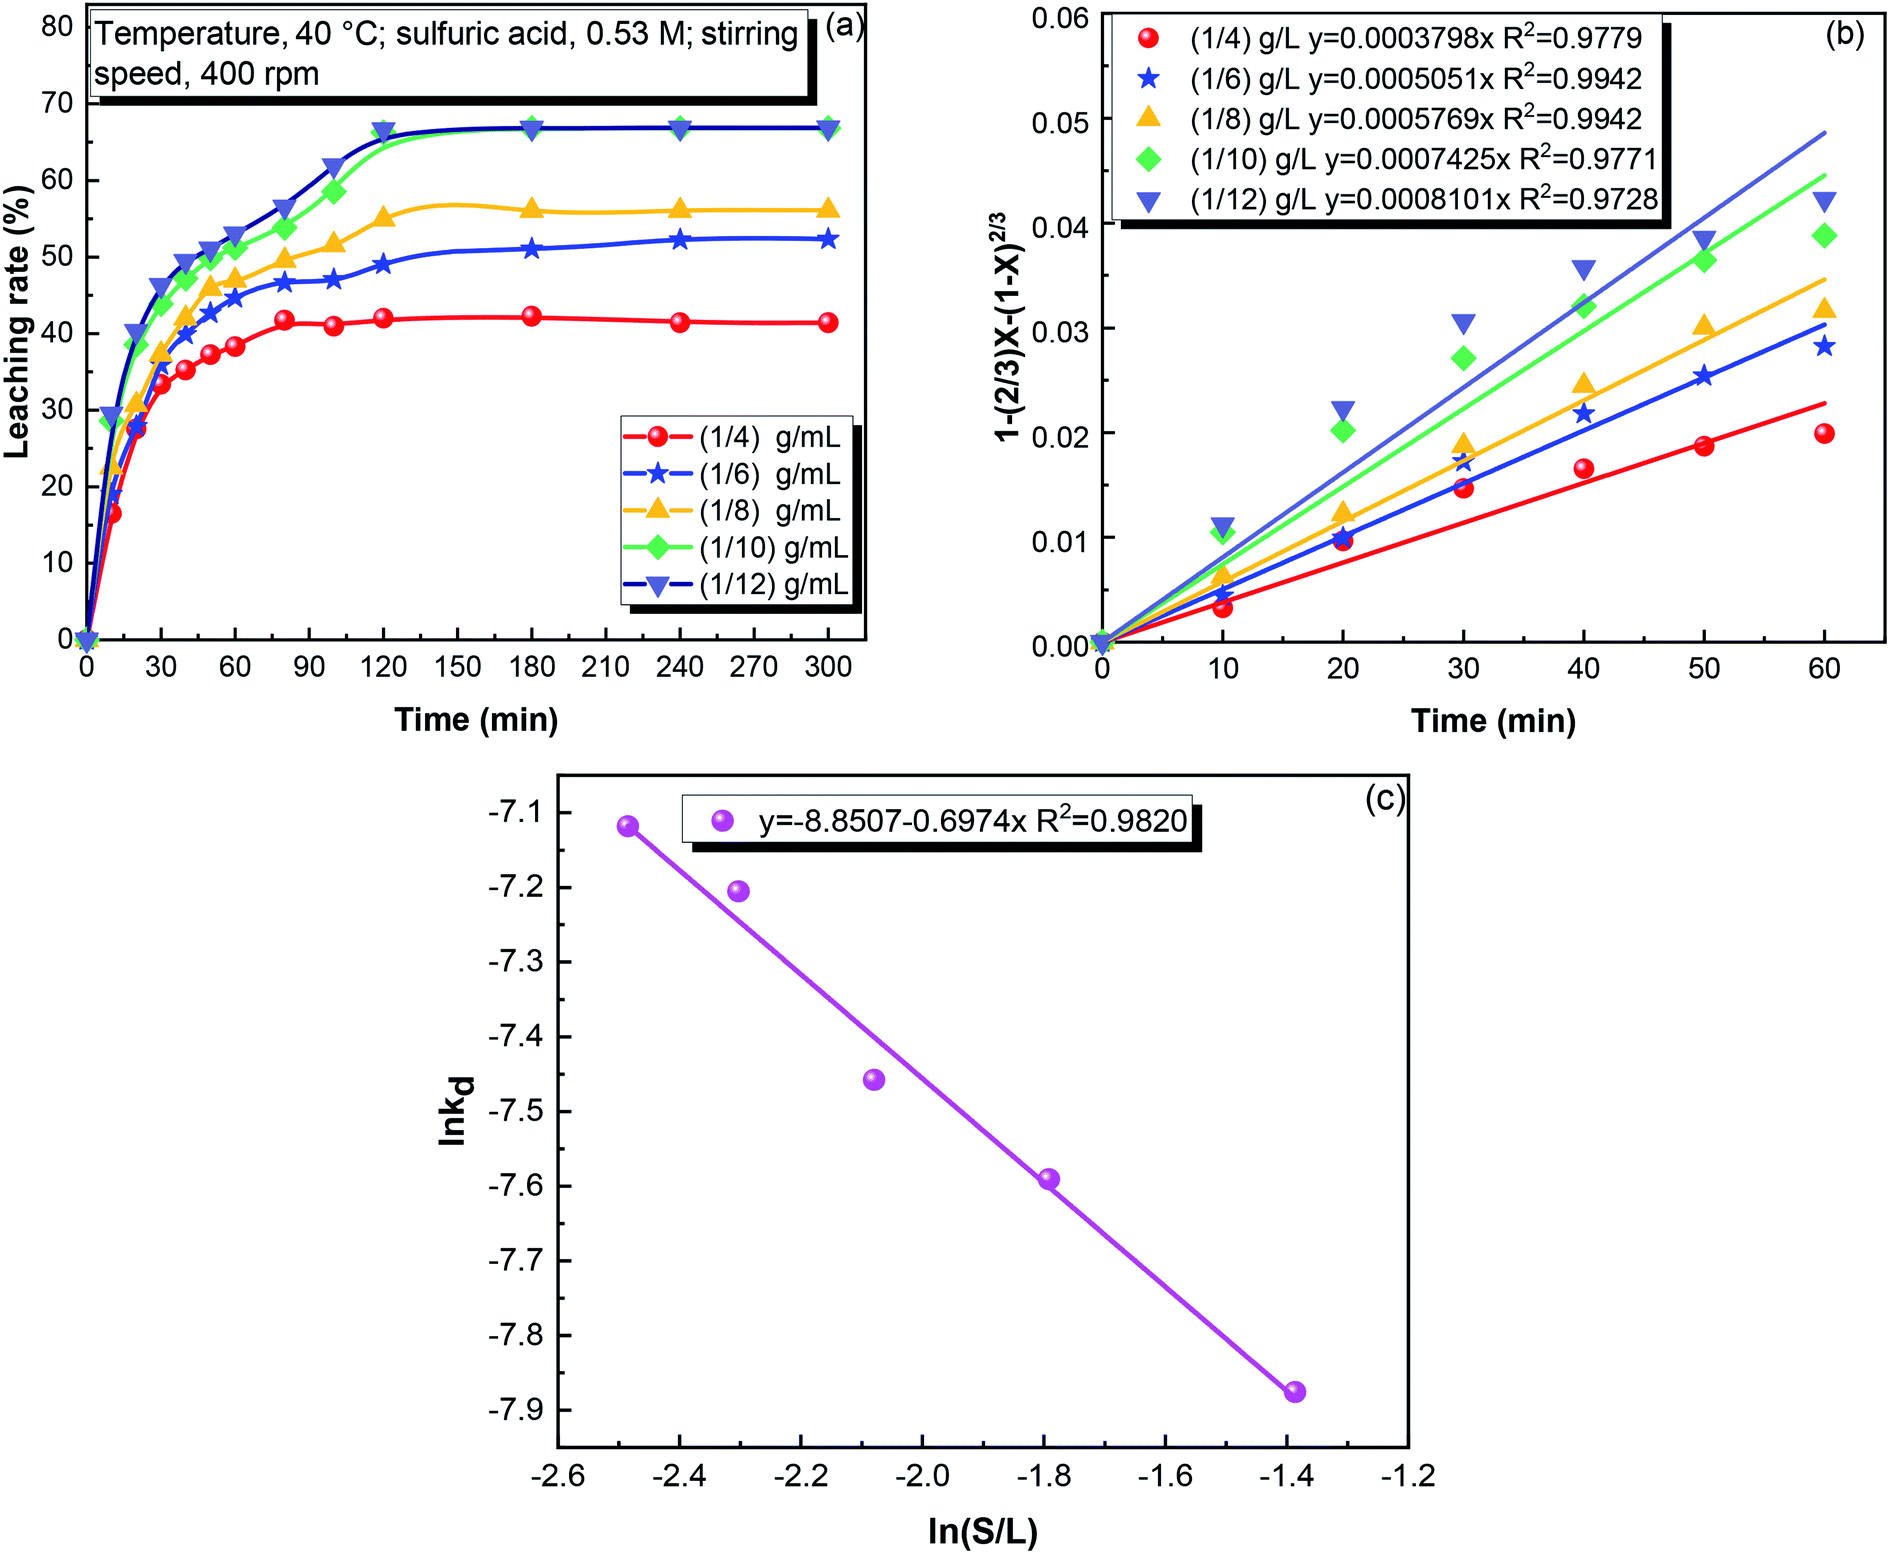
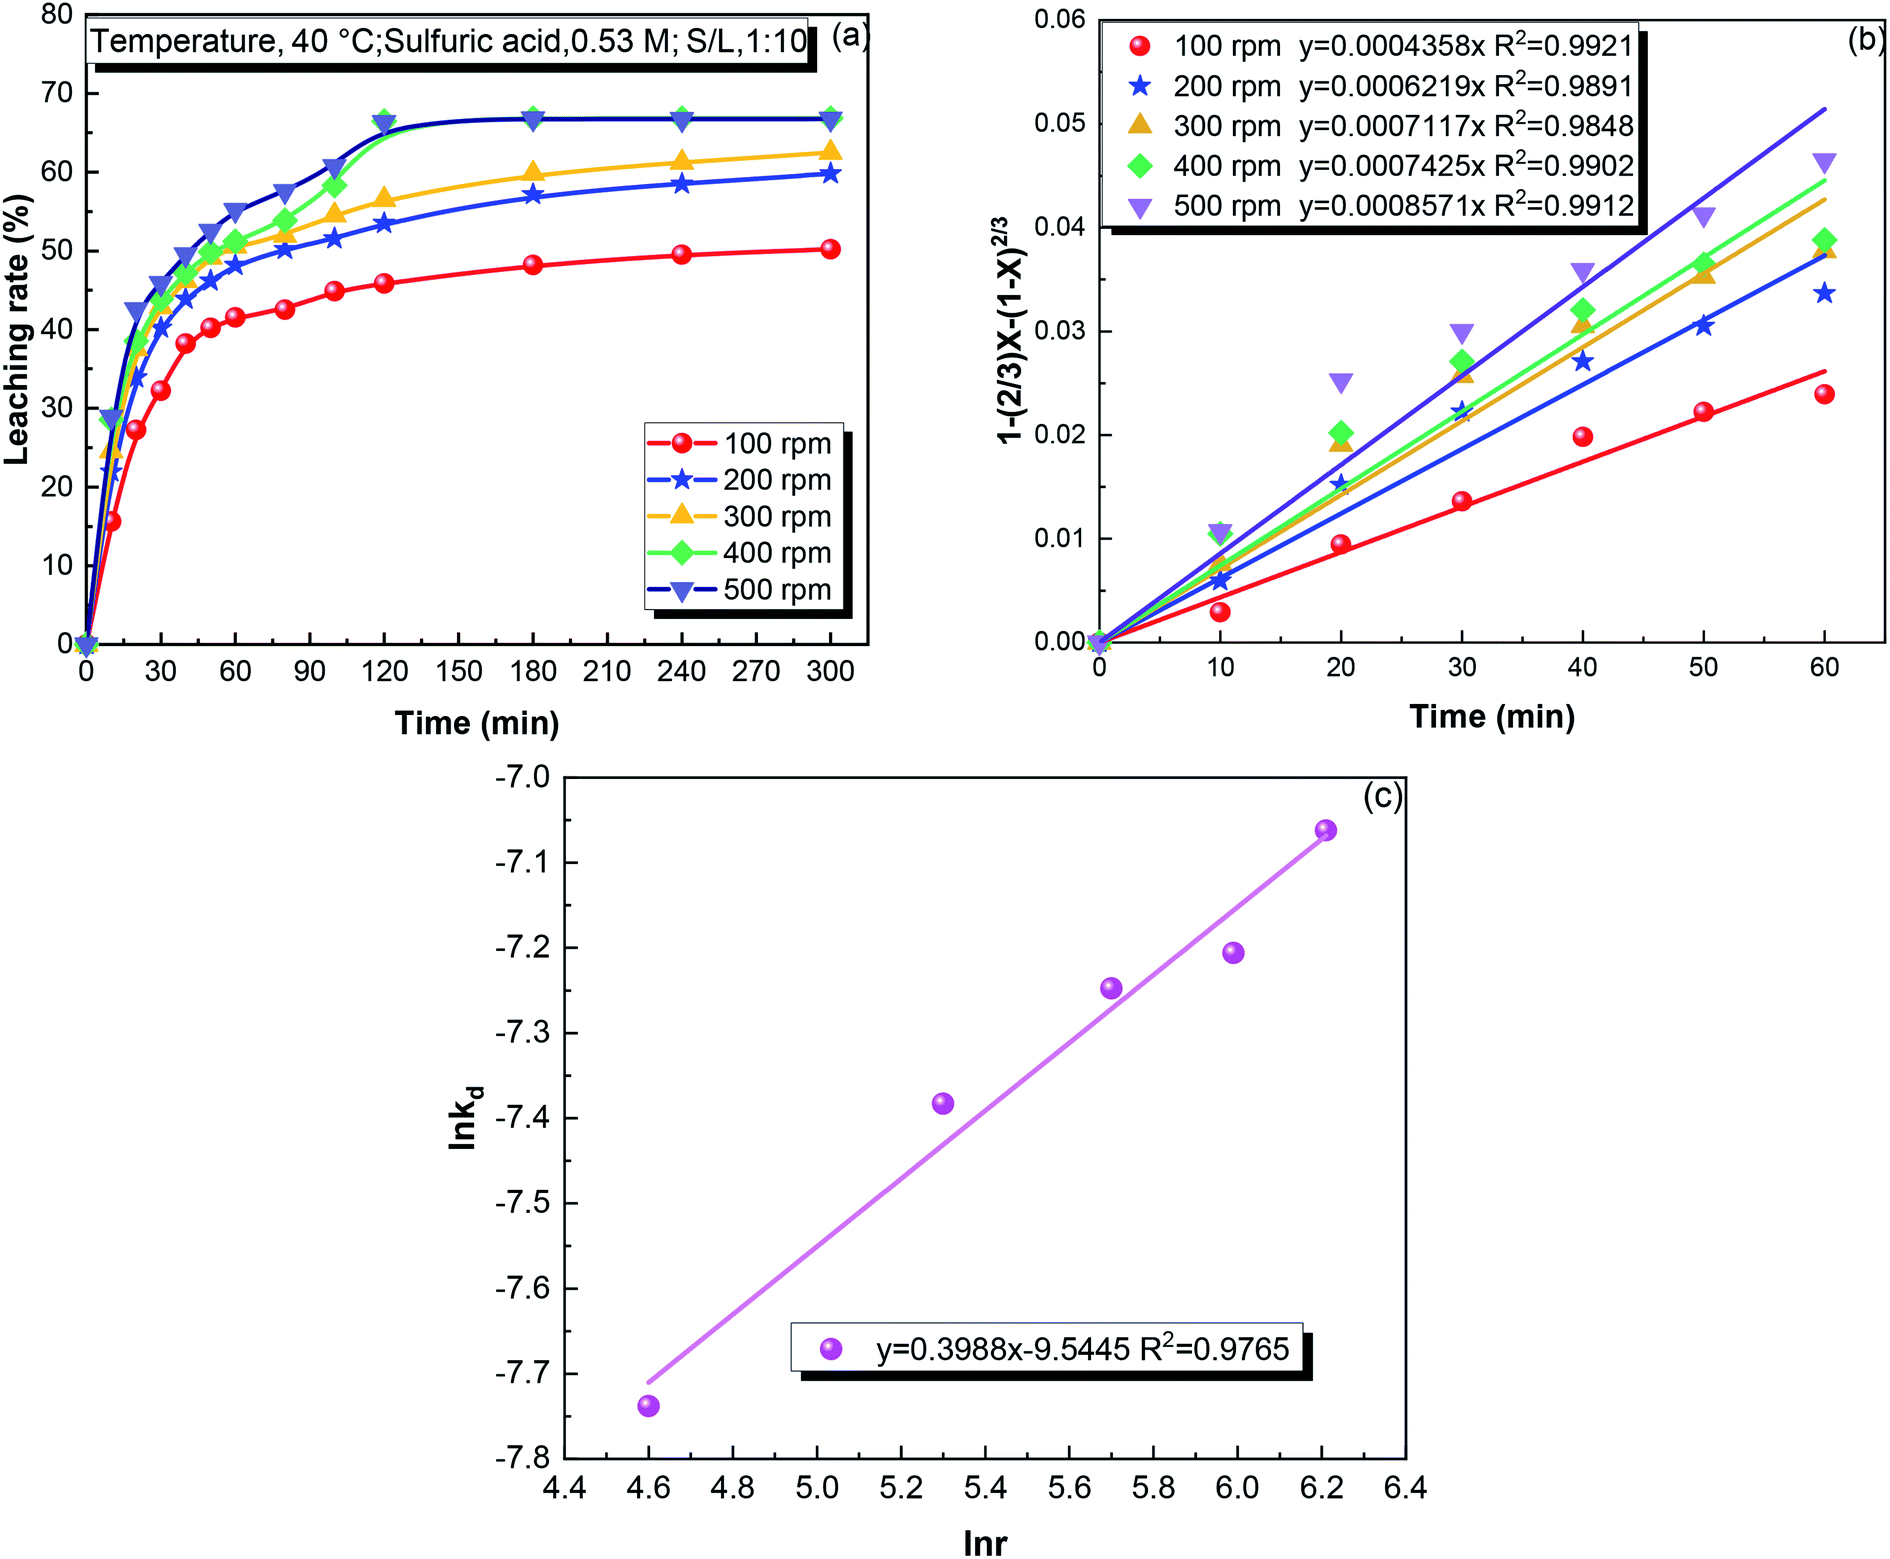
where X is the fraction of iron reacted, k0 is the correlation coefficient, [H2SO4] is the concentration of sulfuric acid (mol L−1), S/L is the ratio of solid to liquid, and r is the stirring speed (rpm).
3.3. Leaching behaviors of Ca, Zn, Cu and Si
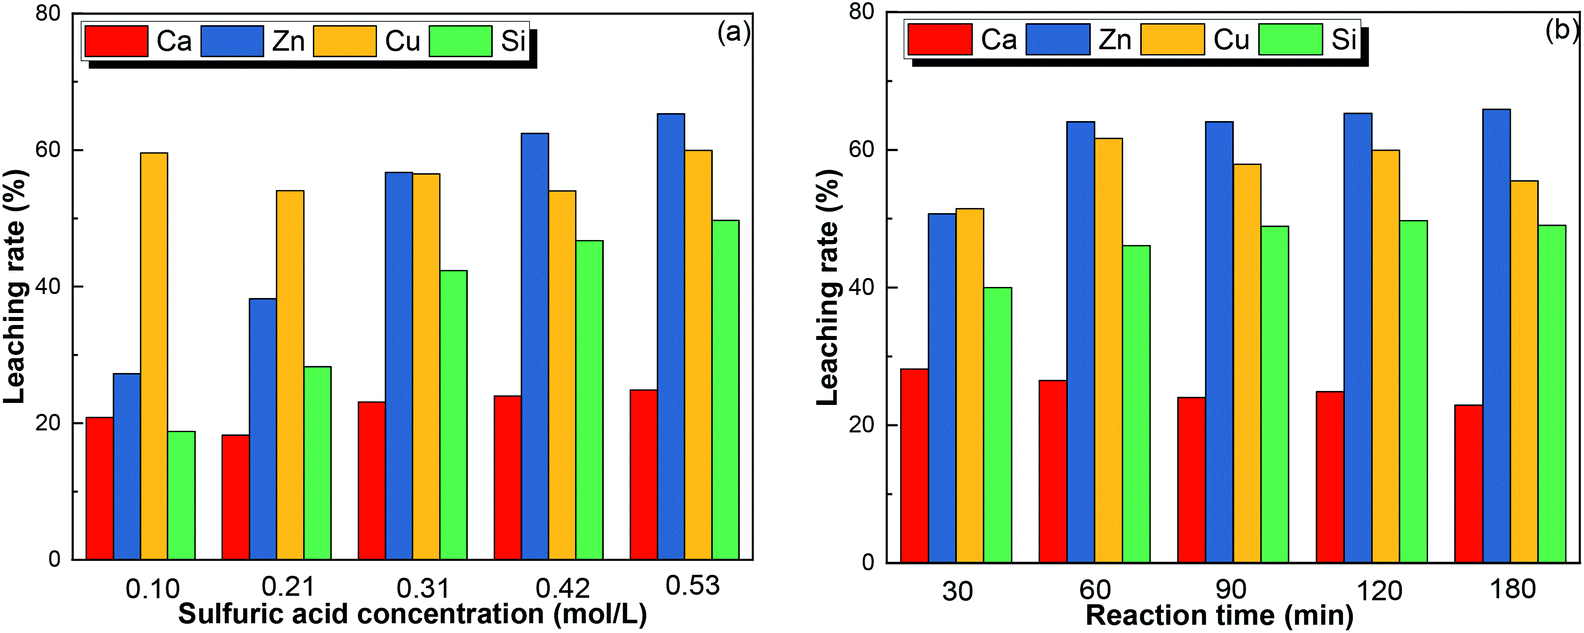
As the other main elements in the copper tailings, the leaching behaviors of Ca, Zn, Cu, and Si were studied, as presented in Fig. 7. The sulfuric acid concentration significantly affected the leaching rate of Zn and Si, while it had no effect on the leaching of Ca and Cu. When the sulfuric acid concentration was increased from 0.10 to 0.53 mol L−1, the leaching rate increased from 27.23 to 65.32% for Zn and from 18.80 to 49.03% for Si. The leaching rate was constant at roughly 20% for Ca and 59% for Cu, respectively, indirectly indicating that Ca and Cu were more easily leached from the copper tailings. As shown in Fig. 7(b), at S/L of 1:10 and sulfuric acid concentration of 0.53 mol L−1, Ca was the first element to achieve an optimal leaching rate, followed by Zn and Cu. The leaching rate of Zn increased from 50.70 to 64.08% when the leaching time increased from 30 to 60 min. These results are consistent with the mineral composition of copper tailings.31–34 Regarding the recovery of metals, Fig. S3† demonstrates a process route for the recovery of metals based on fractional precipitation,35 providing a possible way to recover Cu, Zn, and Fe.
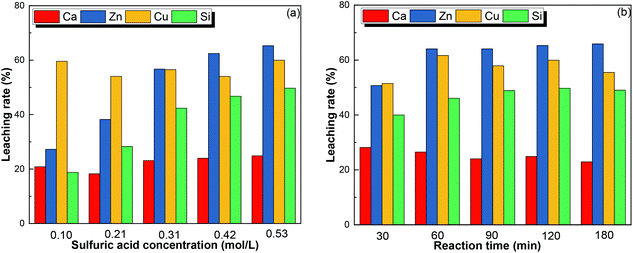 |
| | Fig. 7 The leaching rate of Cu, Zn, Ca, and Si at (a) different sulfuric acid concentrations, and (b) different leaching times under the optimum conditions. | |
3.4. Characterization of the raw and treated copper tailings
3.4.1. XRF. The concentrations (by weight) of the major elements in the raw and leached copper tailings are listed in Table 1. After 2 h of leaching, the Fe content decreased from 36.76% to 28.44%, Zn decreased from 2.06% to 1.69%, and Cu decreased from 0.26% to 0.24%. It shows that Fe, Zn, and Cu were leached differently in the process, which may be attributed to the crystal structure and morphology of copper tailings. Theoretically, the Fe contents in pure Fe2SiO4, Fe3O4, and CaFeSi2O6 are 54.81%, 72.35%, and 22.51%, while the Si contents in pure Fe2SiO4 and CaFeSi2O6 are 13.78% and 22.64%, respectively. The presence of Ca, Fe, and Si in the leached copper tailings indicates that it can be used as cement raw materials, avoiding secondary pollution.36
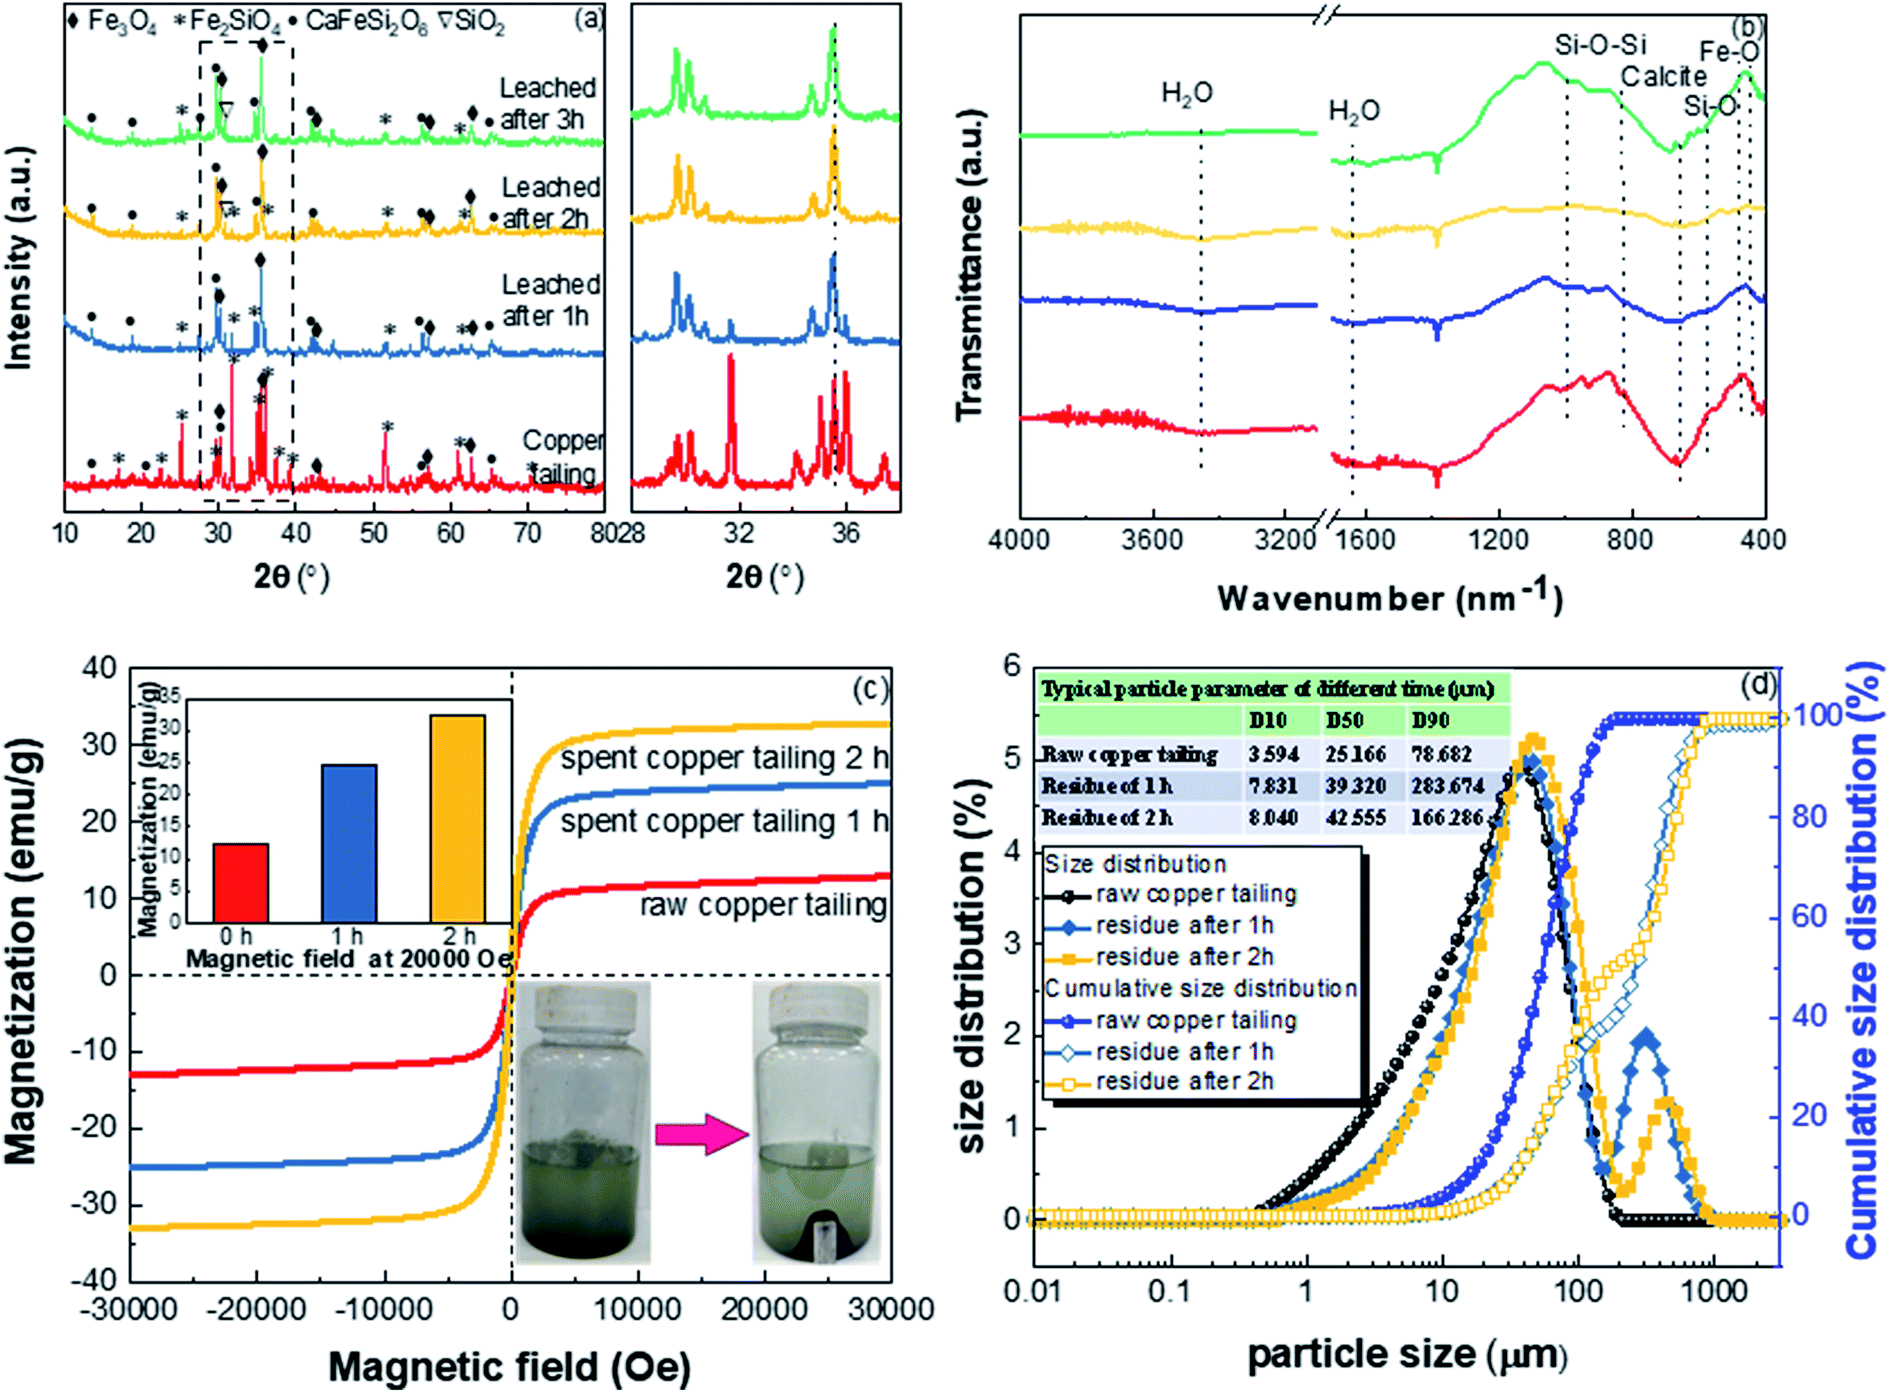
3.4.2. XRD, FTIR, magnetization, and particle size. Fig. 8(a) shows the XRD patterns of raw and leached copper tailings. Fe2SiO4, Fe3O4, and CaFeSi2O6 are the main crystalline phases of the raw copper tailings. During the leaching process, most of Fe2SiO4 gradually disappeared, while peak intensity related to Fe3O4 and CaFeSi2O6 were relatively stable. The results are consistent with the thermodynamic calculations and mineral properties.37
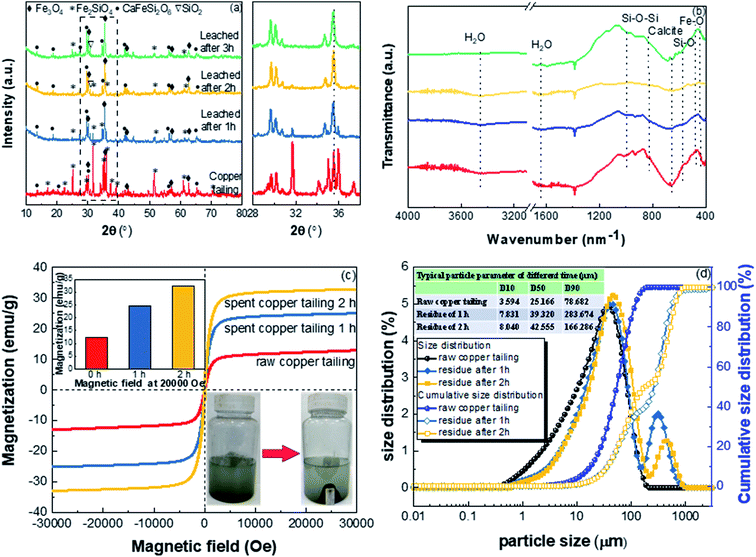 |
| | Fig. 8 (a) XRD patterns, (b) FTIR spectra, (c) magnetic hysteresis loops, and (d) PSD of raw and leached copper tailings. | |
FT-IR spectra of the raw and leached copper tailings are shown in Fig. 8(b). The absorption peaks at around 1640 cm−1 are ascribed to O–H bending vibrations, peaks at around 1097 cm−1 correspond to the symmetrical stretching vibrations of Si–O–Si, and peaks at about 798 and 467 cm−1 correspond to the symmetrical stretching vibrations of Si–O.38,39 After leaching, the intensity of the Si–O stretching vibration peak slightly weakened, while the other main peaks remained almost identical. This is consistent with the dissolution of Fe2SiO4, while the other main structures of the copper tailings were stable during the leaching.
To further verify the identity of the species involved in acid leaching, the magnetic properties of ferrite were investigated at room temperature using PPMS DynaCool, and the results are shown in Fig. 8(c). The magnetic properties of the copper tailings increased with leaching. The reason for this is that the nonmagnetic components and the weakly magnetic Fe(II) in fayalite were leached by the acid and migrated to the liquid.
The particle size distributions of raw and leached copper tailings are plotted in Fig. 8(d). The average particle sizes of the raw copper tailings and residuals after 1 h and 2 h of leaching were 25.2, 39.3, and 42.6 μm, respectively. Compared to the raw copper tailings, the average particle size of the leached copper tailings did not change noticeably, further indicating that the leaching process followed the shrinking core model. Moreover, particles in the size range of 211.0–974.5 μm were found in the leached copper tailings, which are due to the formation of insoluble substances, including CaSO4 and SiO2.
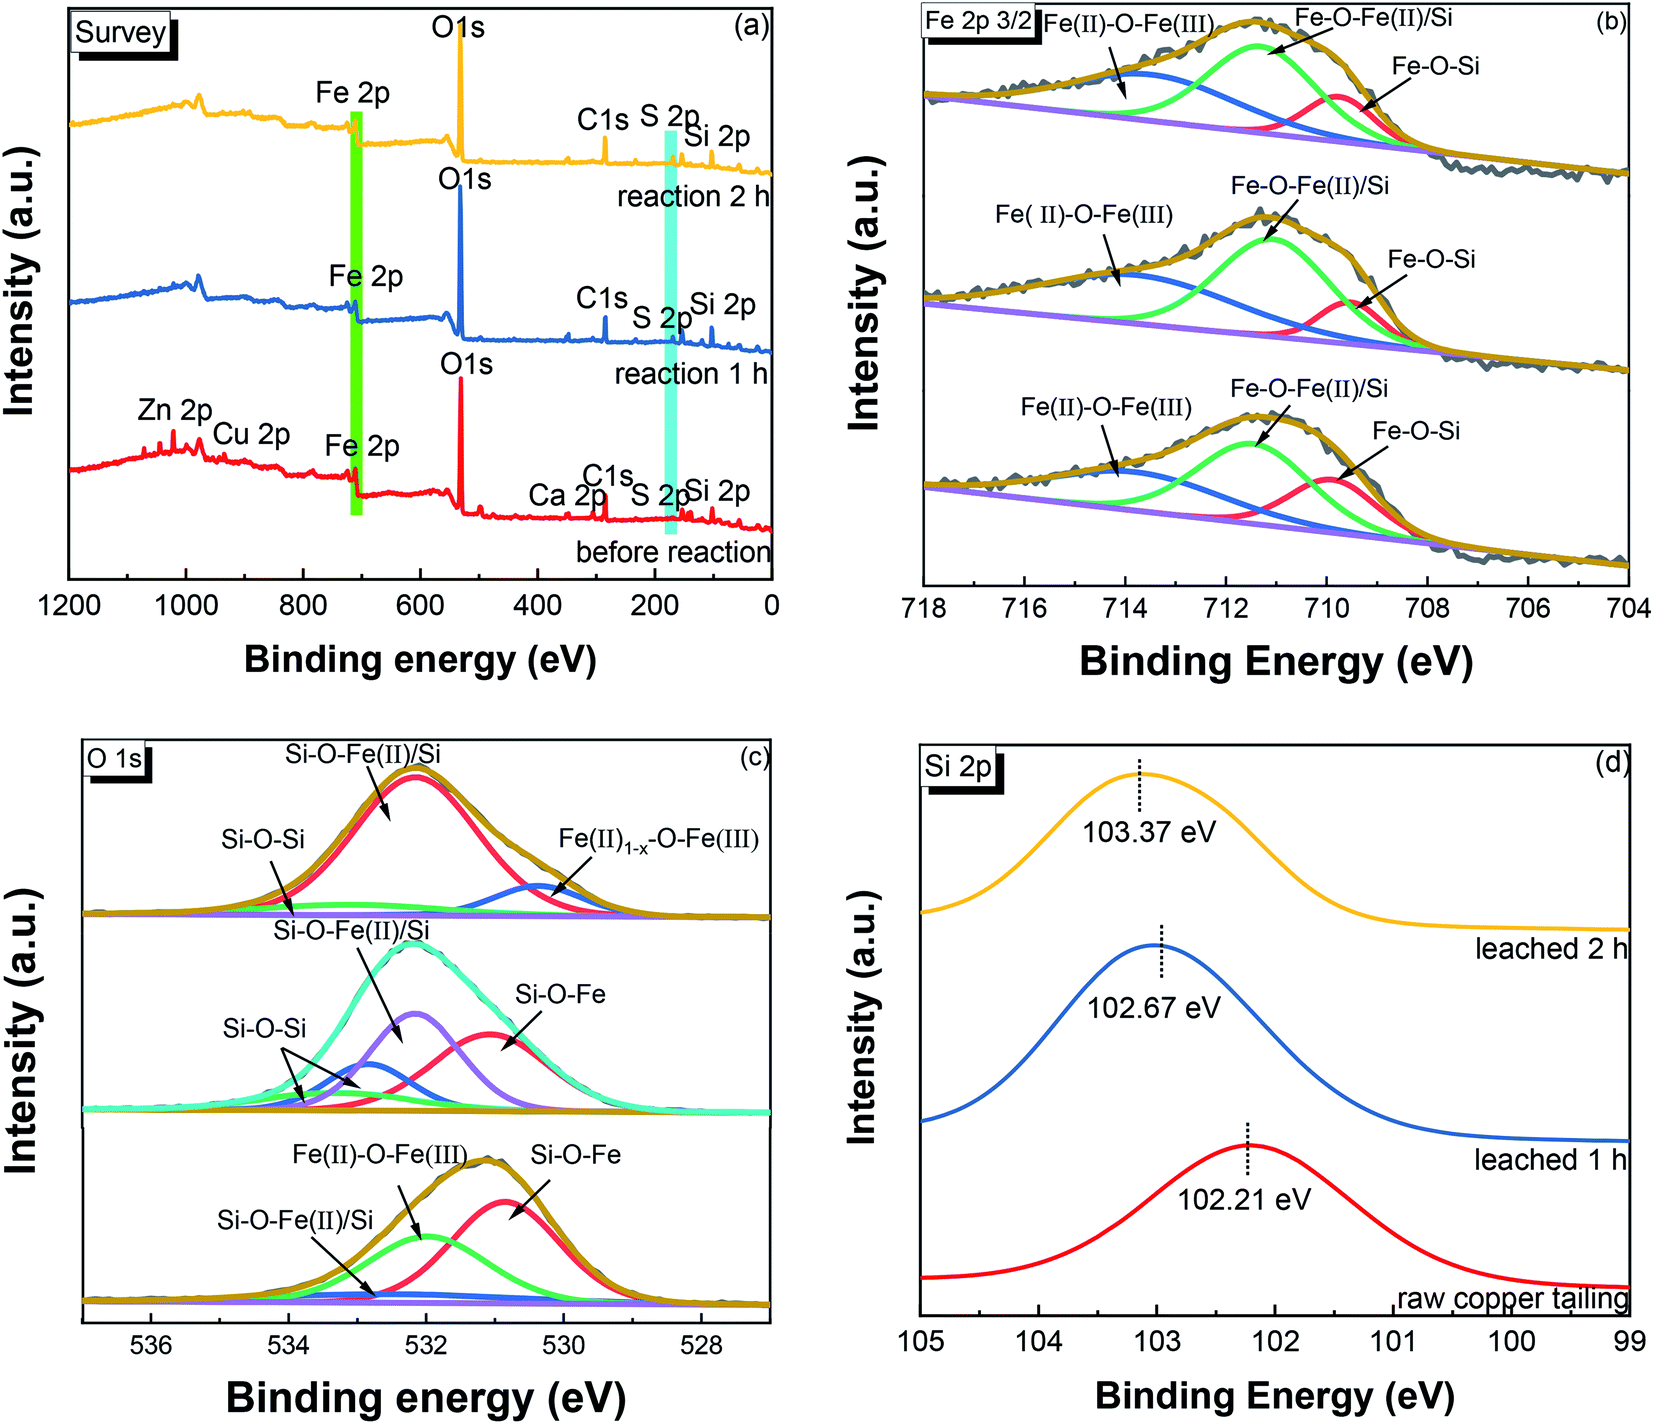
3.4.3. XPS. To further investigate the chemical changes involved in the leaching process, XPS data were collected for the Fe 2p, O 1s, and Si 2p core levels from raw and leached copper tailings.The survey scans in Fig. 9(a) show that the relative intensity of the Fe 2p and Zn 2p peaks decreased, while a relatively stronger S 2p characteristic peak could be observed from the samples after acid leaching, which is consistent with the XRF result and which might be due to the deposition of sulfate in the leached copper tailings. Fig. 9(b) shows the XPS spectra of Fe 2p, where the binding energy of 713.79 eV is attributed to Fe(II)–O–Fe(III), while the peak at 709.88 eV corresponds to Si–O–Fe.40 A summary of the Fe 2p fitting results and the Fe chemical state in the near surface region is shown in Table 2. The relative content of Si/Fe–O–Fe decreased from 66.92% to 61.27%, while that of Fe(II)–O–Fe(III) increased from 33.08% to 38.73% during leaching, implying that Fe2+ was leached from Fe2SiO4. Fig. 9(c) shows the O 1s spectra, which indicated that Si–O–Si was present in the leached copper tailings.41 The binding energy of O 1s shifted to a higher energy after leaching. The relative abundance result (Table S1†) indicated that SiO2 was generated in the process. The Si 2p feature also shifted to a higher binding energy after leaching, as shown in Fig. 9(d), indicating the decrease in the electron density near the silicon atoms.40,41
 |
| | Fig. 9 XPS spectra of the raw and leached copper tailings. (a) Survey scan, and detailed scans in the (b) Fe 2p, (c) O 2p, and (d) Si 2p regions. | |
Table 2 Peak positions, full width at half maximum (FWHM), and relative abundance of chemical states from fitting the Fe 2p2/3 feature from raw and leached copper tailings
| Sample |
BE (eV) |
FWHM (eV) |
State of iron |
Percentage (%) |
| Raw copper tailings |
709.88 |
2.04 |
Si–O–Fe(II) |
22.59 |
| 713.79 |
4.11 |
Fe(II)–O–Fe(III) |
33.08 |
| 711.46 |
2.66 |
Fe–O–Fe(II)/Si |
44.33 |
| Copper tailings after leaching 1 h |
709.50 |
1.45 |
Si–O–Fe(II) |
11.24 |
| 713.75 |
4.64 |
Fe(II)–O–Fe(III) |
41.61 |
| 711.04 |
2.62 |
Fe–O–Fe(II)/Si |
47.14 |
| Copper tailings after leaching 2 h |
709.72 |
1.60 |
Si–O–Fe(II) |
15.16 |
| 713.45 |
3.95 |
Fe(II)–O–Fe(III) |
38.72 |
| 711.28 |
2.52 |
Fe–O–Fe(II)/Si |
46.11 |
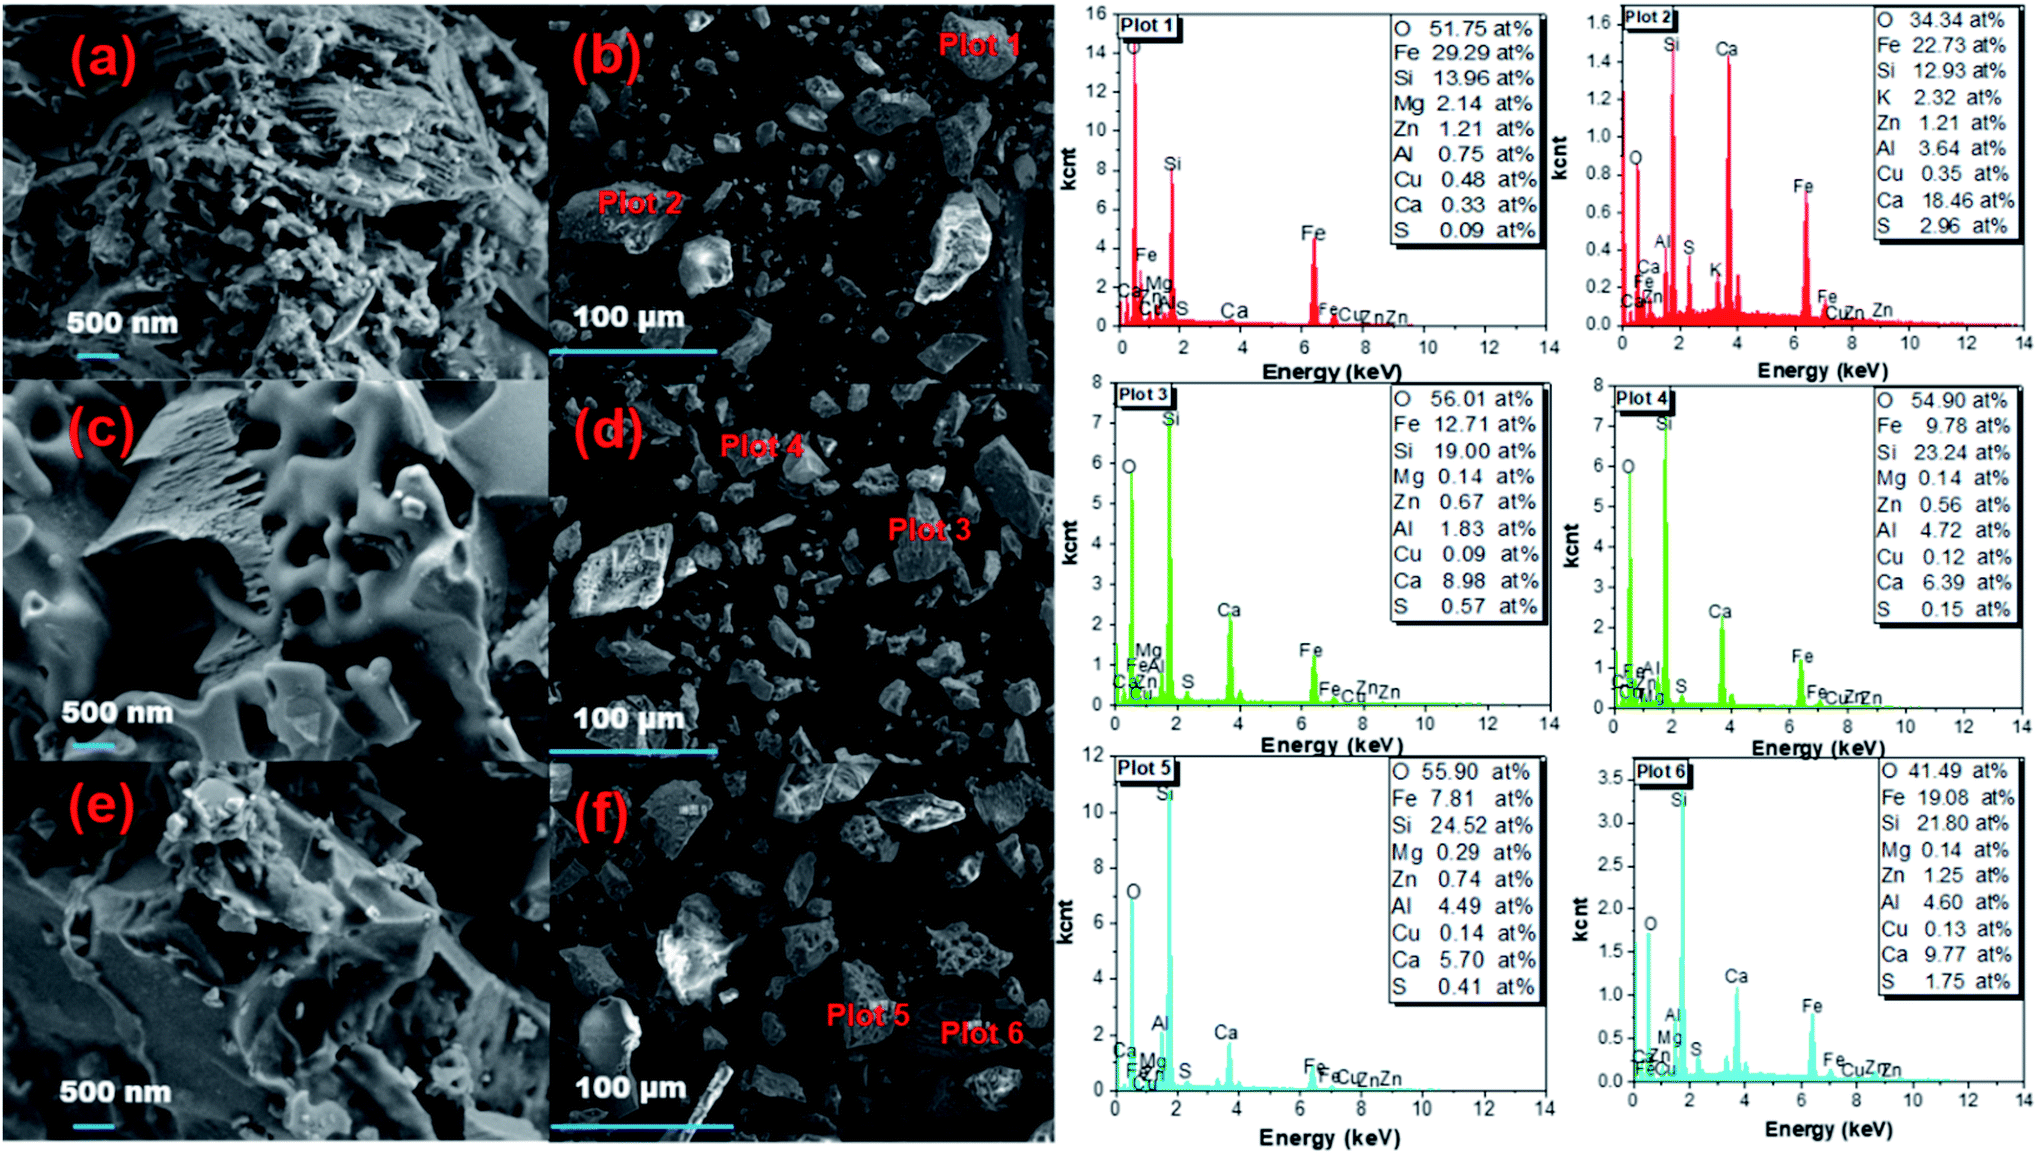
3.4.4. SEM/EDS. Images showing the morphology of the raw and leached copper tailings are presented in Fig. 10. The raw copper tailing appeared as compact and uneven solid (Fig. 10(a and b)). In comparison, some irregular holes and small loose particles were observed in the leached copper tailings (Fig. 10(c–f)). The related EDS analysis indicated that during leaching Fe was extracted, while the content of S and Si increased. Small particles (CaSO4 and SiO2) may accumulate and cover the surface of copper tailing, thus impeding the sulfuric acid from diffusing to the interior of the particles and leaching the iron.
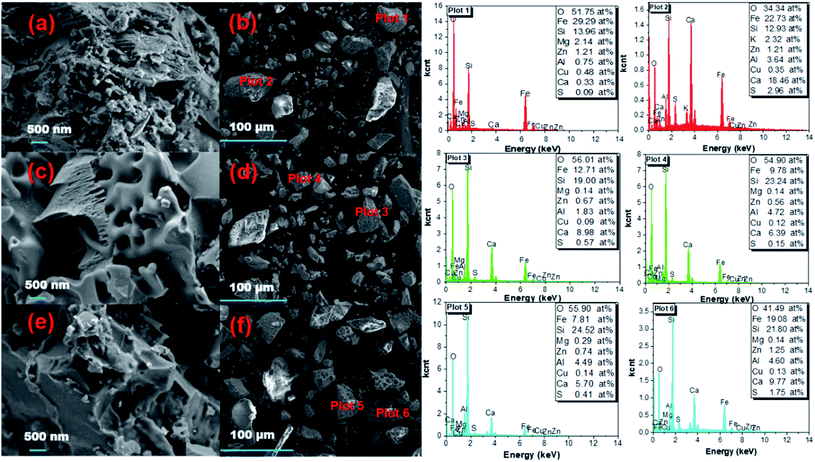 |
| | Fig. 10 SEM/EDS analysis of raw and leached copper tailings. (a and b) Raw copper tailings, (c and d) copper tailings after leaching for 1 h, and (e and f) copper tailings after leaching for 2 h. | |
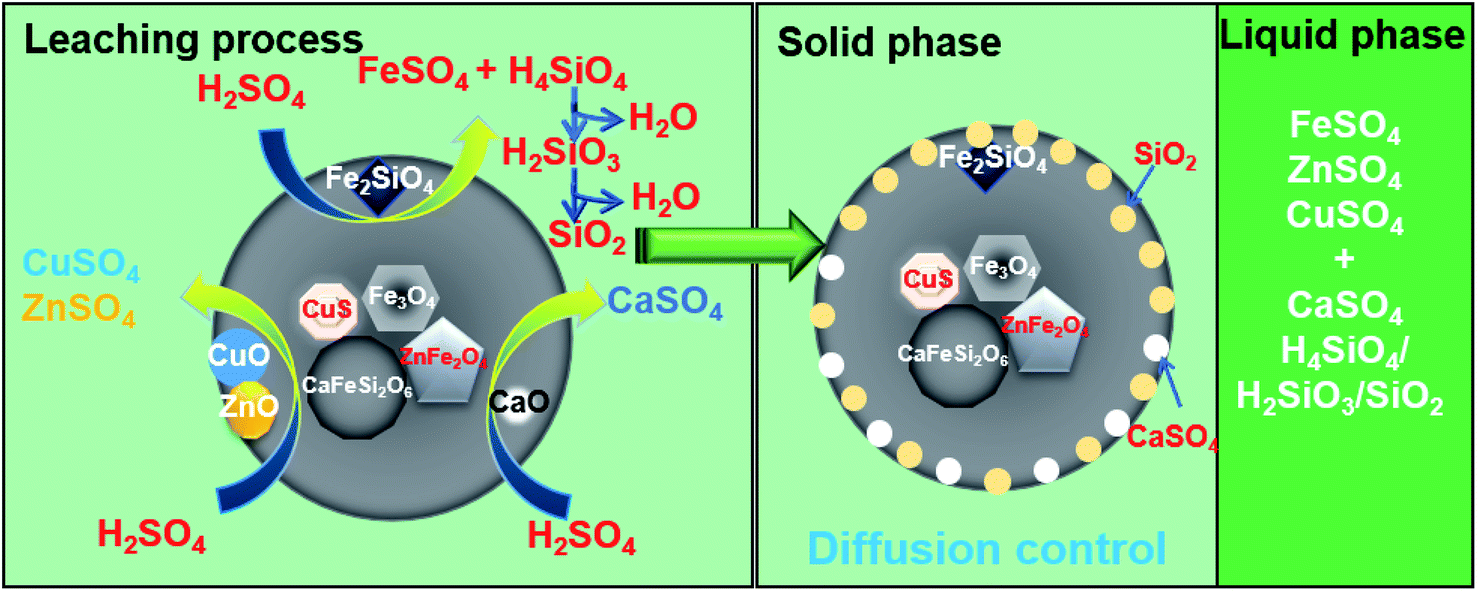
3.5. Mechanism of leaching
Based on the results discussed above, a leaching mechanism can be proposed, which is shown in Fig. 11. When the copper tailings are contacted with sulfuric acid, oxides (including CaO, CuO, and ZnO) from the copper tailings preferentially react with sulfuric acid, generating sulfates (including CaSO4, CuSO4, and ZnSO4).11,24,25 Subsequently, Fe2SiO4 reacts with sulfuric acid, thus generating FeSO4 and H4SiO4. As the reaction proceeds, H4SiO4 is partly converted into H2SiO3 and SiO2.42 The accumulation of SiO2 and CaSO4 reduces the contact of sulfuric acid with the soluble iron of copper tailings, thus inhibiting the further leaching of iron. Sulfuric acid concentration and temperature both have a significant effect on leaching process. When the sulfuric acid concentration reached 0.53 mol L−1, FeO from Fe3O4 was slightly decomposed.25 However, an excess of sulfuric acid would destroy the leaching system due to the rapid formation of H4SiO4 by the quick dissolution of Fe2SiO4.11 The elevated temperature enhances the leaching of metal ions and oxidation of Fe2+ to Fe3+. In the presence of Fe3+, the copper leaching rate is enhanced.43
 |
| | Fig. 11 Schematic of the mechanism of the sulfuric acid leaching of copper tailing. | |
4. Conclusions
In this study, the leaching characteristics of the major metal components from copper tailings by sulfuric acid were investigated, with a particular focus on iron. After 120 min, 66.45% of Fe, along with 65.32% of Cu and 59.95% of Zn in the tailings were leached under the optimal conditions of 40 °C, sulfuric acid concentration of 0.53 mol L−1, stirring speed of 400 rpm, and solid/liquid ratio of 1:10. The iron leaching was found to be controlled by the product diffusion model with an apparent activation energy of 10.83 kJ mol−1. The reaction orders for the sulfuric acid concentration, stirring speed, and solid/liquid ratio were 0.85, −0.70, and 0.40, respectively. During leaching, the amount of Fe2SiO4 in copper tailings was obviously reduced, while that of Fe3O4 remained stable. The accumulation of CaSO4 and SiO2 inhibited the further leaching of iron.
Conflicts of interest
There are no conflicts to declare.
Acknowledgements
This work was supported by the National Key Research and Development Program of China (2018YFC0213400, 2017YFC0210500,), and the National Natural Science Foundation of China (No. 51868030).
References
- Z. L. Zuo, Q. B. Yu, S. Y. Luo, J. K. Zhang and E. Z. Zhou, Energy Fuels, 2020, 34, 491–500 CrossRef CAS.
- R. Sharma and R. A. Khan, J. Clean Prod., 2018, 171, 1171–1186 CrossRef CAS.
- F. Vargas and M. Lopez, J. Clean Prod., 2018, 182, 427–436 CrossRef CAS.
- B. Mikoda, H. Kucha, A. Potysz and E. Kmiecik, Appl. Geochem., 2018, 98, 459–472 CrossRef CAS.
- Z.Q. Guo, J. Pan, D.Q. Zhu and F. Zhang, J. Clean Prod., 2018, 199, 891–899 CrossRef CAS.
- A. Jarosikova, V. Ettler, M. Mihaljevic, B. Kribek and B. Mapani, J. Environ. Manage., 2017, 187, 178–186 CrossRef CAS.
- S.W. Zhou, Y.G. Wei, B. Li and H. Wang, J. Clean Prod., 2019, 217, 423–431 CrossRef CAS.
- S.W. Zhou, Y.G. Wei, S.Y. Zhang, B. Li, H. Wang, Y.D. Yang and M. Barati, J. Clean Prod., 2019, 236, 117668 CrossRef CAS.
- I. Fuentes, C. Ulloa, R. Jiménez and X. García, J. Hazard. Mater., 2020, 387, 121693 CrossRef CAS.
- M. K. Khalid, J. Hamuyuni, V. Agarwal, J. Pihlasalo, M. Haapalainen and M. Lundström, J. Clean Prod., 2019, 215, 1005–1013 CrossRef CAS.
- M. I. Muravyov, N. V. Fomchenko, A. V. Usoltsev, E. A. Vasilyev and T. F. Kondrat'eva, Hydrometallurgy, 2012, 119–120, 40–46 CrossRef CAS.
- S. Stankovic, I. Moric, A. Pavic, S. Vojnovic, B. Vasiljevic and V. Cvetkovic, J. Serb. Chem. Soc., 2015, 80, 391–405 CrossRef CAS.
- B. Han, B. Altansukh, K. Haga, Z. Stevanovic, R. Jonovic, L. Avramovic, D. Urosevic, Y. Takasaki, N. Masuda, D. Ishiyama and A. Shibayama, J. Hazard. Mater., 2018, 352, 192–203 CrossRef CAS.
- G.C. Shi, Y.L. Liao, B.W. Su, Y. Zhang, W. Wang and J.J. Xi, Sep. Purif. Technol., 2020, 241, 116699 CrossRef CAS.
- L. Tao, X. Q. Wang, P. Ning, L. L. Wang and W. J. Fan, Fuel Process. Technol., 2019, 192, 36–44 CrossRef CAS.
- H. Wang, B. Yuan, R. L. Hao, Y. Zhao and X. P. Wang, Chem. Eng. J., 2019, 378, 122155 CrossRef CAS.
- X. S. Meng, S. A. Khoso, J. H. Kang, J. Q. Wu, J. D. Gao, S. Y. Lin, M. R. Wu, W. Sun and Y. H. Hu, J. Clean Prod., 2019, 241, 118371 CrossRef CAS.
- Z.D. Yuan, G.Q. Zhang, X. Ma, L. Yu, X. Wang, S.F. Wang and Y.F. Jia, Chem. Eng. J., 2019, 378, 122126 CrossRef.
- Y. K. Li, X. Zhu, X. J. Qi, B. Shu, X. Zhang, K.Z. Li, Y.G. Wei and H. Wang, Chem. Eng. J., 2020, 394, 124833 CrossRef CAS.
- J. Mu, Z. Y. Hu, L. J. Huang, Z. J. Xie and P. E. Holm, Environ. Pollut., 2020, 257, 113565 CrossRef CAS.
- M. Rogowski, T. Smolinski, M. Pyszynska, M. Brykala and A. G. Chmielewski, Nukleonika, 2018, 63, 131–137 CAS.
- C. Zhang, X.B. Min, J.Q. Zhang, M. Wang, Y.C. Li and J.C Fei, J. Clean Prod., 2016, 113, 910–918 CrossRef CAS.
- M. Li, S.L. Zheng, B. Liu, H. Du, D. B. Dreisinger, L. Tafaghodi and Y. Zhang, Waste Manag., 2017, 65, 128–138 CrossRef CAS.
- E. H. Oelkers, J. Declercq, G. D. Saldi, S. R. Gislason and J. Schott, Chem. Geol., 2018, 500, 1–19 CrossRef CAS.
- A. H. Kaksonen, S. Särkijärvi, E. Peuraniemi, S. Junnikkala, J. A. Puhakka and O. H. Tuovinen, Hydrometallurgy, 2017, 168, 135–140 CrossRef CAS.
- A. Muszer, J. Wodka, T. Chmielewski and S. Matuska, Hydrometallurgy, 2013, 137, 1–7 CrossRef CAS.
- J. Lee, S. Kim, B. Kim and J. C. Lee, Metals, 2018, 8, 9 Search PubMed.
- J.Y. Ma, Y.F. Zhang, Y.H. Qin, Z.K. Wu, T.L. Wang and C.W Wang, Ultrason. Sonochem., 2017, 35, 304–312 CrossRef CAS.
- Z. Z. Shi, M. R. Wang, G. K. Zhang and L. Zhang, Asian J. Chem., 2013, 25, 105–109 CrossRef CAS.
- L. Deng, B. Qu, S. Su, S. Ding and W. Sun, Arabian J. Sci. Eng., 2018, 44, 5335–5344 CrossRef.
- Y.J. Wang, S.M. Wen, Q.C. Feng, Y.J. Xian and D. Liu, Russ. J. Non-Ferrous Met., 2015, 56, 127–133 CrossRef.
- Y. Li, H. Liu, B. Peng, X. Min, M. Hu, N. Peng, Y. Yuang and J. Lei, Hydrometallurgy, 2015, 158, 42–48 CrossRef CAS.
- D. M. Urosevic, M. D. Dimitrijevic, Z. D. Jankovic and D. V. Antic, Physicochem. Probl. Miner. Process, 2015, 51, 73–82 Search PubMed.
- A. Krol, K. Mizerna and M. Bozym, J. Hazard. Mater., 2019, 121502, DOI:10.1016/j.jhazmat.2019.121502.
- L. Fang, L. Li, Z. Qu, H. M. Xu, J. F. Xu and N. Q. Yan, J. Hazard. Mater., 2018, 342, 617–624 CrossRef CAS.
- L. Tang, C.B. Tang, J. Xiao, P. Zeng and M.T. Tang, J. Clean Prod., 2018, 201, 764–773 CrossRef CAS.
- F. Ruan, S. Kawanishi, S. Sukenaga and H. Shibata, ISIJ Int., 2020, 60, 419–425 CrossRef CAS.
- Y. X. Nie, S. Li, C. Wu, C. Wang, D. D He and Y. Mei, Ind. Eng. Chem. Res., 2018, 57, 15138–15146 CrossRef CAS.
- M. Ye, G. Li, P. Yan, J. Ren, L. Zheng, D. Han, S. Sun, S. Huang and Y. Zhong, Chemosphere, 2017, 185, 1189–1196 CrossRef CAS.
- Z.B. Wang, Z.W. Zhao, L.F. Zhang, F.S. Liu, B. Peng, L.Y. Chai, D.C. Liu, D.G. Liu, T.Y. Wang, H. Liu and Y.J. Liang, J. Hazard. Mater., 2019, 364, 488–498 CrossRef CAS.
- Z.B. Wang, B. Peng, L.F. Zhang, Z.W. Zhao, D.G. Liu, N. Peng, D.W. Wang, Y.H. He, Y.J. Liang and H. Liu, JOM, 2017, 70, 539–546 CrossRef.
- F. Carranza, N. Iglesias, A. Mazuelos, R. Romero and O. Forcat, Miner. Eng., 2009, 22, 107–110 CrossRef CAS.
- M. M. Antonijevic, M. D. Dimitrijevic, Z. O. Stevanovic, S. M. Serbula and G. D. Bogdanovic, J. Hazard. Mater., 2008, 158, 23–34 CrossRef CAS.
Footnote |
| † Electronic supplementary information (ESI) available. See DOI: 10.1039/d0ra08865j |
|
| This journal is © The Royal Society of Chemistry 2021 |
Click here to see how this site uses Cookies. View our privacy policy here. 
 Open Access Article
 This Open Access Article is licensed under a Creative Commons Attribution-Non Commercial 3.0 Unported Licence
 *a,
Lu Chen*b and
Ping Ninga
*a,
Lu Chen*b and
Ping Ninga