 Open Access Article
Numerical study on the effect of discrete catalytic layer arrangement on methane steam reforming performance
Han Wang ,
Guogang Yang*,
Shian Li*,
Qiuwan Shen
 ,
Zheng Li and
Biaojie Chen
Marine Engineering College, Dalian Maritime University, China. E-mail: wang.han@dlmu.edu.cn; yanggg@dlmu.edu.cn; lishian@dlmu.edu.cn
First published on 13th January 2021
Abstract
The arrangement of catalytic layers inside the reactor is an important factor that affects the efficiency of methane steam reforming to produce hydrogen, and the traditional continuous catalytic layer structure is limited by the heat and mass transfer, resulting in unbalanced heat distribution inside the reactor and poor reaction performance. In order to improve the performance of methane reforming and balance the internal temperature of the reactor, different catalytic layers were designed based on 2D numerical simulation, and different numbers of discrete catalytic layers were modeled to compare the heat and mass transfer, methane conversion rate and hydrogen yield between the walls and inside the reactor. The results show that the increase in the number of catalyst gaps improves the temperature gradient inside the reactor, reduces the average cold point temperature difference inside the reactor by up to 7.2%, maintains a better thermal balance inside the reactor, improves the reaction rate inside the reactor, and the methane conversion rate and hydrogen yield after the reaction have been improved by 28.46% and 12.7% respectively.
Introduction
Fuel cells have the advantages of low heat loss and high power generation efficiency and play a key role in reducing environmental pollution.1 As the most important fuel for fuel cells, hydrogen is also one of the most promising clean energy sources today, and its demand will continue to rise. However, the production of hydrogen needs to be produced from other energy sources, so various methods of producing hydrogen have been produced. Natural gas (main component is methane) has the advantages of low carbon content and renewable nature, making it an ideal choice for industrial reforming to produce hydrogen fuel.2,3 Methane steam reforming (MSR), autothermal reforming (ATR) and partial oxidation (POX) are the main methods used to produce hydrogen from natural gas, MSR is the most mature technology.4–6 In order to expand the use of fuel cells and improve energy efficiency, on-site hydrogen production by MSR is also a cost-effective solution.Since MSR is a strong heat absorption reaction, the heat and mass transfer process of the reactor has an important impact on the overall reaction. Vigneault et al.7 designed a multi-channel membrane reactor model for small-scale production of hydrogen by MSR. Numerical methods were used to study the thermal coupling between combustion and reaction of methane in a reformer, and it was shown that the use of such thermal coupling devices can increase hydrogen production while reducing reactor size and energy consumption. Pattison et al.8 used numerical methods to investigate a method for simulating distributed coatings in a plate reactor, and their study shows that increasing the number of catalytic layer distribution segments allows for more precise temperature regulation. Karthik et al.9 used numerical simulation to study the pressure drop, heat transfer and reaction performance of the particle shapes. The results show that among the particle shapes considered, the trilobal particles have good effective heat transfer and efficiency coefficients, which are beneficial for improving the reforming reaction performance. Seung et al.10 used the simulation model to optimize the transient simulation of the hydrogen flow in the counter-current reactor based on the optimized geometry and the response surface method to reduce the hot spot problem in the reactor. In addition, the structure and layered configuration of the catalyst have a positive impact on the performance of the reactor. Recently, Mundhwa et al.11,12 numerically investigated the effect of coating reforming and combustion catalysts with different distribution structures in a plate reactor on the reaction performance, and the results showed that the distributed catalyst coating improved the catalyst utilization and hydrogen production. Settar et al.13 developed a single-channel two-dimensional model to numerically compare the MSR process under six catalytic layer structures. The results showed that the distributed catalytic layer structure could significantly improve the methane conversion and hydrogen production compared to the traditional continuous catalytic layer, but the effect of the number of catalytic layer gaps on the reforming reaction performance was not considered in the work.
In this study, two-dimensional numerical simulations are used to investigate the effect of coating discrete catalytic layer structures on the MSR reaction performance, focusing on a detailed examination and comparison of different numbers of catalytic layer intervals on the reactor walls. The results show that CH4 conversion and H2 yield can be effectively enhanced by improving the number of catalytic layer intervals.
MSR process and kinetic model
Physical model
The MSR reaction process consists of two mainly reversible reactions:14–16 methane steam reforming and water gas shift reaction, each of which is shown in eqn (1) and (2).Methane steam reforming (MSR):
 | (1) |
Water gas shift reaction (WGSR):
 | (2) |
In this paper, only reaction (1) is considered, ignoring the reaction (2) (WGSR). In the kinetic model of MSR, the reaction mechanism and the reaction rate expressions have been extensively studied. The reaction rate expression can be reduced to a power-law kinetic expression when the gas generated does not affect the reaction rate, as shown in eqn (3).17 Under this assumption, the reaction rate during the reforming process depends on the local pressure and temperature of the reactants in the reformer.
 | (3) |
| Pressure [MPa] | a | b | A [−] | E [J mol−1] |
|---|---|---|---|---|
| 0.1 | 0.47 | −0.01 | 0.392 | 4.32 × 10⁴ |
| 0.2 | 0.32 | 0.16 | 0.131 | 4.21 × 10⁴ |
| 0.3 | 0.37 | 0.15 | 0.148 | 4.82 × 10⁴ |
| 0.4 | 0.40 | 0.18 | 0.062 | 4.87 × 10⁴ |
Model development
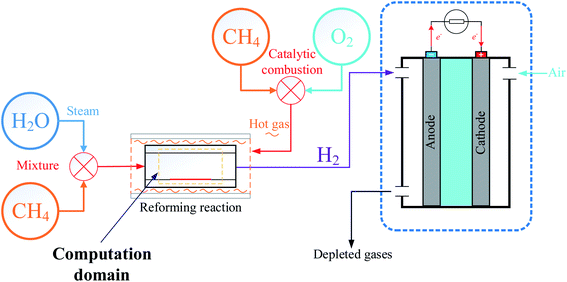
The process of producing hydrogen by MSR is used in a wide of applications, and in order to use fuel cells for marine applications, a model of an external reforming system to provide hydrogen fuel to proton exchange membrane fuel cells (PEMFCs) was designed as shown in Fig. 1. Prior to the reaction, steam is produced by heating water and then mixed with desulfurized natural gas. When the gas mixture enters the reactor, a reforming reaction occurs under the action of a catalyst to produce hydrogen-rich gas, where the heat required for the reforming reaction is provided by the exothermic reaction of catalytic combustion of methane with oxygen. Finally, the purified hydrogen is delivered to the PEMFCs to produce electricity.19To simplify the calculations, the reactor is based on the two-dimensional model proposed by Lin et al.,18 as shown in Fig. 2(a). The model consists of a parallel plate channel with a length of 20 mm and a height of 3.1 mm, assuming a constant wall temperature (520 °C) to provide the heat source. In the model, the Ni catalyst with Al2O3 (77 ± 4 vol% Ni) as the carrier was chosen to be coated on the lower wall of the reactor. The particle size of the catalyst is set to 20 nm by default, and the porosity and permeability are 0.4 and 2 × 10⁻⁸, respectively. Because the surface catalytic reaction is mainly considered in the research. Therefore, the relevant parameters of the catalyst structure remain consistent in each case. The gap between each catalyst layer structure is 1 mm, the catalyst density is constant, and the catalyst is equally distributed on the lower wall by varying the number of discrete catalyst layer intervals (0, 1, 3, 4), and the total amount of catalyst and the total length are kept consistent, as shown in Fig. 2(b), and the basic parameters of case 1–4 structures are given in Table 2.
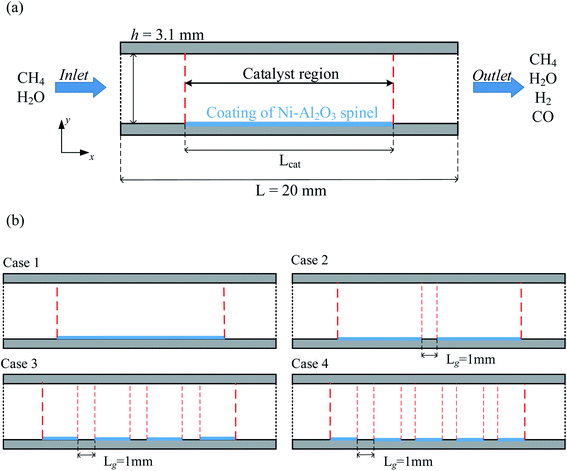 | ||
| Fig. 2 (a) Two-dimensional model diagram of the reactor (b) distribution diagram of the four catalytic layer structures. | ||
| Parameters | Case 1 | Case 2 | Case 3 | Case 4 |
|---|---|---|---|---|
| Number of catalytic layers | 1 | 2 | 3 | 4 |
| The length of a single catalytic layer [mm] | 10 | 5 | 2.5 | 2 |
| The total length of the catalytic layer [mm] | 10 | 10 | 10 | 10 |
| Number of catalytic intervals | 0 | 1 | 2 | 3 |
| The length of catalytic intervals [mm] | 0 | 1 | 1 | 1 |
| Catalyst density [kg m−3] | 2366 | 2366 | 2366 | 2366 |
| The distance between the front end of the catalytic layer and the entrance [mm] | 5 | 4.5 | 3.5 | 3 |
Mathematical model
The gas mixture flow field is controlled by Navier–Stokes equation, while energy and mass are controlled by energy equation and matter equation respectively.20 Considering the assumptions discussed above, the governing equations of the above physical model are as follows:(1) Continuity equation:
 | (4) |
(2) Momentum equation:
 | (5) |
 is the volumetric force.
(3) Energy equation:
 | (6) |
(4) Species equation:
 | (7) |
The ideal gas state equation:
| PMmix = ρmixRgT | (8) |
 | (9) |
In order to keep the mass flow constant, the inlet velocity is set to be uniform and decreases proportionally with increasing pressure. The inlet and wall temperatures are maintained at 520 °C. The initial conditions are the same as the inlet conditions. Based on the initial values, velocities u and v, pressure P, temperature T, and mass fraction of each component wi were calculated simultaneously using the control equation described above and the ideal gas state equation.
Since the Lewis number Lei is assumed to be a unit, the formula for calculating the diffusion coefficient Di in the formula is as follows:21
 | (10) |
The heat capacity of the gas mixture is calculated according to the mass fraction of each component, the formula is as follows:
 | (11) |
The viscosity of the gas mixture can be calculated by Wilke's method:22
 | (12) |
 | (13) |
The thermal conductivity of the gas mixture is based on the Mason–Saxena formula. According to the kinetic theory, the calculation formula is as follows:24
 | (14) |
In the formula, the function Aij is obtained by Mason–Saxena expression:
 | (15) |
The source term Qsr in the energy equation represents the reaction heat generated in the chemical reaction, and the calculation formula is:25
 | (16) |
The heat consumed by the MSR reaction can be calculated by the corresponding enthalpy change ΔH. Assuming a linear relationship between the heat of reaction (J mol−1) of the MSR reaction and the working temperature, it can be calculated as:26
| HMSR = −(206205.5 + 19.5175T) | (17) |
Boundary conditions
To complete the above mathematical model, boundary conditions must be specified. Using the condition of constant wall temperature, at the channel inlet, it is assumed that the velocity, temperature and reactant distribution are uniform,27 while sufficient upstream length is taken to ensure that the flow is fully developed before reaching the computational domain. In addition, to simplify the analysis, we make the following assumptions.28–30(1) Two-dimensional models of stable and compressible laminar flows for the reaction flow.
(2) The reactor walls are set so that there is no slippage on the walls.
(3) The substance in the gas mixture is an ideal gas whose thermophysical properties are assumed to vary with density, concentration of the substance and temperature.
(4) Ignoring wall thickness and catalyst thickness, i.e., assuming that the reaction occurs only at the surface of the catalytic layer.
(5) The catalyst layer is in local thermal equilibrium with the surrounding gas mixture.
Therefore, the relevant boundary conditions to complement the model are shown in Table 3.
Results and discussion
The accuracy and validity of the above mathematical model was verified by simulating the experimental results of Lin et al.18 The temperature distribution along the lower wall surface of the reactor and the CH4 conversion at different pressures are depicted in Fig. 3. In the comparison, the lower wall surfaces are adiabatic conditions except for the catalytic layer surface. On the wall temperature distribution, the numerical simulation results matched the experimental data well, with a maximum error of less than 4.7%, as shown in Fig. 3(a). The pre-exponential factor A was adjusted according to different pressure conditions, and the experimental and numerical simulations were performed again with the new values, and the results are shown in Fig. 3(b), and the numerical simulation results are in good agreement with the simulated and experimental results of Lin et al.,18 the average error is about 1.8% and the maximum is 3.2%. In this work, the average temperature inside the wall temperature reactor is studied to compare the heat distribution of the reactor under various models, and the mass fraction curves of CH4 and H2 are analyzed to evaluate the performance of the reforming reaction by comparing the CH4 conversion rate, H2 yield, and reaction rate magnitudes.
 | (18) |
 | (19) |
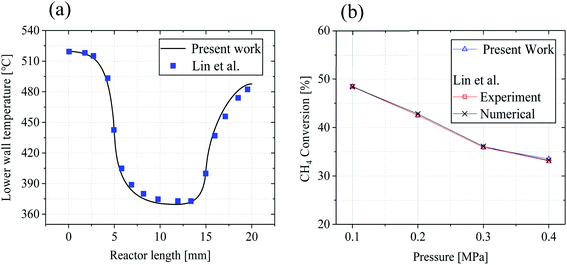 | ||
| Fig. 3 Comparison of numerical simulations with experimental results of Lin et al.:18 (a) lower wall temperature (b) CH4 conversion rate. | ||
Grid independence validation
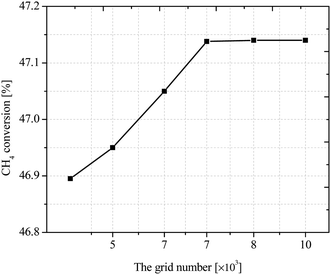
All the coupled control equations with boundary conditions are solved by COMSOL using three physical modules: laminar flow, fluid heat transfer and dense matter transfer, with residuals set below 10−5. In order to obtain the best number of grids, the methane conversion rate is studied under different number of grids. To ensure the correctness of the grid division, the model was verified for grid-independence, and the methane conversion rate was calculated under the grid numbers of 5432, 6571, 7472, 8403, and 9531, respectively, as shown in Fig. 4. It can be seen that the CH4 conversion rate tends to be stable when the grid number is greater than 7472, so the current grid number can be considered to meet the grid-independence requirement.Heat and mass transfer characteristics on the lower wall
In order to investigate the effect of catalytic layer distribution on the reaction process, the lower wall temperatures and the CH4 and H2 mass fraction curves for the four cases were investigated, as shown in Fig. 5. It can be seen that the wall surface temperature of each reactor model is the same and the inlet temperature of the gas mixture entering the reactor remains the same. Therefore, all the heat and mass transfer phenomena occurring in the reactors are due to the change of the catalytic layer structure, and Fig. 5 shows the wall heat and mass transfer curves for cases 1–4, respectively. Since the wall temperature is constant 520 °C, but with the increase of the number of catalytic layer intervals, the minimum temperature value in each catalytic layer increases and the internal heat recovery capacity of the reactor is enhanced, and when the number of catalytic layer intervals is 4 (case 4), the minimum temperature inside the reactor rises to 429.5 °C, which is 27.15 °C and 8.05 °C higher than case 2 and case 3, respectively. The lowest temperature at the wall of the discrete catalytic layer structure (cases 2–4) all appeared on the last catalytic layer, which may be due to the incomplete heat recovery in the second half of the reaction as the catalytic layer intervals was not optimal.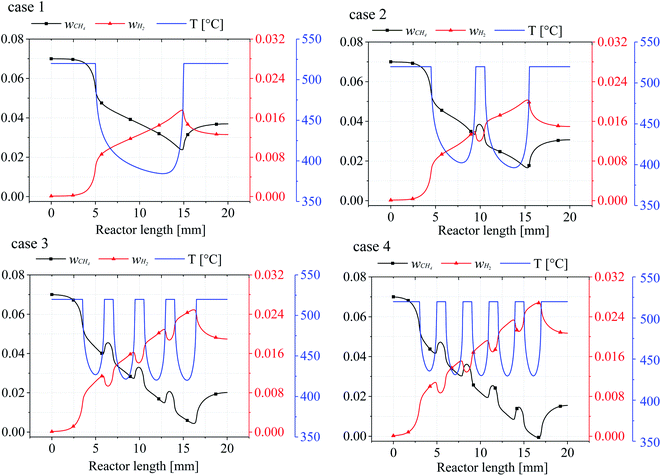 | ||
| Fig. 5 The relationship between the bottom wall temperature of the reactor and the mass fraction of CH4/H2. | ||
From the mass fractions of CH4 and H2 at the wall, due to the consumption of CH4 and generation of H2 accompanying the reaction, the CH4 mass fraction (wCH4) decreases for the mass fraction until the catalytic layer ends reach a minimum value, then the CH4 mass fraction rises somewhat, and when the number of catalytic layer intervals increases, the CH4 conversion at the catalytic layer surface also increases substantially, even reaching complete conversion (case 4), the CH4 conversion rate increased by 33.57% compared to the conventional catalytic layer structure (case 1), and by 23.69% and 6.26% compared to cases 2 and 3, respectively. The mass fraction of H2 (wH2) is exactly opposite to that of CH4, and the two mass fraction curves are approximately symmetrical, because after the reaction on the catalytic layer surface, the remaining CH4 in the reactor is diffused until the reactor wall, while most of the H2 in the reactor is on the surface, and when H2 is generated on the catalytic layer surface, it diffuses to all parts of the reactor, resulting in a decrease in the H2 content on the wall surface. Therefore, it can be concluded that the temperature and mass fraction variation in the lower wall of the reactor is the source of the effect on the mass composition and heat distribution in the gas mixture. Furthermore, the mass fractions of CH4 and H2 are closely related to the wall temperature, and every steep temperature gradient in the reaction is accompanied by a rapid consumption and production of CH4 and H2.
Temperature distribution
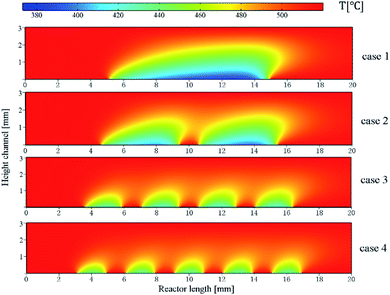
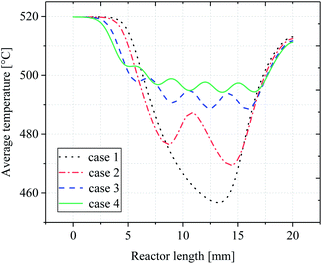
In order to determine the optimal distribution of catalytic layer structures in the reactor, the average temperature variation along the length of the reactor was investigated for case 1–4 structures, and the temperature distribution is shown in Fig. 6. For the reactor case with a continuous catalytic layer (case 1), the temperature is almost equal to the wall temperature when the gas mixture is not in contact with the catalytic layer. However, when the gas mixture enters the catalytic layer region, a tendency to lower the temperature can be observed. The reaction absorbs heat as the reaction flow occurs in contact with the catalyst front end until the end of the continuous catalytic surface, i.e., the end of the catalytic region, where the temperature continues to decrease. And from Fig. 6, case 2–4, it can be seen that as the number of catalytic layers continues to increase, the cold point temperature of each catalytic layer also increases, and the longitudinal thermal gradient gradually decreases. The average temperature profile on the y-axis along the reactor length is plotted in Fig. 7. From the curve trend, it can be seen that it is roughly the same as the temperature distribution graph (Fig. 6), but from the curves of cases 2–4, it can be more intuitively seen that the average temperature in the reaction zone is gradually increasing as the number of catalytic layer intervals increases. This is due to the change of the catalytic layer structure, which increases the gap between the catalytic layers through the discrete distribution of catalytic layers, so that the gas mixture can be well reheated at the catalytic layer gap when the heat absorption reaction occurs in the catalytic layer, thus maintaining the thermal equilibrium inside the reactor. Therefore, increasing the number of catalytic layer intervals, while keeping the total amount of catalysts unchanged, can result in better heat distribution in the reactor, thus improving the reaction conditions and the reforming performance.Mass fraction distribution
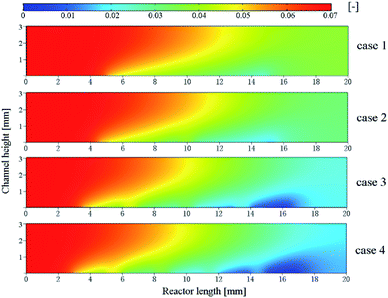
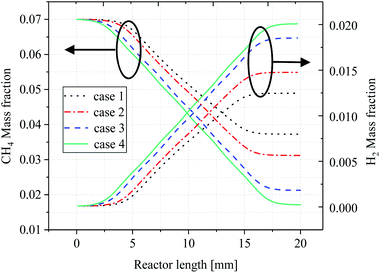
In order to investigate the effect of the number of catalytic layer intervals on the efficiency of CH4 conversion, the mass fraction distribution of CH4 under four cases was discussed as shown in Fig. 8. It is obvious that the consumption of CH4 is closely related to the temperature inside the reactor. At the reactor end, the reaction stream hardly reacts when it is not in contact with the catalytic layer, and the reforming reaction occurs when it is in contact with the catalytic layer, and in the first half of the pre-reactor, the methane consumption already accounts for more than 50% of its total consumption, indicating that the fuel consumption is relatively rapid at the beginning of the reaction. While the four cases do not have the same methane mass fraction at the reactor outlet, the optimization of the catalytic layer in case 2 to 4 not only optimizes the heat supply in the reactor, but also increases the consumption of CH4 in the whole reaction and also increases the H2 production, thus improving the reaction performance.The average mass fraction curves for CH4 and H2 in each case are depicted in Fig. 9, respectively. Overall, it appears that the average CH4 mass fraction decreases throughout the reaction while the H2 mass fraction increases, and it is clear that temperature has an important influence on the CH4 and H2 mass fractions in the four cases. It can be seen from the curves from cases 2–4 that as the catalytic layer becomes more discrete, the CH4 consumption becomes faster and the CH4 mass fraction at the exit becomes smaller, which is because the temperature difference inside the reactor decreases due to the change in the number of gaps distances, thus maintaining a better thermal balance inside the reactor, and the increase in the average temperature inside the reactor can provide more sufficient heat for the reforming reaction, which makes the average temperature inside the reactor lower. At the highest level (case 4), the lowest mass fraction of methane at the outlet, i.e., the highest conversion rate, is accompanied by a larger mass fraction of H2 at the outlet, as shown in Fig. 9. This means that the methane reforming reaction performance is significantly improved when the number of discrete catalytic layer spacings is increased. The consumption and production of CH4 and H2 increased in cases 2 and 3 compared to case 1, while the most obvious effect was observed in case 4, where the CH4 and H2 mass fractions at the reactor outlet decreased/increased to 0.017 and 0.020, respectively.
CH4 conversion rate and H2 yield
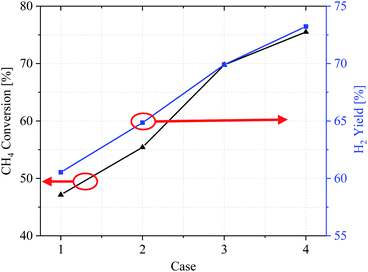
Evaluation of overall reaction performance by comparing methane conversion and hydrogen yields. Fig. 10 shows the conversion efficiency of the CH4 conversion and H2 yield by comparing the various catalytic layer distribution methods in cases 1–4. From the CH4 conversion rate, it can be concluded that the methane reforming performance in case 1 is the worst, with a CH4 conversion ratio of only 47.14% and high fuel loss under the same conditions. In contrast, in cases 2–4, the CH4 conversion was also significantly improved by optimizing the catalytic layer structure, and case 4 achieves the best overall performance. According to the CH4 and H2 import mass fractions, the three improved cases improved the CH4 conversion by 8.27%, 22.63%, and 28.36%, respectively, compared with case 1. The H2 yield also improved by 4.32%, 9.37%, and 12.7%, respectively.Effect of the reaction rate
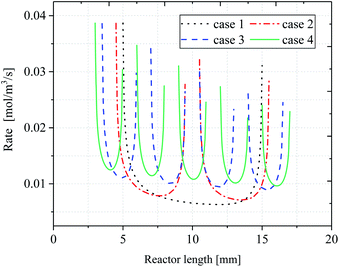
Fig. 11 shows the variation of local reaction rate R with reactor length. In terms of the overall trend, the reaction rate of the inert wall is not shown in the figure as the reaction is based on a surface case. Instead, the trend of reaction rate changes as the reaction flow moves to the catalytic layer. Since the reaction rate is affected by the temperature distribution and the partial pressure of H2O and CH4, there is a decreasing trend of rate along the reactor direction. This is because when the reaction occurs, the consumption of the reactants is present, and the partial pressure of the reactants decreases causing the reaction rate to decrease. It is particularly strongly influenced by the wall temperature, which is lowest when the reactor is in the center of the catalytic layer, resulting in a reaction rate that is minimal at the center of each catalytic layer and minimum at the center of the last catalytic layer. For case 1, the peak occurs at the front end of the catalytic layer, while the peak at the end is significantly lower. In addition, the reaction rate of the discrete catalytic layers in cases 2–4 is improved due to the heat supply at the catalytic layer intervals. For case 1, the reaction rate at the front end of the catalytic layer decreases sharply, while the reaction rate at the end of the catalytic layer increases. The minimum reaction rate in the catalytic region, at X = 12.57 mm, R = 0.01106 mol m−3 s−1. The minimum reaction rates in cases 2–4 were located at X = 13.83 mm, 15.40 mm, and 16.10 mm, with reaction rates of 0.01275, 0.01661, and 0.01839 mol m−3 s−1, respectively. For cases 2–4, the reaction rate curve has approximately the same shape and decreases with the X-direction, but the increase in the reaction rate prolongs the reaction process and thus increases the CH4 conversion. This is due to the intervals structure between each catalytic layer, which results in heat being able to be supplied discrete in the reactor, thus maintaining the thermal equilibrium within the reactor. In fact, compared to case 1, the temperature in each catalytic layer decreases somewhat as the catalytic layer intervals increases, but the decreasing amplitude reduces gradually with the increase of the catalytic layer spacing, resulting in an increase in the overall temperature within the reactor.Conclusion
A two-dimensional model of a methane reforming reactor was developed and four reactors with different number of discrete catalytic layer intervals were studied to investigate the influence of the number of layer intervals on the reaction performance. The results show that, compared with the conventional structure with continuous layers (case 1), the average cold point temperature difference inside the reactor is 7.2% lower as the number of spacings increases due to the discrete supply of heat energy caused by the spacing between the catalytic layers, which ensures a better thermal balance inside the reactor, thus avoiding the failure to reach the required reaction temperature during the reaction. In this study, a 75.5% CH4 conversion rate and a 12.7% increase in H2 yield were achieved with the maximum number of catalytic layer intervals. Finally, in this work, the size and number of catalytic layer intervals were not optimal due to reactor structure and length limitations, and the effect of the catalytic layer front and end distances from the reactor inlet and outlet on the reaction was not considered. Therefore, the arrangement of discrete catalytic layer structure could be further optimized.Author contributions
Han Wang: conceptualization, methodology, formal analysis, data curation, validation, software, writing-original draft preparation. Guogang Yang: resources, visualization, project administration, funding acquisition and investigation. Qiuwan Shen and Shian Li: resources, supervision, writing – review & editing. Zheng Li: software and validation. Biaojie Chen: visualization.Nomenclature
| A | Pre-exponential factor, [−] |
| Aij | Function used in eqn (15) |
| a, b | Exponential indexes, [−] |
| Cp | Specific heat of a gas mixture, [J (kg K)−1] |
| D | Mass diffusion of a gas mixture, [m s−2] |
| dh | Catalytic thickness, [mm] |
| E | Activation energy, [J mol−1] |
| HMSR | Reaction enthalpy of reforming reaction, [J mol−1] |
| h | Heat transfer coefficient, [W (m2 K)−1]; model height, [mm] |
| k | Thermal conductivity, [W (m s)−1] |
| L | Total length of catalytic layer [mm] |
| Lcat | Length of a single catalytic layer [mm] |
| Lg | Length of catalytic interval [mm] |
| Lei | Lewis number, [−] |
| M | Molar mass, [g mol−1] |
| n | Number of reactants [−] |
| P | Pressure, [Pa] |
| Pi | Partial pressure of species i, [Pa] |
| R | Reaction rate, [mol (m3 s)−1] |
| Qsr | Source term in energy equation, [W m−3] |
| T | Temperature, [K, or °C] |
| u | Axial velocity, [m s−1] |
| v | Transverse velocity, [m s−1] |
| w | Mass fraction, [−] |
| X | Reactor length [mm] |
| x | Transverse coordinate, [mm] |
| y | Axial coordinate, [mm]; molar fraction, [−] |
Greek symbols
| μ | Dynamic viscosity, [μPa s−1] |
| ρ | Fluid density, [kg m−3] |
| ν′ | Stoichiometric coefficient of reactant species, [−] |
| ν′′ | Stoichiometric coefficient of product species, [−] |
Subscripts
| cat | Catalyst |
| g | Gap |
| i, j | Reactant and product components |
| mix | Mixture |
| MSR | Reforming reaction |
| avg | Average |
Conflicts of interest
There are no conflicts to declare.Acknowledgements
This work was supported by the National Natural Science Foundation of China (No. 51779025 and No. 52001045), the Fundamental Research Funds for the Central Universities of China (No. 3132019327), China Postdoctoral Science Foundation (No. 2019M651097 and No. 2019M651094) and Natural Science Foundation of Liaoning Province (No. 2019-BS-026, No. 2019-ZD-0154 and No. 2020-HYLH-38).References
- D. K. Niakolas, M. Daletou and S. G. Neophytides, Ambio, 2016, 451, 32–37 CrossRef.
- G. Kolb, Fuel processing: for fuel cells, Wiley-VCH, 2008 Search PubMed.
- D. Liu, Y. Sun and Y. Li, Sci. Rep., 2017, 7, 9587 CrossRef.
- Y. Yan, Z. Zhang and L. Zhang, Int. J. Hydrogen Energy, 2015, 40, 1886–1893 CrossRef CAS.
- J. Xuan, M. K. H. Leung and D. Y. C. Leung, Int. J. Hydrogen Energy, 2009, 34, 9076–9086 CrossRef CAS.
- X. Zhai, Y. Cheng and Z. Zhang, Int. J. Hydrogen Energy, 2011, 36, 7105–7113 CrossRef CAS.
- A. Vigneault and J. R. Grace, Int. J. Hydrogen Energy, 2015, 40, 233–243 CrossRef CAS.
- R. C. Pattison, F. E. Estep and M. Baldea, Ind. Eng. Chem. Res., 2014, 53, 5028–5037 CrossRef CAS.
- G. M. Karthik and V. V. Buwa, AIChE J., 2017, 63, 366–377 CrossRef CAS.
- S. W. Jeon and W. J. Yoon, Int. J. Hydrogen Energy, 2014, 39, 6470–6478 CrossRef CAS.
- M. Mundhwa and C. P. Thurgood, Fuel Process. Technol., 2017, 158, 57–72 CrossRef CAS.
- M. Mundhwa and C. P. Thurgood, React. Chem. Eng., 2018, 10, 1039 Search PubMed.
- A. Settar, N. Lebaal and S. Abboudi, Energy Convers. Manage., 2018, 176, 357–371 CrossRef CAS.
- J. Xu and G. F. Froment, Aiche J., 1989, 35, 97–103 CrossRef CAS.
- M. Mozdzierz, M. Chalusiak and S. Kimijima, Heat Mass Transfer, 2018, 54, 2331–2341 CrossRef CAS.
- M. Irani, A. Alizadehdakhel and A. N. Pour, Int. J. Hydrogen Energy, 2014, 39, 12230 CrossRef CAS.
- G. Brus, Int. J. Hydrogen Energy, 2012, 37, 17225–17234 CrossRef CAS.
- K. Lin, M. Saito and Y. Niina, J. Therm. Sci. Technol., 2012, 7, 633–648 CrossRef CAS.
- A. Irankhah, M. Rahimi and M. Rezaei, Chem. Eng. Technol., 2014, 37, 1220–1226 CrossRef CAS.
- E. A. S. Mason, Vacuum, 1965, 15, 330 Search PubMed.
- T. J. Chung, General continuum mechanics, Cambridge University Press, 2007 Search PubMed.
- W. E. Francis, Trans. Faraday Soc., 1958, 54, 1492–1497 RSC.
- R. C. Reid, J. M. Prausnitz and B. E. Poling, The properties of gases & liquids, 4th edn, New York, 1987, York: McGraw-Hill Book Company, 1987 Search PubMed.
- J. L. Monteith and M. H. Unsworth, Properties of Gases and Liquids, Principles of Environmental Physics, Fourth Edition, 2013 Search PubMed.
- M. Ni, Fuel Abstr. Curr. Titles, 2012, 37, 1731–1745 CAS.
- M. Ni, Energy Convers. Manage., 2013, 65, 155–163 CrossRef CAS.
- A. Settar, Z. Mansouri and R. Nebbali, Int. J. Hydrogen Energy, 2019, 44, 11346–11354 CrossRef CAS.
- M. S. Herdem and M. Mundhwa, Energy Convers. Manage., 2019, 180, 149–161 CrossRef CAS.
- J. Chen, L. Yan and W. Song, Int. J. Hydrogen Energy, 2017, 42, 664–680 CrossRef CAS.
- S. I. Ngo, Y. I. Lim and W. Kim, Appl. Energy, 2019, 236, 340–353 CrossRef CAS.
| This journal is © The Royal Society of Chemistry 2021 |

![[thin space (1/6-em)]](https://www.rsc.org/images/entities/char_2009.gif)


