 Open Access Article
Liquid fuel from waste tires: novel refining, advanced characterization and utilization in engines with ethyl levulinate as an additive†
Akhil Mohan a,
Saikat Dutta
 b,
Saravanan Balusamy
 c and
Vasudeva Madav
 *a
*a
aDepartment of Mechanical Engineering, National Institute of Technology Karnataka, Surathkal, Mangalore-575025, India. E-mail: akhil.177me001@nitk.edu.in; vasu@nitk.edu.in
bDepartment of Chemistry, National Institute of Technology Karnataka, Surathkal, Mangalore-575025, India. E-mail: sdutta@nitk.edu.in
cDepartment of Mechanical and Aerospace Engineering, Indian Institute of Technology Hyderabad, Hyderabad, 502285, India. E-mail: saravananb@mae.iith.ac.in
First published on 8th March 2021
Abstract
Pyrolysis is a promising thermochemical strategy to convert scrap tires into diesel-like fuels. Crude tire pyrolysis oil (CTPO) was produced in a 10 ton rotating autoclave reactor by thermal depolymerization of the tire polymers. In this work, the prior-reported straightforward and inexpensive strategy of upgrading CTPO using a combination of silica gel (as adsorbent) and petroleum ether (as the solvent) has been scaled up with minimal loss in mass of oil and improved physicochemical characteristics (e.g., lowered acid value, low sulfur content). The upgraded TPO (StTPO) was characterized extensively to better understand their chemical compositions, physicochemical properties, and combustion characteristics. StTPO was mixed with diesel in different volumetric proportions and the blends were studied for performance and emission characteristics in a single-cylinder engine. The use of biomass-derived ethyl levulinate (EL) as a fuel oxygenate improved the cold-flow properties of StTPO–diesel blends as well as lowered the exhaust emissions (e.g., lower NOx). A fuel blend consisting of 50% diesel, 40% StTPO, and 10% EL demonstrated the best fuel properties in the single-cylinder diesel engine.
1Introduction
The post-consumer polymers (natural and synthetic) such as waste automobile tires have created serious waste management issues. Therefore, there has been significant interest over the past decade in the depolymerization of post-consumer, hydrocarbon-based polymers into transportation fuels. In this regard, the natural and synthetic polymers (e.g., polyisoprene, polybutadiene) in scrap tires can be converted into diesel-range fuels under pyrolytic conditions. According to the European Tire Rubber Manufacturers Association (ETRMA), 289 million tires were sold annually and 1.5 billion tires worldwide.1,3 India stands in the fourth position with an annual production of 175.4 million tires from 164 operational plants. Trucks and buses significantly contribute to the Indian tire industry compared to other automobiles.2 The stockpiles of scrap tires create serious environmental and health hazards and are primarily disposed of in landfills. Tires consist of natural rubber, synthetic polymers, carbon black, stearic acid, additives, accelerators, steel wires, textile chord, and aromatic oil.3–5 The major component in scrap tires is a mixture of natural rubber and synthetic polymers. The cross-linked thermoset resulting from the vulcanization process of the thermoplastics resists biological or thermal deconstruction of scrap tires. Combustion of scrap tires in an open atmosphere releases dioxin, furans, polyaromatic hydrocarbons (PAHs), oxides of nitrogen, and volatile particulate matter into the environment.3,6 The scrap tires have found niche uses in manufacturing asphalt, boat and dock fenders, road pavement, roofing applications, noise control systems, artificial reef, protection to young plants, and coastal defenses.7–10 Multiple strategies including pyrolysis, gasification, de-vulcanization, hydrogenation, chemical degradation, and catalytic cracking have been adopted for the deconstruction of scrap tires. Pyrolysis is an attractive thermochemical pathway to deconstruct the polymers in scrap tires into liquid hydrocarbons. The thermal de-polymerization of styrene–butadiene rubber in the absence of oxygen at a temperature of 400–600 °C forms a brown, syrupy liquid called crude tire pyrolysis oil (CTPO) along with non-condensable gases, steel wires, and carbon black. CTPO consists of various classes of compounds such as aliphatic, aromatics (monocyclic and polycyclic), heterocycles, and other polar organic compounds. Various types of reactors and reaction conditions were reported for the pyrolysis of scrap tires.11–13 The major impediment in the direct application of CTPO for use in furnaces and engines is its inferior fuel properties (e.g., high acid value and sulfur content) and suitable upgrading is often mandated. In an earlier report, the authors had reported the production of CTPO by thermal pyrolysis of automobile tires in a rotating autoclave and a novel, inexpensive method of upgrading the same by selective adsorption over silica gel under magnetic stirring (StTPO). In the present work, the preparation of StTPO from CTPO is streamlined and scaled up, leading to improved yield and better physicochemical properties of the former compared to the laboratory-scale process. Extensive characterization of CTPO and StTPO provided detailed insights about the chemical composition and combustion properties of the fuels. Besides, the combustion properties and emission characteristics of StTPO–diesel blends (StTPOxx) with ethyl levulinate (EL) as a renewable fuel additive have been tested on a single-cylinder diesel engine for the first time.2. Materials and methods
2.1 Materials
Diesel was procured from an outlet of Indian Oil Corporation Limited (IOCL). Silica gel (60–120 mesh) and petroleum ether (60–80 °C) were purchased from Loba Chemie Private Limited. Ethyl levulinate (98%) was purchased from Sigma Aldrich.2.2 Thermal depolymerization of scrap tire
CTPO was prepared in a rotating autoclave pilot-scale facility at Mandakan Energy Products, Palakkad, India. Around 3.5 ton of CTPO was produced along with 1.2 tons of steel wire, and 2.1 tons of carbon black starting from 8 ton of scrap automobile tires. The reaction conditions are detailed in the earlier report.15 Around 25 L of freshly-prepared CTPO was collected in a plastic storage tank for characterizations and engine studies.2.3 Batch-scale upgrading experiments
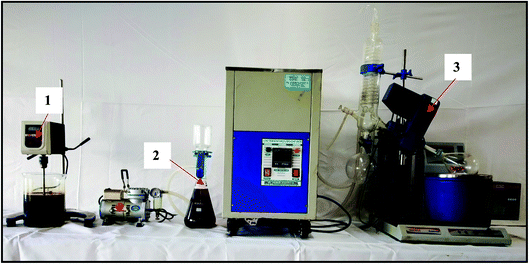
CTPO (1 L) was diluted with petroleum ether (3 L) in a 6 L beaker. To the solution, silica gel (1 kg) was added carefully and the suspension was stirred at 500 rpm by an overhead stirrer for 1 h at RT. After 1 h, the suspension was allowed to settle down and the supernatant was filtered through a microfiltration system (pore size 0.2 μm, thickness 140–178 μm, nylon 6,6) under vacuum. Petroleum ether was evaporated using a rotary evaporator at 45 °C under reduced pressure. The used silica gel was washed with methanol to remove the polar deposits and the methanol was recycled by distillation under reduced pressure. Fig. 1 shows the batch scale upgradation strategy for refining CTPO (Table 1).| Component | Specifications |
|---|---|
| Filtration flask | Outer diameter = 135 mm, height = 230 mm |
| Filter disc | Pore size = 0.2 μm, material – nylon 6,6, media – RU/RU – 12.75, thickness = 140–178 μm |
| Laboratory stirrer | REMI RQ-121 (500 rpm) |
| Vacuum pump | TARSONS ROCKYVAC (200 mm Hg) |
| Rotary evaporator | 45 °C |
| Low temperature cryostat bath | 12 L, 20 × 12 × 45 (L × B × H), 5 °C |
| Feed volume | 1 L |
| Loss | 5 vol% |
2.4 Fuel property analysis and various characterization techniques
The fuel property of crude and upgraded oils were tested by standard methods, including density by ASTM D4052, flash point by Pensky Marten closed cup tester (ASTM D93), pour point (PP) by ASTM D97, surface tension by drop shape analyzer (pendant drop method), kinematic viscosity at 40 °C by ASTM D445, cetane index by ASTM D976-91, distillation point by ASTM D86-19, spot test by ASTM D4740-02 and calorific value by semi-automatic bomb calorimeter (ASTM 4809-18). GC-HRMS analysis was performed to determine the compounds in crude and upgraded oil samples by Accu-TOF GCV 7890, Joel, GC-MS spectrometer (DB-petro column, crosslinked 5% methyl phenyl silicone, 50 m length and 0.25 mm internal diameter, 0.5 μm film thickness). Helium gas with a purity of 99.99% was used as carrier gas at a constant rate of 1 mL min−1. G.C.'s oven temperature was programmed from 50 °C to 270 °C at a ramping rate of 10 °C min−1 and held for 2 min. The total run time was 45 min. The mass spectra of compounds were identified from respective G.C. chromatograms using the National Institute of Standards and Technology library.Qualitative estimation of various chemical compounds in CTPO, StTPO, and StTPO-EL are determined using comprehensive two-dimensional gas chromatography (GC) equipped with the time-of-flight mass spectrometer (TOF-MS) (Pegasus GC × GC TOF-MS, LECO Corporation, St-Joseph, MI, USA). The system houses an Agilent 6890 gas chromatograph, a LECO GC × GC module, and a TOF-MS. The central principle behind the separation of compounds in two columns (non-polar and polar) is based on primary attributes like molecular weight and compounds polarity. The non-polar column with (Rtx-5ms, 5% diphenyl, 95% diphenyl polysiloxane, low bleed, Restek, USA) is having dimensions 30 m (L) × 0.25 mm (I. D.) and 0.25 μm film thickness, and the polar column with measurements of 1 m (L) × 0.1 mm (I. D.) and 0.10 μm thickness with the stationary phase of 50% diphenyl, 50% dimethyl polysiloxane (Rxi-17, Restek, USA) was used. The secondary column is equipped with its oven inside the main GC-oven. The inlet temperature was set at 270 °C. Helium was used as a carrier gas at a constant flow rate of 1.3 mL min−1. We have devised a temperature program for analyzing polymer samples obtained from scrap tires and plastic samples: hold at 70 °C for 0.40 min, the ramp from 70 °C to 250 °C at 5 °C min−1. The secondary column was offset at 10 °C from the primary column. The sample was injected at a split ratio of 1![[thin space (1/6-em)]](https://www.rsc.org/images/entities/char_2009.gif) :
:![[thin space (1/6-em)]](https://www.rsc.org/images/entities/char_2009.gif) 100. Data processing was done using LECO Chroma Software. The compounds are identified based on extracted ion-chromatogram and matching with retention time peak to that compound defining the standard and comparing the mass spectra of the peak with the National Institute of Standards and Technology library (NIST). 2 mg of samples were loaded in alumina crucible in the DSC analyzer (model: DSCQ200) to quantify the samples heat release rate. The loaded samples were heated from 30–500 °C at a heating rate of 10 °C min−1 in liquid nitrogen (30 mL min−1).
100. Data processing was done using LECO Chroma Software. The compounds are identified based on extracted ion-chromatogram and matching with retention time peak to that compound defining the standard and comparing the mass spectra of the peak with the National Institute of Standards and Technology library (NIST). 2 mg of samples were loaded in alumina crucible in the DSC analyzer (model: DSCQ200) to quantify the samples heat release rate. The loaded samples were heated from 30–500 °C at a heating rate of 10 °C min−1 in liquid nitrogen (30 mL min−1).
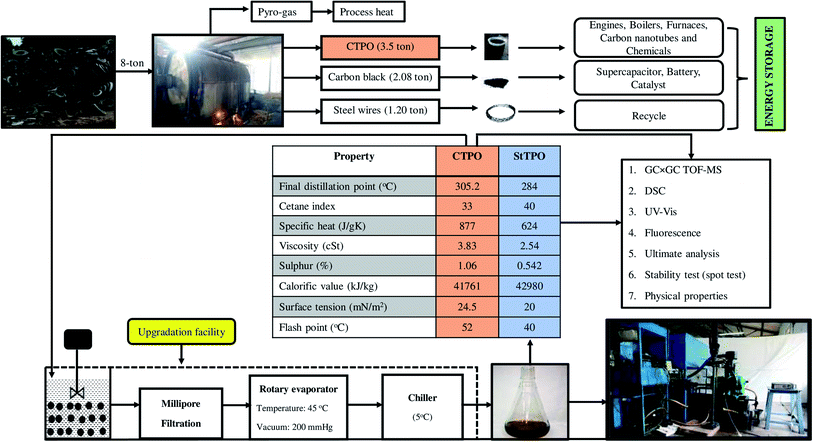
Samples were diluted in n-hexane of 99.99% purity (4 ppm). The fluorescence of samples was analyzed by spectrofluorometer (model: fluoromax-4, Horiba Scientific Instruments). The excitation wavelength for each sample was determined from a UV-visible spectrometer (UV-NIR3000). A 150 W xenon lamp illuminated the diluted samples with continuous output. The monochromatic excitation source has an optical range of 200–600 nm blazed at 330 nm. The emission monochromatic source has an optical spectrum of 290–850 nm, blazed at 500 nm. The slit width is adjusted through 0–30 mm bandpass filters. To conduct stability analysis, a spot of fuel is put on a test paper and heat to 100 °C for 1 h. Then, the test paper is removed from the oven, and the resultant spot was examined and rated for stability against the “5 level rating scale”. Further, phase stability analysis was conducted to elucidate any creaming or phase separation by visual inspection. In order to confirm the stability of liquid samples, viscosity measurements was conducted before and after 6 months. Fig. 2 describes the detailed methodology of present study.
2.5 Engine testing set-up and instrumentation
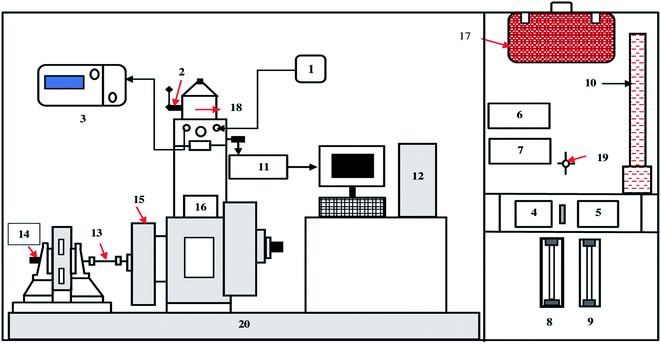
The fuel components were blended in a 6 L beaker using an overhead stirrer operating at 500 rpm, before testing the blended fuels in a single-cylinder diesel engine (make: Kirloskar, model: TV1) the homogeneity and stability of the samples. The engine set-up houses a naturally aspirated, direct-injection water-cooled diesel engine system with a rated power of 3.5 kW at 1500 rpm, coupled with an eddy current dynamometer for loading. The detailed specifications of the single-cylinder diesel engine and the schematic are presented in Table S2† and Fig. 3. The primary application of a single-cylinder diesel engine in India is for irrigation and electricity generation as a prime mover. This type of engine has also been extensively used to carry out research work in most academic institutions on alternative fuels. The fuel consumption was measured by using a burette and stopwatch arrangement. A Kistler's pressure sensor was mounted on the top of the cylinder to retrieve combustion data through the data acquisition system. The lubrication oil and exhaust gas temperature were recorded using a K-type (Cr–Al) thermocouple with a temperature indicator. The tailpipe emission from all fuel samples were measured using a sample probe connected with five gas portable emission analyzer (model: AVL Digas 444). The retrieved combustion data was fed into combustion analysis software (Engine soft, Version 9.0) using a data acquisition system. The combustion characteristics like in-cylinder pressure, net heat release, and rate of pressure data were obtained and presented in the following sections. For each experiment, the engine is allowed to run for 30 minutes to reach steady-state conditions. To check repeatability, each test was repeated thrice, and the average data is reported in the present study. The uncertainty analysis was carried out to study the accuracy of measuring instruments used during experiments. The uncertainty analysis was carried out using the square root method and presented in ESI.† The exhaust gas analyzer specification used in the present research study is shown in ESI (Table S1†). The photographs of the engine set-up are displayed in ESI (Fig. S1†).3. Results and discussions
3.1 Batch scale upgradation process
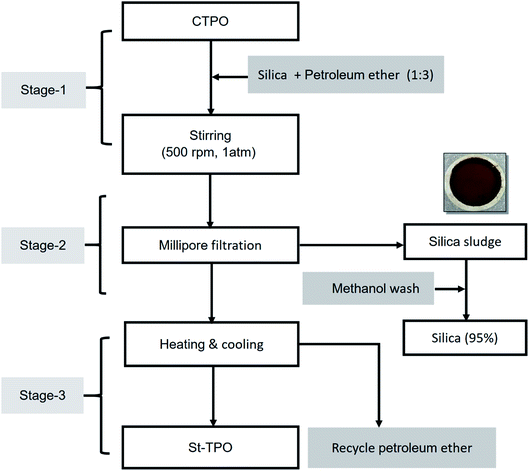
We had reported the laboratory-scale upgrading of CTPO by stirring a diluted solution of CTPO in petroleum ether with silica gel on a magnetic stirrer (magnetic-stirring method).15,16 When scaling up the laboratory-scale batch process, additional features were incorporated, such as a micro-filtration apparatus, an overhead stirrer, and chiller. The recovery of upgraded oil (i.e., StTPO) was noticeably higher (ca. 10%) in the overhead-stirring process, compared to the magnetic-stirring process. The refined oil was a reddish-brown colored transparent liquid. Fig. 4 shows the process flow diagram of the overhead-stirring upgradation strategy. Table 2 describes the comparative study between the magnetic-stirring and overhead-stirring upgradation processes.| S. no. | Parameters | Magnetic-stirring process | Overhead-stirring process |
|---|---|---|---|
| 1 | Mixing equipment | Magnetic stirrer | Laboratory stirrer |
| 2 | The rotational speed of the stirrer | Fixed | Adjustable |
| 3 | Evaporation of solvent | Non-uniform cooling | Uniform cooling |
| 4 | Oil loss | 15% | 5% |
| 5 | Color | Reddish-brown | Reddish-brown |
| 6 | Odor | Improved | Improved significantly |
| 7 | Sulfur content (%) | 0.70 | 0.54 |
| 8 | References | 15 and 16 | Present study |
3.2 Effect of batch scale upgradation on oil quality and yield
The overhead-stirring strategy allowed improved mixing of silica gel with CTPO and also used a chiller to effectively cool the condenser during solvent recovery. The StTPO samples obtained from both the magnetic-stirring and overhead-stirring processes were reddish-brown colored oily liquid and miscible with diesel at all proportions. The fuel properties and chemical composition of the magnetic-stirring and overhead-stirring strategy appeared to be similar. However, there was a significant improvement in the odor and yield of StTPO in the overhead-stirring strategy compared to the magnetic-stirring strategy. Upgradation of CTPO by silica gel as adsorbent and petroleum ether as solvent yielded diesel-range fractions with carbon atom ranges from C9 to C27. Compared with the laboratory-scale upgradation strategy, the stirring propeller fitted inside the 6 L beaker provided more surface area for mixing the components (CTPO + silica gel + petroleum ether) and thus promoted the adsorption of polar compounds in CTPO onto the silica gel surface. The mixture was allowed to settle and then filtered through the Millipore micro-filtration system to remove any residual silica gel and other solid particles from the supernatant liquid. Then the solvent was recovered with the help of a rotary evaporator. In the laboratory-scale upgradation method, we had used ice as a cooling medium during solvent evaporation. Insufficient cooling in the condenser required heating of the StTPO-petroleum ether mixture for faster evaporation, led to evaporative loss of solvent, and led to the possibility of trace solvent remaining in StTPO. The laboratory chiller (ca. −10 C°) provided sufficient cooling during the solvent evaporation and did not require heating the solution.We have introduced a hedonic scale to compare the odour of crude and upgraded oil samples based on pleasant and unpleasant sensations (Table S3†). The hedonic scale for odor measurements is shown below.17 Based on the consensus of the occupants of the laboratory where the oil samples were prepared and studied, CTPO was rated as 8 (dislike very much). On the other hand, StTPO was rated as 5 (neither like or dislike) due to the faint smell of aromatic hydrocarbons. The reduction of polar fractions including sulphur-containing compounds in StTPO by selective adsorption on silica gel was responsible for the improvement of odour. This reduction is due to the longer contact time of silica gel with the CTPO in the overhead-stirring upgradation strategy, facilitating better adsorption of polar compounds by silica gel. GC-MS identifies sticky compounds like caprolactam, toluene, p-xylene, cyclohexene, 1-methyl-4-(1-methyl ethynyls), dodecanenitrile, heptadecanenitrile, which are adsorbed inside the silica gel. Also, methanol washing regenerates the used silica gel in its original size for further upgradation of CTPO is shown through GC-MS spectra (Fig. S2†).
3.3 Fuel property analysis
Surface tension studies revealed that the surface tension of upgraded oil is nearly matched with diesel due to the same chemical composition in both samples. Fig. S3† represents the surface tension of CTPO, StTPO, and diesel. Diesel's surface tension is found to be very close to the studies reported by Chhetri & Watts.18 However, there is a significant variation in the surface tension of CTPO due to a higher number of polar compounds compared to upgraded tire pyrolysis oil.19–23 During pendant drop formation in drop shape analyzer, CTPO exerts a phase separation between the bulkier tar phase and aqueous liquid phase due to the high interfacial tension compared to StTPO. Tests have been carried to study surface tension's effect, increasing the percentage of StTPO with diesel. The blending of StTPO with various diesel fraction (20–80%) causes not much variation in surface tension due to the hydrophilic nature of upgraded tire oil compared with diesel molecules (more miscibility). The surface tension of StTPO corroborates that the StTPO diesel blends have good atomization and spray behavior properties compared to CTPO. However, CTPO has higher surface tension due to more amount of carbonaceous deposits than StTPO. StTPO blended diesel fuels' density looks similar due to the high miscibility of StTPO blends with diesel (Fig. S5†). The density of CTPO and StTPO combinations are found to be higher than diesel due to more carbon content.During blend preparation, StTPO is mixed with diesel with various proportions using a laboratory stirrer at 500 rpm before calorific value analysis to ensure homogeneous mixing of the samples. The heating value of crude tire pyrolysis oil is found to be 42–44 MJ kg−1.24 The calorific value analysis reveals that the StTPO has a gross calorific value (GCV) of 42.54 MJ kg−1 compared with diesel (46.18 MJ kg−1). Wongkhorsub and co-authors reported the same calorific value for CTPO.25 The calorific value of StTPO increased by 0.78 MJ kg−1 after upgradation, which again confirmed the high carbon content in StTPO (83.26%) than CTPO (76.29%). Fig. S5† shows that the variation of calorific value of the StTPO–diesel blends. As the percentage of StTPO increased, the calorific value of its blends decreased gradually reaching minimum at pure StTPO (StTPO100). The calorific value of StTPO20 blend was found comparable to that of diesel.
The study also confirms the suitability of using StTPO as a fuel for diesel engines without any further modifications. The flashpoint is defined as the lowest possible temperature at which the test flame ignites the fuel.12 Fig. S6 in ESI† shows the flashpoint of various StTPO–diesel blends in comparison with conventional diesel. The flashpoint of StTPO was found to be lower than diesel due to the presence of compounds of diverse boiling points in StTPO compared to diesel. Predictably, the flashpoint of StTPO–diesel blends reduced with an increase in the percentage of StTPO. The viscosity of fuel mainly affects injector, lubrication, and fuel atomization. The viscosity of StTPO was found to be 2.54 cSt, 2.20 cSt, 2.07 cSt and 1.96 cSt at 40 °C, 50 °C, 60 °C and 70 °C, respectively. The viscosity of StTPO reduced due to the removal of polar compounds and gummy residues during upgrading. Murugan and co-authors conducted experiments in the internal combustion engine using CTPO as fuel and reported that the viscosity of CTPO is 1.5 times greater than diesel. The viscosity of StTPO–diesel blends reduced with increasing temperature due to diminished intermolecular interactions. Generally, CTPO has a lower cetane index than diesel due to high aromatic content and higher cycloalkanes as per the fuel property analysis reported by Martínez et al.11 The cetane index is indirectly proportional to aromatic composition in fuel. The cetane index is significantly improved after upgradation due to the adsorption of most polyaromatic compounds by silica gel. As the proportion of StTPO was increased in the StTPO–diesel blends, the aromatic content increases drastically, and the cetane index of the fuel mixture decreased, as depicted in Fig. S8.† StTPO showed the cetane index of 40 in comparison with diesel fuel.
The boiling point gives a measure of the volatility of liquid samples.18 Distillation is a widely used separation technique in most petroleum refineries to separate compounds based on their boiling point. The sample was added to a quartz round bottom flask and gradually heated with a heating mantle's help. Then the distillates were collected, and the initial and final boiling point of samples was recorded.23 The present study attempts to check the boiling point of StTPO and diesel. The crude form of pyrolysis oil is a multicomponent black colored liquid comprised of a wide range of compounds with various distillation range. Martínez et al. reported that the tire pyrolysis liquid has an initial boiling point of 82.2 °C and a final boiling point of 305.2 °C.11 It was observed that the initial and final boiling point of StTPO were 120 °C and 284 °C, respectively. In comparison, the initial and final boiling point of diesel were 145 °C and 286 °C. It can also be observed that the StTPO is lighter than CTPO and diesel. Flashpoint studies supported with distillation behavior revealed that tire oil samples are complex multicomponent fractions with various boiling range compounds. Similar results were reported for CTPO.9 The boiling point of StTPO looks close range with diesel due to similarities in chemical composition. Thus, it can be concluded that StTPO can be directly used as a fuel in a diesel engine without modification in the ignition timing. In contrast, the CTPO needs further improvement in ignition timing due to its high volatility.
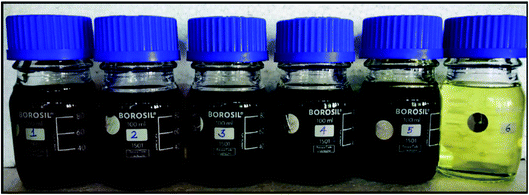
Stability studies were conducted to evaluate any change in the StTPO upon long term storage in the industry. The storage of StTPO in our laboratory for a six-month duration showed no phase separation or the formation of gummy residues on the walls of the container. It can be further explained that most reactive functionalities like olefins, aldehydes, ketones, and carboxylic acid are removed after upgradation. The crude tire pyrolysis oil's pungent smell is significantly improved after a scalable up-gradation strategy due to the adsorption of sulfides, mercaptans, and odorants by silica gel. Miscibility studies were conducted to check the solubility of StTPO with diesel. It was also observed that StTPO–diesel blends were found to be miscible at the entire concentration range. The GC-MS chromatogram of methanol washed silica gel supported with viscosity studies confirmed that the high viscosity of CTPO due to the presence of gummy like deposits. The viscosity is drastically improved after up-gradation using a modified strategy. It was also noticed that StTPO–diesel blends were miscible at the entire concentration range. Stability and spot tests give insights into the long-term storage stability of fuel and formulation of stable mixture for engine testing. The spot test is widely used to predict the possibility of fuel injector blockage, precipitates formation in fuel tank marine engines. A spot test is characterized by forming a distinctive circular ring after heating at 100 °C, which refers to the instability or incompatibility of fuels. The significant factors affecting the fuel stability are formulation, thermal and mechanical stresses upon storage, and the duration of storage. It can be seen that there is no distinctive spot in StTPO–diesel blends compared with CTPO. The formulation of the specific circular ring at the filter paper center suggests the phase separation in CTPO. The main reason for no particular circular ring in StTPO is better miscibility during blending and greater affinity of StTPO with diesel. Fig. 6 describes the cleanliness and compatibility of various fuels by spot test. As per comparison with ASTM D4740 adjunct reference spot, it can be observed that all the tested fuel samples are found to be stable and compatible except CTPO. Furthermore, the aging studies for six months showed the same results, confirming the blends' stability without any degradation or creaming effects.26 The rating scale and description of the standard spot test are attached in Table S3.† It was also noticed that StTPO–diesel blends were miscible at the entire concentration range (Fig. 5). There was no variation in the viscosity of samples before and after 6 months.
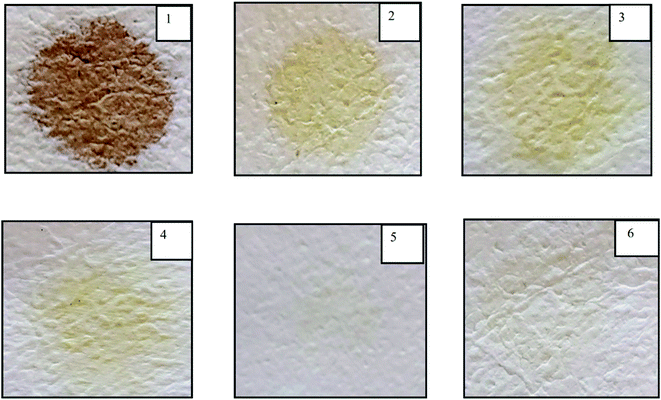 | ||
| Fig. 6 Cleanliness and compatibility of StTPO–diesel fuel blends by spot test. (1 – CTPO100, 2 – StTPO20, 3 – StTPO40, 4 – StTPO60, 5 – StTPO80, 6 – StTPO100). | ||
3.4 Two dimensional gas chromatography time-of-flight mass spectrometry
Comprehensive two-dimensional GC × GC TOF-MS is a powerful analytical tool to analyze the pyrolysis oil from waste-derived feedstocks like tires, plastics, etc.27 The limitation of traditional one-dimensional GC-MS is the overcrowding of peaks or unresolved peaks.37 This can be overcome by transferring the samples into two separate columns separated with a modulator by spreading compounds in a two-dimensional space based on the orthogonal separation. The exciting principle behind two-dimensional GC × GC TOFMS is the separation of mixtures by the polarity of species compared to one-dimensional GC-MS separation based on the compounds' boiling point.28–30,36 There are very few studies in the literature regarding the analysis of tire oil fractions using this advanced chromatographic technique. Ngxangxa reported that TPO is a complex mixture of C6–C24 compounds, including paraffins, terpenes, monocyclic and PAHs, heterocyclic compounds, etc.31 Due to the complexity in the chemical structure and composition, CTPO cannot be utilized directly in internal combustion engines or burners. Upgradation of CTPO is necessary to make it an attractive alternative fuel. As pointed out by Ngxangxa, TPO also contains a number of high-value chemicals like DL-limonene, 4-vinyl cyclohexane, toluene, ethylbenzene, xylene, styrene, and benzothiazole.31 Xylenes are used for the production of plasticizers and polymers. Benzothiazole is a commonly used accelerator during tire production. DL-Limonene has applications as resin, fragrance, industrial solvent, adhesives, dispersing agent for pigments, cleaning products, etc. DL-Limonene can be looked at a dimer of isoprene, which is formed by the thermal depolymerization of natural rubber in tires.The present study focuses on applying the two-dimensional GC × GC TOF-MS technique to analyze the CTPO, StTPO, and diesel with unique insights to the convergence to diesel range compounds. Further, reasons for the pungent odor during long term storage of CTPO and the market value of products from CTPO and StTPO. Aldehydamines, quanidines, thiazoles, sulfenamides, thiurams, dithiocarbamates, xanthates are the curing agents added during tire vulcanization. Out of these, thiazoles are widely used in most industries.32 During thermal depolymerization of tires, the polymer chain's sulfur bridges were broken due to thermal softening and resulted in a liquid fraction at 400 °C, at a rate of 10 °C min−1, 0.2 atm, 4 rpm. The blackish colored liquid from the pyrolysis process emits a foul smell to the environment due to the presence of sulfur compounds in thiazoles, sulfides, and disulfides. The contour plot of sulfur compounds detected by GC × GC TOF-MS in CTPO, StTPO, and comparison with diesel are shown in Fig. S12.† The GC × GC TOF-MS data supported with ICP-AES data suggests that the sulfur compounds from overhead-stirring processes are reduced by 48.86% compared to laboratory-scale strategy. As we have expected, the sulfur content is lower in diesel than CTPO and StTPO.
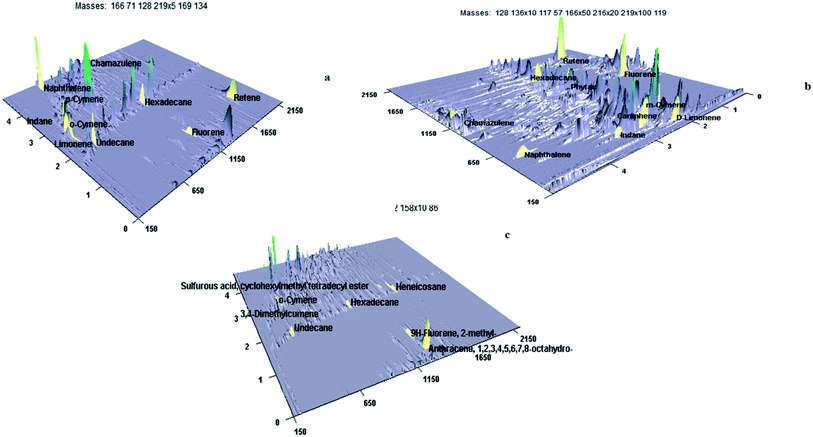
The high sulfur content in CTPO is due to compounds like diallyl sulfide, 2-mercaptobenzothiazole, thiobisphenols, tetramethylthiuram disulfide, 2-mercaptobenzothiazole disulfide, alkylphenol polysulfide, 2,2′-dibenzamidodiphenyl disulfide, thiosalicylic acid, N-cyclohexyl-2-benzothiazolesulfenamide are the compounds added during vulcanization.33 This study can also give more positive impacts on the existing tire pyrolysis industries to modify their target goals and open a new way for biorefineries. The typical three-dimensional image of interesting compounds identified by GC × GC TOF-MS in CTPO, StTPO, and diesel are shown in Fig. 7 (a)–(c). From our preliminary observation in the GC × GC surface plot, the separation space (peak capacity) is expanded compared to one-dimensional GC-MS.37 In the non-polar column, the analytes are separated based on the boiling point in one dimensional GC-MS. However, the polar column separates the analytes based on their polarity (enhances the peak capacity) in CTPO, StTPO, and diesel. Upgraded tire pyrolysis oil is a multicomponent mixture containing various compounds like aliphatic, aromatics, naphthalene's and benzene derivatives, etc. Camphene, chamazulene, cumene, n-hexadecane, and DL-limonene are some of the value-added compounds in StTPO and CTPO identified by two-dimensional GC × GC TOF-MS.
It can be seen that StTPO contains a more significant number of value-added compounds in comparison with diesel. Williams & Taylor reported that the primary mechanism in polyaromatic formation in rotating autoclave is cyclization, aromatization, and Diels–Alder reactions.38 During the pyrolysis of scrap tire, the depolymerization reactions triggered inside the rotating autoclave due to β-scission reaction at double bond of styrene–butadiene rubber results in the formation of ethane, propane, and 1,3-butadiene, which then reacts to form cyclic olefins.38 The mechanism for polyaromatics formation during the depolymerization of scrap tire inside the rotating autoclave is included in Fig. S9.†
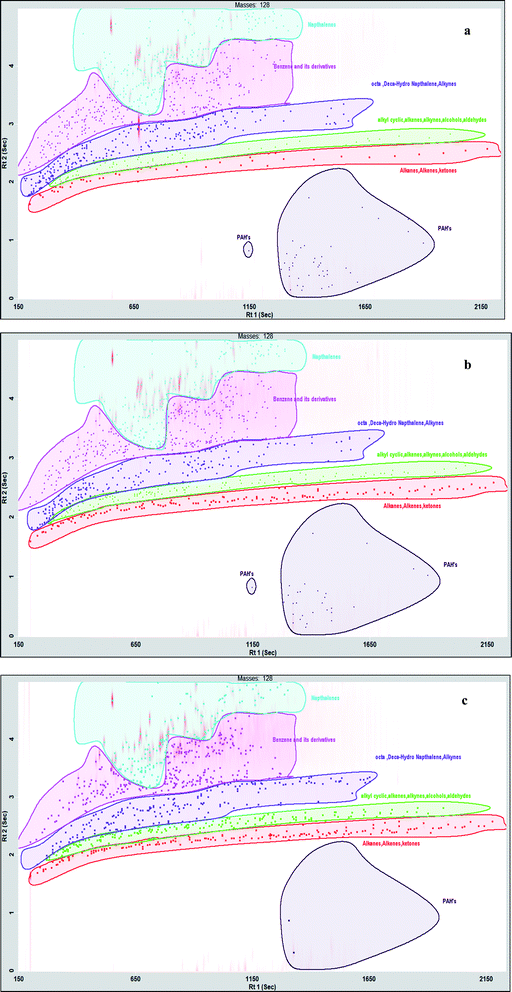
DL-Limonene, undecane, fluorene, phytan, indane, camphene retene, hexadecane, cumene, o-cymene, chamazulene, naphthalene are the major compounds identified in StTPO. Hexadecane, one of the most valuable hydrocarbons and is regarded as the diesel surrogate found in tire pyrolysis oil. Limonene is another interesting chemical widely found in CTPO, which is conventionally used to produce solvents, surfactants, pigments, etc.39 Fig. S13† displays the value-added compounds identified in StTPO by GC × GC TOF-MS. The various classes of compounds identified in CTPO, StTPO, and diesel are displayed in Fig. 8(a)–(c). The detailed list of compounds identified in CTPO, StTPO, and diesel are tabulated in ESI (Tables S4–S6†).
Fig. S13† represents the peak area percentage of carbon atoms in StTPO and diesel. It can be observed that the alkanes are dominant in StTPO in comparison with diesel, which is corroborated to stirring based during upgradation strategy, which aids in better mixing due to more surface contact between CTPO and silica in mixing based upgradation. Interestingly, compounds like dodecane, tetradecane, and pentacosane are similar in both samples. Paraffin is one of the significant components in diesel, which enhances the combustion properties. Cetane number of diesel depends on the presence of n-, iso-, and cycloparaffins. The relative solubility of paraffin's and iso-paraffin signifies the cold flow properties of diesel. Naphthalenes are other essential components in petroleum refinery products.34 The saturated hydrocarbons in StTPO (4.86%) are relatively higher than diesel (0.22%). The chromatograms of saturates in CTPO, StTPO, and diesel are shown in ESI (Fig. S11†). Table 3 shows the percentage of various classes of compounds in CTPO, StTPO, and diesel. A higher amount of aliphatic composition in StTPO can be explained due to the higher surface area due to the adequate mixing of CTPO with petroleum ether in a stirring-based approach. The same reason was reported in our previous studies. The naphthalene in StTPO (8.88%) and diesel (5.96%) show almost a similar range due to the same chemical complexity in both samples. The aromatics are the other exciting fraction in tire oil than diesel, which boils at a higher temperature.35 Aromatics are classified into monocyclic and polycyclic aromatics. These mainly constitute the benzene fractions and naphthalenes. As far as we know, there are no studies reported in the scientific literature regarding the exploration of upgraded tire oil analysis using GC × GC TOF-MS. The present study reveals that the aromatic fraction is more in CTPO than StTPO. The naphthalenes are lowered by 43.69% after upgradation, whereas the PAHs are scaled-down by 27.79% compared to CTPO. Benzene fractions have a significant role in combustion chemistry to accelerate the in-cylinder pressure and temperature. The benzene and derivatives are truncated by 25.68%. The primary reason for reducing benzene fraction in StTPO is the escape of benzene fractions due to a series of heating and cooling operations during the modified up-gradation strategy in the rotary evaporator. Mohan et al. (2019) reported that the reduction in polyaromatics in StTPO compared to CTPO is due to the adsorption of polyaromatics by silica gel.15 The same results were obtained for diesel sample analysis by Chakravarthy et al.40 The ignition delay in the engine was mainly due to higher aromatic content. The higher aromatic content in StTPO caused a longer ignition delay than diesel fuel. However, the ignition delay of StTPO was lower than CTPO due to the removal of polar compounds during upgradation. The scalable upgradation strategy removed majority of the nitrogen- and sulfur-containing compounds from CTPO by using silica gel as adsorbent and petroleum ether as a diluent. Silica gel adsorbed most of the PAHs due to its characteristic pore size and surface area of 40–60 Å and 350–450 m2 g−1, respectively.
| Class of compounds | CTPO (%) | StTPO (%) | Diesel (%) |
|---|---|---|---|
| Alkane, alkene, ketones | 3.709 | 15.38 | 26.171 |
| Alkyl cyclic, alkenes, alkyne, alcohol, aldehyde | 6.22 | 13.94 | 22.16 |
| Octa, deca-hydro naphthalene, alkynes | 34.534 | 32.32 | 27.38 |
| Benzene and derivatives | 36.372 | 27.03 | 17.49 |
| Naphthalenes | 15.772 | 8.88 | 5.96 |
| Polyaromatic hydrocarbons (PAHs) | 3.393 | 2.45 | 0.839 |
3.5 Differential scanning calorimetry
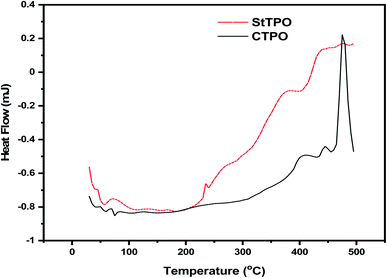
Differential scanning calorimetry (DSC) supported with thermogravimetric data gave insights about heat flow from the sample and reference (indium nitrate) as a linear function of temperature.14 Fig. 9 shows the DSC curve of crude and upgraded tire pyrolysis oil. This study also investigates whether the reaction nature is either endothermic or exothermic. The exothermic reaction is characterized by scission reactions, depolymerization, and endothermic reactions due to crosslinking and poly-condensation reactions.41 The endothermic peaks between 50–100 °C can be explained by the evaporation of moisture and low-boiling compounds from both CTPO and StTPO. Glass transition starts at 200 °C due to the phase change of both samples due to linear heating from 30–500 °C at a constant heating rate of 10 °C min−1. The region between 400–500 °C showed a frequent fluctuation in crude and upgraded oil samples thermal behavior. This fluctuation is caused by decomposition reactions, which resulted in an exothermic peak. The drastic fluctuation in the thermal behavior of CTPO around 500 °C was due to complex degradation reactions triggered by the relatively unstable polar compounds present in it. The study revealed that the StTPO is much stable at higher temperatures than CTPO. DSC studies showed the specific heat of CTPO and StTPO is 877 J g−1 K−1 and 624 J g−1 K−1. It can be concluded that the StTPO required less energy to vaporize than CTPO, which is attributed to less amount of higher-boiling compounds in StTPO.3.6 Fluorescence in crude and upgraded oils
Fluorescence studies give information about the presence of polyaromatic fractions in pyrolysis oil. The shape and position of peaks in fluorescence spectra mainly affect the chemical composition, stability, etc. Ambrosewicz-Walacik & Piętak studied the fluorescence spectra of distilled tire pyrolysis oil and concluded that polycyclic hydrocarbons presence is the primary reason for fluorescence.42 To the best of our knowledge, there are only a few literature on the fluorescence study of CTPO. UV-visible spectroscopy was initially used to find out the excitation wavelength of the CTPO and StTPO samples (Fig. S16†). The fluorescence spectra of CTPO and StTPO are attached in ESI (Fig. S17†). The UV-visible spectra supported with fluorescence data showed the high fluorescence property of CTPO. Fluorescence shown by CTPO and StTPO can be attributed to the presence of PAHs like anthracene, benzopyrene, benzo fluoranthene, perylene, and anthanthrene in them.43 Fluorescence shown by StTPO was significantly lower than CTPO due to the partial removal of polyaromatics from the latter by selective adsorption over silica gel.4. Utilization of StTPO–diesel blends as fuel for diesel engines
4.1 Performance characteristics
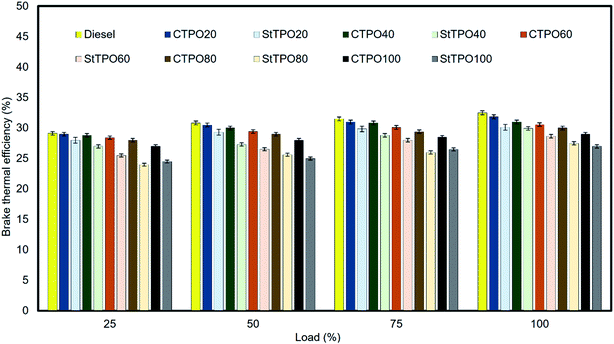
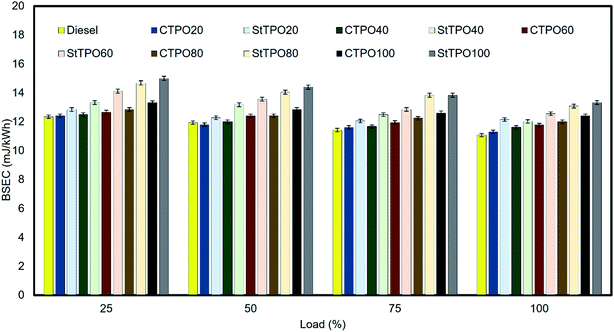
The various fuel blends were prepared on a volumetric basis by blending various percentages of StTPO and diesel. The prepared fuel blends were named as diesel, StTPO20, StTPO40, StTPO60, StTPO80, StTPO100 and CTPO100. The brake thermal efficiency (BTE) and brake specific fuel consumption are the critical parameters used to ascertain a compressed ignition engine's performance characteristics operated with fuel samples. BTE indicates the usable power delivered from the chemical energy stored in the fuel.44 Therefore, it gives an idea of fuel conversion efficiency. It depends upon the aromatic content, viscosity, density, calorific value. Fig. 10 delineates the BTE of CTPO–diesel (CTPOxx) and StTPO–diesel blends. It can be noticed that the BTE increases with a rise in load due to an increase in brake power of the engine for all the tested fuel samples. The BTE of CTPO20, CTPO40, CTPO60, CTPO80, and CTPO100 at full load were recorded as 31.85%, 31%, 30.56%, 30%, and 29% whereas the BTE of StTPO20, StTPO40, StTPO60, StTPO80, and StTPO100 at full load was 30.12%, 29.95%, 28.65%, 27.50%, and 27%, respectively. From this, it can be concluded that the BTE of StTPOxx was slightly lower than CTPOxx, which is attributed to the lower heat release of StTPO during premixed combustion than CTPO.45 GC × GC TOF-MS data supported by the combustion analysis corroborated that the presence of a high amount of polyaromatics in CTPO resulted in an abrupt rise in the heat release rate during premixed combustion, causing higher BTE in CTPO than StTPO. The diesel showed higher thermal efficiency of 32.5% among the fuel tested due to a higher calorific value than other tested fuel samples. Interestingly, the heat release rate is a predominant factor in the present study due to diversity in the chemical composition in CTPO and StTPO. Similar results of CTPO were found in the literature.22,45The brake specific energy consumption (BSEC) is an important parameter used to find the amount of energy spent to produce unit power. BSEC is a reliable factor in accessing fuel consumption when fuels of different densities and calorific values are blended. BSEC is a product of brake specific fuel consumption and calorific value. Thus, a lower BSEC of fuel is better to maximize engine performance. The BSEC of CTPOxx and StTPOxx blends are portrayed in Fig. 11. BSEC decreases with an increase in load for all fuel samples. It can be seen that the BSEC of CTPOxx and StTPOxx are relatively higher than diesel due to the high density of tire oil samples. Diesel shows lower energy consumption among the fuel tested due to its higher energy content with lower aromatics compared to CTPOxx and StTPOxx. Generally, crude oil extracted from scrap tire consume less fuel than diesel. However, the production conditions like reactor configuration, pressure, the temperature inside the reactor, and type of engine have a significant role in reaching a common BSEC variation trend. The amount of fuel needed to produce the same power output is higher, with an increase in the percentage of CTPO as per the conclusion of the study of CTPO.22
4.2 Combustion analysis
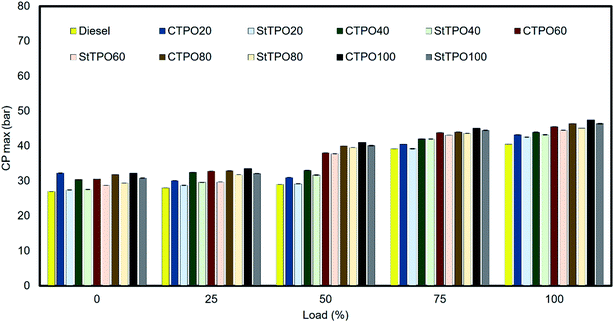
The combustion analysis inside the cylinder is explained by in-cylinder pressure. The variation of maximum cylinder pressure for CTPO, StTPO, is shown in Fig. 12. It can be observed that the peak pressure increases with an increase in load for all fuel blends. The maximum in-cylinder pressure of CTPO20, CTPO40, CTPO60, CTPO80 and CTPO100 are 43.19, 43.89, 45.48, 46.40, and 47.4 bar, respectively. In comparison, the in-cylinder pressure of StTPO20, StTPO40, StTPO60, StTPO80 and StTPO100 are 42.5, 43.2, 44.50, 45.09, and 46.38 bar, respectively. The cylinder pressure increased from 32.17 bar to 47.14 bar in the case of CTPO100, 27.4 bar to 42.5 bar in the case of StTPO100, and 27 bar to 40.48 bar in the case of diesel, respectively. There is no significant variation in-cylinder pressure of CTPO and StTPO blends at lower loads than peak loads. However, the variation in the cylinder pressure is more pronounced at peak load. It was evident that the cylinder pressure of CTPO–diesel blends were noticeably higher than StTPO–diesel blends due to more aromatic hydrocarbons in the former. The major factors affecting the peak pressure are ignition delay, amount of fuel combusted during the premixed combustion phase as per the study of CTPO in a single-cylinder diesel engine as per data reported in the literature.22 Crude tire pyrolysis oil (CTPO) consists of a multi-component mixture with a wide range of boiling compounds like an alkane, alkenes, aldehydes, ketones, carboxylic acids, etc. The high temperature inside the cylinder causes a sudden breakdown of unsaturated compounds with a higher molecular weight in CTPO compounds with lower molecular weight. These complex reactions induce a dense inner core with higher molecular weight and a gaseous phase formation on the periphery. Rapid gasification of volatile compounds in the periphery may ignite rapidly and cause a sudden rise in the cylinder pressure. The peak pressure in CTPO was higher than StTPO due to a presence of a larger number of molecules with a wide boiling-point range in the former than the latter. The silica gel used in the upgradation strategy adsorbed majority of the high molecular weight compounds and polar fractions in CTPO resulted in lower cylinder pressure during engine operation. Another reason may be the longer ignition delay, higher viscosity, and low cetane index of CTPOxx and StTPOxx than diesel. The fuel deposited on the cylinder walls during premixed combustion can also result in a steep rise in pressure and temperature during the premixed combustion phase.4.3 Emission analysis
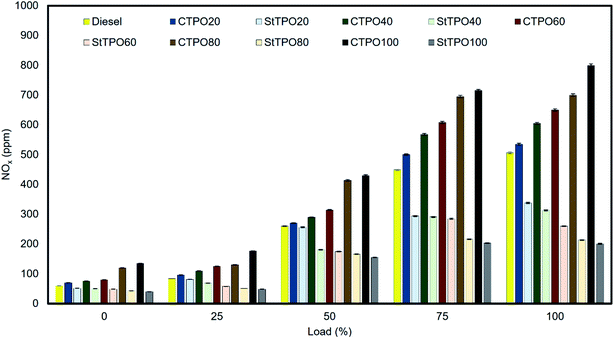
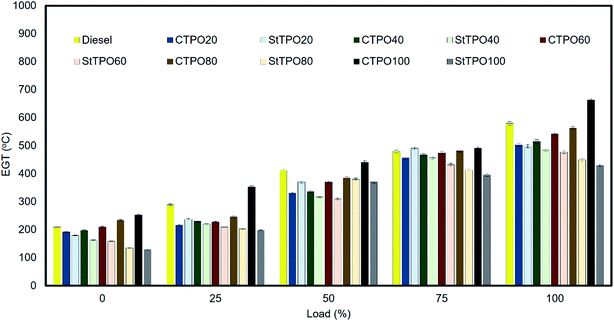
The factors affecting nitrous oxide emissions from the tailpipe of diesel engines are air to fuel ratio, oxygen concentration, cylinder temperature, cetane index, nitrogen content, residence time, adiabatic flame temperature, and injection timing, and ignition delay, etc.42,62,63 Fig. 13 portrays NOx emission variation from CTPOxx and StTPOxx from the engine's tailpipe before and after up-gradation. It can be observed that the NOx emissions in lower in StTPO (nitrogen content 2.12%) than CTPO (nitrogen content 1.76%) due to the partial removal of nitrogen-containing compounds from the latter during the upgrading process. StTPO had low nitrogen content and relatively lower aromatics than CTPO, resulting in lower NOx formation.The NOx emissions from CTPO20, CTPO40, CTPO60, CTPO80 and CTPO100 were recorded as 535, 605, 650, 700, and 800 ppm, respectively. The emission from StTPO20, StTPO40, StTPO60, StTPO80, and StTPO100 were found to be 338, 313, 260, 213, and 201 ppm, respectively. Among all fuel blends, StTPO20 had the lowest NOx emission and values increased as the concentration of CTPO or StTPO was increased in the fuel blends. Due to the low cetane index and higher density of StTPO than diesel causes inferior combustion and higher latent heat of evaporation occurred inside the engine cylinder, which reduces the pressure and temperature, leading to lower nitrous oxide formation. Similar results for CTPO are reported in the literature.21 The NOx emission from fuel blends StTPO20 and StTPO40 was reduced by 38.54% and 43.09% due to the overhead-stirring upgradation process compared with diesel. However, the emission levels are slightly higher than the neat diesel. The tremendous drop in the amount of aromatic fraction after upgradation lowers the flame propagation speed inside the combustion chamber. Exhaust gas temperature is found to increase with the rise in load and is shown in Fig. 14.
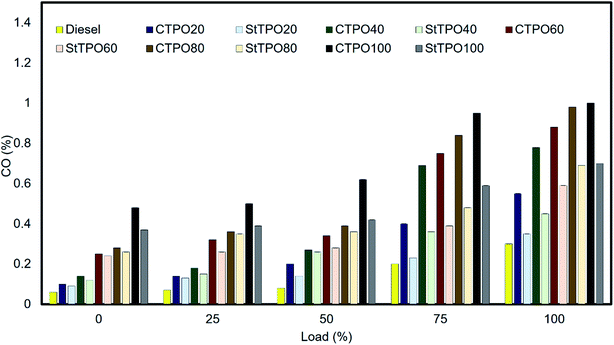
Carbon monoxide emissions are formed due to incomplete combustion of carbon and oxygen atoms inside the combustion chamber, which results in the formation of deposits on the surface of piston and cylinder surfaces. The prominent factors that affect the formation of incomplete combustion are high viscosity of fuel blends, retardation in ignition timing, the high carbon content in fuel, air to fuel ratio of fuel, air–fuel density, fuel bound oxygen, etc.46 Fig. 15 shows the variation of CO with engine load from 0 to 100% for various fuel blends. It can be seen that CO emissions increased gradually with an increase in the concentration of CTPO and StTPO. The CO emissions from CTPO20, CTPO40, CTPO60, CTPO80 and CTPO100 are 0.55, 0.78, 0.88, 0.98, and 1% respectively but the CO emissions from StTPO20, StTPO40, StTPO60, StTPO80 and StTPO100 are recorded as 0.35, 0.45, 0.59, 0.69 and 0.7%. With an increase in the ratio of CTPO and StTPO in fuel blend, there is a dramatic rise in the carbon monoxide emissions from engines comparable with diesel (0.3%). Similar results of CTPO were reported elsewhere.22,47–49 Among the tested fuel blends, the carbon monoxide emission from StTPO20 was the lowest (0.35%) at 100% load and comparable with diesel. The carbon monoxide emission in StTPO20 reduces by 36.36% in comparison with CTPO20. However, the emission levels are slightly higher than diesel for a higher blends ratio of StTPOxx and CTPOxx. Due to the high amount of CTPO and StTPO blends, the lower air to fuel ratio (high density and higher viscosity in the case of CTPO) inside the combustion chamber leads to leaner formations fraction inside the combustion chamber.50 Due to the leaner mixture formation, – flame may not propagate to the fuel mixtures near cylinder walls and crevices, resulting in incomplete combustion and soot-like deposits.22
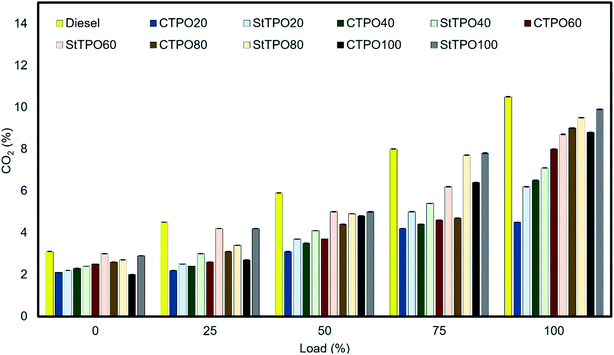
Carbon dioxide emissions indicate the oxidation tendency of carbon atoms in fuel blends, insufficient oxygen quantity inside the combustion chamber. The significant factors affecting carbon dioxide emissions are air to fuel ratio, oxygen content, carbon content, density, viscosity, etc. Fig. 16 represents the carbon dioxide variation of various fuel blends for the different loads. It can be noted that the carbon dioxide emissions from the tailpipe of the engine gradually rise to load variation from low to peak load. Diesel has the highest carbon dioxide emission from the fuel tested due to its low density than other fuel blends. The lowest carbon dioxide emission from CTPO100 is due to the higher density of CTPO compared to different fuel blends. The higher density of fuel causes more fuel consumption on a mass basis than the fuel injected –, which results in lower air to fuel ratio, resulting in less CO2 production.46 A similar trend of CO2 from CTPO was reported in the literature.46,48,49,51
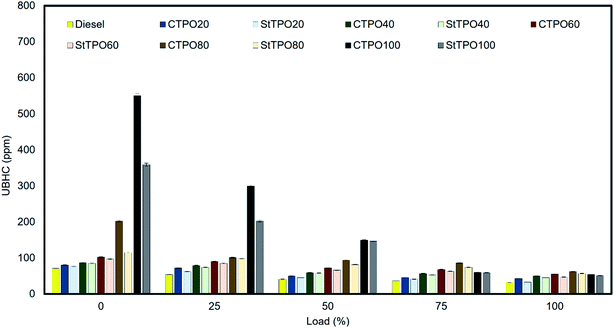
Unburnt hydrocarbons is formed due to incomplete combustion of fuel molecules inside the combustion chamber. Literature about studies on the application of waste tire-derived oils in engine showed that volatility, viscosity, cetane index, availability of oxygen, sulfur content, air to fuel ratio are some of the factors leads to the formation of hydrocarbons.46–49 Fig. 17 displays the variation of hydrocarbon emission with the load. It has been noticed that the concentration of hydrocarbons decreases with the engine load varies from 0 to 100% load.47,52 Murugan and co-authors argued that the presence of unsaturated hydrocarbons (alkenes, alkyne fractions) is the reason for the drastic rise in unburned hydrocarbons from CTPO and distilled TPO blends.22 Among the fuel tested, the hydrocarbon emission from upgraded tire pyrolysis oil is significantly lowered by the refinement of CTPO by silica gel and petroleum ether. For example, the release of hydrocarbons from StTPO20 was reduced by 14% compared to CTPO20, but emissions from StTPOxx blends are slightly more generous than diesel. During the tire's production, aromatic oils are enriched with compounds like chrysene, retene, chamazulene, benzopyrene, benzo anthracene, benzo fluoranthene, dibenzo anthracene, naphthalene were added to the raw tire, which acts as a cushion between the molecular chain of rubber to improve its lubricity. These polycyclic aromatic hydrocarbons (PAHs) are relatively higher in CTPO than StTPO and diesel. These PAHs are partially downstream during the cylinder's combustion process, resulting in more volatile hydrocarbons at the cylinder's center. The crevice volume is left unburnt, which, develops a non-homogeneous air–fuel mixture inside the cylinder leading to the formation of unburnt hydrocarbons.
5. Utilization of StTPO-EL-DF as a ternary blend in diesel engines
5.1 Fuel properties of StTPOxxEL10 blends
The various fuel blends were prepared on a volumetric basis by blending various StTPO and diesel percentages by adding 10% EL. Fuel blends are named StTPOxxEL10, where xx denotes the percentage of upgraded tire pyrolysis oil in the ternary mixture. The prepared fuel blends were named as diesel, StTPO20EL10, StTPO40EL10, StTPO60EL10, StTPO80EL10, StTPO90EL10, StTPO100 and CTPO100. Very few studies reported on the literature to study EL–diesel blends on performance, combustion, and emissions from diesel engines. To the best of our knowledge, no studies were reported on the effect of EL as a bio-diluent in StTPOxx blends. The various ternary fuel blends were prepared by the blending of StTPO, EL, and diesel using a lab-scale stirrer at a rotational speed of 500 rpm for one hour. The prepared blends were stored in glass containers for six months to study whether their is any phase separation with time. It has been noticed that no phase separation was observed in the stored glass containers. The prepared fuel blends properties are determined as per ASTM standards, and the tested fuel properties are detailed in Table S7.† It can be evident that fuel blends density and viscosity decrease with 10% EL into the StTPO. However, there is a significant reduction in gross calorific value and cetane index with EL in StTPO. Furthermore, the flashpoint of StTPOxxEL10 was found to be increased with the addition of 10% EL. EL shows superior cold-flow properties and has been used as an additive for biodiesel to improve the cold-flow properties of the latter.53 However, in the present work, this was not the sole purpose. The authors reasoned that blending StTPO with a stable oxygenate will lead to a cleaner-burning fuel with reduced emission. Besides, biomass-derived EL was never tested as an additive to TPO and could improve sustainability of the fuel mixture. The PP of StTPO was found to be −50 °C, whereas the PP of StTPO90EL10 marginally increased to −45 °C. This observation is in line with literature data where the addition of EL increases the PP to a small extent, possibly due to the higher melting point (ca. 25 °C) of EL.66 However, the cold-flow properties is not determined by PP only and other parameters such as cloud point (CP) are equally important. The cloud point of EL-blended fuels is generally improved due to better miscibility of EL with various fuel components.53EL's solubility in diesel is a major technical constraint regarding EL's commercialization as an additive in deployment at a larger scale. However, the EL in StTPO showed better miscibility without any separation due to more polar fractions (mostly oxygenates and alcohol) in StTPO than diesel. Fig. 18 shows the cleanliness and compatibility studies of StTPOxxEL10 blends.
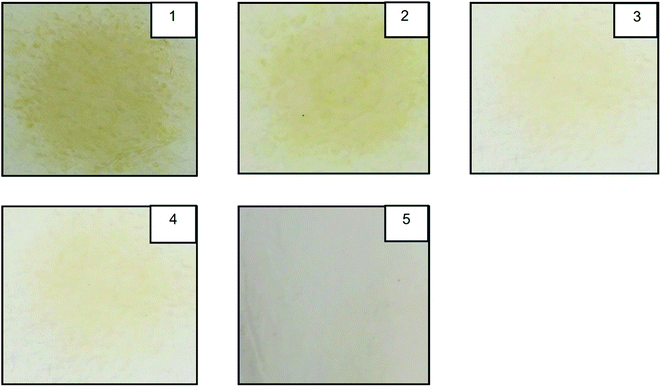 | ||
| Fig. 18 Cleanliness and compatibility studies of StTPOxxEL10 ternary blends by spot test. (1 – StTPO20EL10, 2 – StTPO40EL10, StTPO60EL10, StTPO80EL10, StTPO90EL10). | ||
5.2 Effect of ethyl levulinate as a fuel additive in single cylinder diesel engine
EL has shown a versatile chemical in single-cylinder diesel engines due to its multifunctional groups like ketone and ester, inherent fuel properties such as high lubricity, improved flow, low sulfur content, improved flashpoint, and stability. It can be seen that the addition of 10% EL in StTPO results in a reduction in BTE, which can be ascribed due to the lower heating value of EL (Fig. S18†). Lower heating value consumes more fuel during engine combustion. Higher latent heat of evaporation induces a cooling effect inside the combustion chamber, which results in a lower heat release rate.54–56 BSEC is the most reliable parameter to access fuel consumption when two different fuels with different density and calorific value blended.57 The variation of brake specific energy consumption with load is shown in Fig. S19.† It can be noticed that the increase in BSEC with the addition of 10% EL in StTPO due to lower heating value of EL (24 MJ kg−1) than StTPO100 (41.76 MJ kg−1) and diesel (43.80 MJ kg−1).58 Thus, the performance parameters like BTE and brake specific fuel consumption (BSFC) studies revealed that the lower heating value of EL consumes more fuel results in higher BSFC with lower BTE.The maximum in-cylinder pressure in compression ignition engines gives valuable information regarding the ignition delay, fuel mixture preparation, and combustion rate at initial combustion stages.45 The addition of 10% EL in StTPO caused a longer ignition delay due to the lower cetane index of StTPO90EL10 than StTPO100 (Fig. S20†). However, the ignition delay is reduced at a lower blend of StTPOxxEL10 due to the convergence of the cetane index towards the diesel range. Thus, the combustion characteristics like in-cylinder pressure, heat release rate, and pressure rise explain low heat release and cylinder pressure by adding 10% EL to StTPO100, which can be attributed to the low heating value and cetane index of StTPOxxEL10 blends compared to StTPO100. The ignition delay of StTPOxxEL10 combinations is higher than StTPO due to the lower cetane index of EL than StTPO.
The variation of NOx and exhaust gas temperature with engine load was shown in Fig. S21 and S22.† The blending of 10% EL to StTPO40 lowered the NOx emission by 44.54% due to lower cylinder temperature in the EL-blended fuels. Interestingly, EL (307 kJ kg−1) higher latent heat evaporation than diesel (270 kJ kg−1) also cools the combustion chamber, leading to low nitrous oxide formation.57 The NOx emissions are found to increase with a rise in the load gradually. Engine studies conducted by Lei and co-authors argued that an increase in EL (above 10%) in diesel oil induces more oxygenates to the engine cylinder supersedes the cooling effect.57 Also, the oxygen content in CTPO and StTPO is higher than diesel, but increased nitrogen fraction in CTPO and StTPO lowers the cooling effect, leading to more NOx than diesel. Murugan and co-authors reported similar results of CTPO.22 Kovisto et al. proposed that lower nitrous oxide emission from EL than butyl levulinate can be explained by the occurrence of heat release in EL's expansion stroke.59 Thus, the high cylinder volume results in lower nitrous oxide emissions. The variation of NOx formation is caused due to the competition between the cooling effect (due to reduction in an activation energy barrier, low calorific value, high latent heat of evaporation) of EL additive inside the engine and the opposite effect of lower cetane number, high ignition delay during premixed combustion phases. This variation can be a shift on one side or another, depending on the engine's operating conditions.60 The interpretation of exhaust gas temperature with load was showed a similar trend as NOx emission.
The addition of 10% EL with StTPO blends showed a significant amount of carbon monoxide reduction compared to CTPO, but there is a slight increase in neat diesel. Fig. S23 and S24† shows the variation of CO and CO2 emissions from StTPO-EL blends and comparative study with StTPO and diesel. 52.85% reduction in CO by adding 10% EL as a diluent in StTPO40 is due to the presence of a higher amount of oxygenates in EL (C7H12O3) than CTPO100. The oxygen atoms in EL results in the oxidation of a greater number of carbon atoms forming a homogeneous air–fuel mixture inside the combustion chamber, which leads to lower CO emissions. There are many attempts made to reduce carbon monoxide emission from waste tire-derived fuels by using biodiesel, dimethyl carbonate, and diethyl ether, etc.61 Studies conducted using 10% diethyl ether as an additive in crude tire pyrolysis oil resulted in a 66% reduction in CO.48,49 They have pointed that excess oxygen content in diethyl ether is responsible for lower CO formation, similar to the present investigations. Like CO emissions, the complete oxidation of a carbon atom leads to more CO2.41 Another interesting reason in the present investigation for the reduction in CO in StTPOxx blends than StTPO100 can be explained with the carbon content in EL, StTPO, CTPO, and diesel (ESI†) The less carbon content in EL lowers the CO emission and release more CO2 emissions than CTPO. Still, the CO emission is slightly higher than diesel.
The addition of EL in StTPO blends lowered the hydrocarbon emissions. Fig. S25† displays the variation of hydrocarbon emission of StTPO-EL blends with variation in load. Hydrocarbon (HC) emission decreased with an increase in load for all fuel blends. The addition of 10% EL into StTPO caused a reduction in hydrocarbon emission by 25.49%. The reduction in hydrocarbon emission in StTPO-EL blends was mainly due to the high oxygen content in EL resulting in more complete combustion inside the engine cylinder. Due to the ketone and ester functionalities in EL, stable intermediates are produced during the autoxidation process, when compared to CTPO and StTPO.57,64 The stable intermediates lowered the reaction rate leading to low HC emission.48,49,65 In short, the emission of NOx, CO, CO2, and HC were significantly low in StTPO–EL blends due to high oxygen content and high latent heat of evaporation of EL. High latent heat of evaporation removed heat from the combustion chamber and created a cooling effect inside the combustion chamber, which lowered the NOx formation. For similar reasons, the addition of 10% EL in StTPO40 reduced the emission of CO by 14.28%, compared to StTPO100, but the value is slightly higher than diesel.
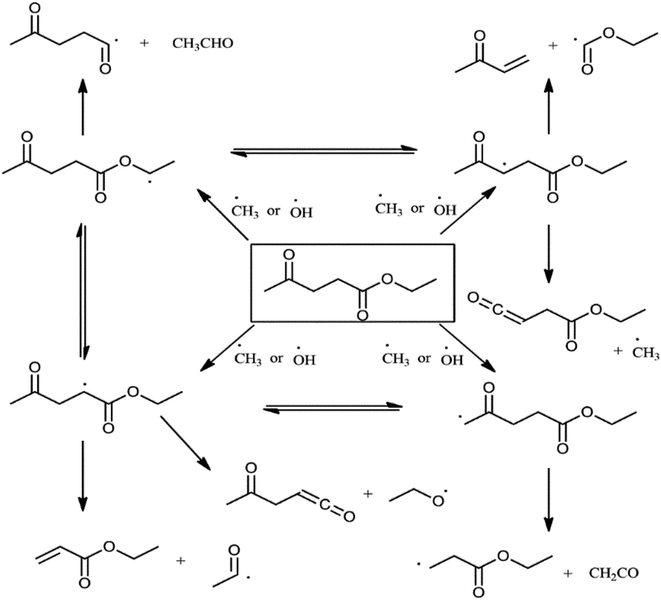
Phase stability and fuel compatibility of StTPOxxEL10 blends are similar to diesel due to EL's better miscibility in StTPO and diesel. Finally, it can be concluded that fuel blends with a lower percentage of EL can be utilized in a single-cylinder diesel engine due to their superior fuel properties and less toxicity compared to other fuel additives. EL, the oxygen-rich fuel additive in the StTPOxxEL10 blends promotes autoxidation reaction inside the engine cylinder. The decomposition pathway of EL under the auto-oxidation process in a diesel engine is shown in Fig. 19. In the proposed scheme of EL autoxidation, the process was initiated by hydroxyl and methyl radicals through β-scission and hydrogen abstraction reactions.64,65 Ethyl acrylate and ethyl vinyl ketone are the primary products of EL autoxidation reactions. Therefore, it can be concluded that the reaction lowers the activation energy barrier by forming stable intermediates of ethyl levulinate, which may result in lower cylinder temperature and lower emissions from a single-cylinder diesel engine. Thion and co-authors reported similar discussions for methyl levulinate esters.65
6. Conclusions and future directions
In summary, we have demonstrated an innovative, inexpensive, and scalable upgradation strategy of CTPO, produced by the thermal pyrolysis of end-of-life automobile tires in a 10 ton rotating autoclave reactor. Extensive characterization of CTPO and the upgraded oil i.e., StTPO using various sophisticated analytical instruments showed that the physical, chemical, and thermal properties of the latter improved significantly due to the preferential adsorption of polar oxygenates present in the former onto silica gel. The physicochemical properties of StTPO also improved in comparison with CTPO. The physical recovery of StTPO in the overhead-stirring upgrading was roughly 10% higher than the magnetic-stirring process. The sulfur content, polyaromatics, and naphthalene compounds decreased after upgradation by 48.86%, 27.79%, and 43.69%, respectively. StTPO was tested in a single-cylinder direct-injected diesel engine to study the performance, combustion, and emission characteristics. The engine ran smoothly without any mechanical inconvenience or failures by the use of StTPOxx and StTPOEL10. StTPO40 and StTPO40EL10 were found to be the optimum blend in terms of performance, combustion, and emission characteristics. The single-cylinder diesel engine's performance fuelled with StTPOxx was slightly lower due to multi-component functionalities with various distillation ranges. Heat release data supported by the pressure rise rate showed that the heat release of StTPO was higher due to aromatics, naphthalene, and benzene derivatives. Nitrous oxide emission from StTPO40 and StTPO40EL10 was significantly lowered by 43.09% and 44.54%. Further, the addition of EL in StTPO reduced performance but improved the emission characteristics. The engine studies showed that the lower percentage of StTPO blends (e.g., StTPO40 and StTPO40EL10) can be utilized in single-cylinder diesel engines. Fuel blends with higher percentage of StTPO may be applied in the marine engine, furnaces, and in boilers.Future research can be carried out in the following areas: quantification of specialty chemicals in CTPO, process modeling and techno-economic analysis of pyrolysis system with upgradation unit using Aspen plus, field testing of StTPO in agricultural engines and on-road vehicles to study the corrosion, wear, genotoxicity and cytotoxicity.
Conflicts of interest
There are no conflicts to declare.Acknowledgements
The authors would like to thank the Sophisticated Analytical Instrument Facility (SAIF), Indian Institute of Technology Madras, Chennai, India, SAIF, Indian Institute of Technology Bombay, Mumbai, India, for collecting analytical data. The authors also like to thank the Faculty and Staff of Combustion Laboratory, Indian Institute of Technology Hyderabad, India the Faculty and Staff of Internal Combustion Engine Research Laboratory, Department of Mechanical Engineering, National Institute of Technology Karnataka, India, and Mandakan Energy Products, Palakkad Kerala, India. Further, authors thank National Institute of Technology Karnataka, Surathkal, India, for sanctioning Article Processing Charges (APC) and Ministry of Education (MoE), Government of India, for providing financial support for conducting experiments.References
- M. Karagoz, U. Agulut and S. Saridemir, Fuel, 2020, 275, 117–844 CrossRef.
- https://www.tirereview.com/indian-tire-industry-update-staring-at-a-slowdown/.
- P. S. Ware, Chem. Biol., 2015, 1, 1–9 Search PubMed.
- A. M. Mastral, R. Murillo, M. S. Callen, T. Garcia and C. E. Snape, Energy Fuels, 2000, 14, 739–744 CrossRef CAS.
- A. Petchkaew, Ph.D. thesis, University of Twente, 2015.
- D. Czajczynska, K. Czajka, R. Krzyzynska and H. Jouhara, Therm. Sci. Eng., 2020, 20, 100–690 Search PubMed.
- M. A. Barlaz, W. E. Eleazar and D. J. Whittle, et al., Waste Manage. Res., 1993, 11, 463–480 CrossRef CAS.
- R. Siddique and T. R. Naik, Waste Manag., 2004, 24, 563–569 CrossRef CAS PubMed.
- A. Benzzouk, O. Douzane, T. Danglet, K. Mezreb, J. M. Roucoult and M. Queneusec, Cem. Concr. Compos., 2007, 29, 732–740 CrossRef.
- F. J. Navarro, P. Partal, F. J. Martinez-Boza and C. Gallegos, Polym. Test., 2010, 29, 588–595 CrossRef CAS.
- J. D. Martínez, M. Lapuerta, R. Murillo and T. Garcia, Energy Fuels, 2013, 27, 3296–3305 CrossRef.
- P. T. Williams, R. P. Bottrill and A. M. Cunliffe, Process Saf. Environ. Prot., 1998, 76, 291–301 CrossRef CAS.
- M. Arabiourrutia, G. Lopez, M. Artexe, J. Alvarez and J. Bilbao, Renewable Sustainable Energy Rev., 2020, 129(109), 932 Search PubMed.
- C. Sathiskumar and S. Karthikeyan, Sustainable Mater. Technol., 2019, 22, e00125 CrossRef CAS.
- A. Mohan, S. Dutta and V. Madav, Fuel, 2019, 250, 339–351 CrossRef CAS.
- V. Madav, S. Dutta, and A. Mohan, Indian Pat., 347787, 2020 Search PubMed.
- J. Lin, Hedonic scaling: a review methods and theory, Food Qual. Prefer., 2011, 22, 733–747 Search PubMed.
- A. B. Chhetri and K. C. Watts, Fuel, 2013, 104, 704–710 CrossRef CAS.
- G. R. A. Chumpitaz, C. J. R. Coronado, J. Carvalho, J. C. Andrade, A. Z. Mendiburu, G. M. Pinto and T. A. Desouza, J. Braz. Soc. Mech. Sci. Eng., 2019, 41, 139 CrossRef.
- J. Lehto, A. Oasmaa, Y. Solantausta, M. Kyto and D. Chiaramonti, VTT Publ., 2013, 87, 79 Search PubMed.
- T. Tzanetakis, N. Ashgriz, D. F. James and M. J. Thomson, Energy Fuels, 2008, 22, 2725–2733 CrossRef CAS.
- S. Murugan, M. C. Ramaswamy and G. Nagarajan, Waste Manage., 2008, 28, 2743–2749 CrossRef CAS PubMed.
- Y. Elkasabi, V. Wyatt, K. Jones, G. D. Strahan, C. A. Mullen and A. A. Boateng, Energy Fuels, 2020, 34, 483–490 CrossRef CAS.
- A. Khaleque, M. R. Islam, M. S. Hossain, M. Khan, M. S. Rahman and H. Haniu, International Conference on Mechanical Engineering and Renewable Energy, Bangladesh, November, 2015 Search PubMed.
- C. Wongkhorsub and N. Chindaprasert, Energy Power Eng., 2013, 5, 350–355 CrossRef CAS.
- Marine fuel handling in connection with stability and compatibility, CIMAC Guidelines, International Council of Combustion Engines, pp. 1–24 Search PubMed.
- P. Vozka and D. Vrtis, Energy Fuels, 2019, 33, 3275–3289 CrossRef CAS.
- B. Onorevoli, M. E. Machado, A. S. Polidoro, V. A. Corbelini and A. Jacques, Energy Fuels, 2017, 31, 9402–9407 CrossRef CAS.
- R. L. Ware, S. M. Rowland, R. P. Rodgers and A. G. Marshall, Energy Fuels, 2017, 31, 8210–8216 CrossRef CAS.
- R. L. Ware, S. M. Rowland, J. Lu, R. P. Rodgers and A. G. Marshall, Energy Fuels, 2018, 32, 7752–7761 CrossRef CAS.
- S. Ngxangxa, Mtech thesis, Stellbosch University, 2016.
- A. Joseph, B. George, K. Madhusoodanan and R. Alex, Rubber Sci., 2015, 28, 82–121 Search PubMed.
- L. Bockstal, T. Berchen, Q. Schmetz and A. Richel, J. Cleaner Prod., 2019, 236, 117–574 CrossRef.
- H. E. Toraman, T. Dijkmans, M. R. Djokic, K. M. Vangeem and G. B. Martin, J. Chromatogr. A, 2014, 1359, 237–246 CrossRef CAS PubMed.
- V. Muzyka, S. Veimer and N. Shmidt, Scand. J. Work, Environ. Health, 1998, 24, 481–485 CrossRef CAS PubMed.
- T. Dutriez, M. Courtiade, D. Thiebaut, H. Dulot, F. Bertoncini, J. Vial and M. C. Hennion, J. Chromatogr. A, 2009, 1216, 2905–2912 CrossRef CAS PubMed.
- T. M. Almeida, M. D. Bispo, A. R. T. Cardoso, M. V. Migliorini, T. Schena, M. C. V. Decampos, M. E. Machado, J. A. Lopez, L. C. Krause and E. B. Caramao, J. Agric. Food Chem., 2013, 61, 6812–6821 CrossRef CAS PubMed.
- P. T. Williams and D. T. Taylor, Fuel, 1993, 72, 1469–1474 CrossRef CAS.
- P. T. Williams, Waste Manag., 2013, 33, 1714–1728 CrossRef CAS PubMed.
- R. Chakravarthy, C. Acharya, A. Savalia, G. N. Naik, A. K. Das, C. Saravanan, A. Verma and K. B. Gudasi, Energy Fuels, 2018, 32, 3760–3774 CrossRef CAS.
- M. Policella, Z. Wang, K. G. Burra and A. K. Gupta, Appl. Energy, 2019, 254, 113–678 CrossRef.
- M. A. Walacik and A. Piętak, J. Kones, 2016, 23, 25–30 Search PubMed.
- J. B. F. Lloyd, Analyst, 1975, 100, 82–95 RSC.
- B. Ashok, A. K. Jeevanantham, K. Nanthagopal, B. Saravanan, M. Senthil Kumar, A. Johny, A. Mohan, M. U. Kaisan and S. Abubakar, Energy, 2019, 173, 290–305 CrossRef CAS.
- S. Hariharan, S. Murugan and G. Nagarajan, Fuel, 2013, 104, 109–115 CrossRef CAS.
- P. Verma, A. Zare, M. Jafari, T. A. Bodisco, T. Rainey, Z. D. Ristovski and R. J. Brown, Sci. Rep., 2018, 8, 1–13 Search PubMed.
- A. K. Wamankar and S. Murugan, Fuel Process. Technol., 2014, 125, 258–266 CrossRef CAS.
- K. Tudu, S. Murugan and S. K. Patel, J. Energy Inst., 2016, 89, 525–535 CrossRef CAS.
- C. Ilkilic and H. Aydin, Fuel Process. Technol., 2011, 92, 1129–1135 CrossRef CAS.
- A. Uyumaz, B. Aydogan, H. Solmaz, E. Yilmaz, D. Yesim Hopa, T. Aksoy Bahtli, O. Solamz and F. Aksoy, J. Energy Inst., 2019, 92, 1406–1418 CrossRef CAS.
- M. Odaka, N. Koike, Y. Tsukamoto, K. Narusawa and K. Yoshida, Presented in International Conference and Exhibition, Michigan, Februvary, 1991 Search PubMed.
- A. Atmanli and N. Yilmaz, Fuel, 2018, 234, 161–169 CrossRef CAS.
- H. Joshi, B. R. Moser, J. Toler, W. F. Smith and T. Walker, Ethyl levulinate: a potential bio-based diluent for biodiesel which improves cold flow properties, Biomass Bioenergy, 2011, 35, 3262–3266 CrossRef CAS.
- N. Yilmaz and A. Atmanli, Fuel, 2017, 210, 75–82 CrossRef CAS.
- B. Rajesh Kumar and S. Saravanan, Fuel, 2015, 160, 217–226 CrossRef CAS.
- T. Lei, Z. Wang, X. Chang, L. Lin, X. Yan, Y. Sun, X. Shi, X. He and J. Zhu, Energy, 2016, 95, 29–40 CrossRef CAS.
- Z. Wang, T. Lei, L. Liu, J. Zhu, X. He and Z. Li, BioResources, 2012, 7, 5972–5982 Search PubMed.
- E. Kovisto, N. Ladommatos and M. Gold, Energy Fuels, 2015, 29, 5875–5884 CrossRef.
- K. C. Corkwell, M. M. Jackson, and D. T. Daly, Presented at Power train and Fluid systems Conference and Exhibition, October, 2003 Search PubMed.
- K. Tudu, S. Murugan and S. K. Patel, Energy Procedia, 2014, 54, 615–626 CrossRef CAS.
- J. Pullen and K. Saeed, Energy, 2014, 72, 1–16 CrossRef CAS.
- M. N. Islam and M. R. Nahian, J. Renewable Energy, 2016, 5137247 Search PubMed.
- L. Prasad, S. Pradhan, L. M. Das and S. N. Naik, Appl. Energy, 2012, 93, 245–250 CrossRef CAS.
- M. Tian, R. L. Mccormick, J. Luecke, E. Dejong, J. C. Vanderwaal, G. P. M. Vanklink and M. D. Boot, Fuel, 2017, 202, 414–425 CrossRef CAS.
- S. Thion, A. M. Zaras, M. Szori and P. Pagut, Phy. Chem. Phy., 2015, 17, 23384–23391 RSC.
- D. Unlu, N. Boss, O. Ilgen and N. Hilmioglu, Open Chem., 2018, 16, 647–652 CAS.
Footnote |
| † Electronic supplementary information (ESI) available. See DOI: 10.1039/d0ra08803j |
| This journal is © The Royal Society of Chemistry 2021 |

