 Open Access Article
Exploration of CH⋯F & CF⋯H mediated supramolecular arrangements into fluorinated terphenyls and theoretical prediction of their third-order nonlinear optical response†
Muhammad Adeel‡
*a,
Muhammad Khalid‡ *b,
Malik Aman Ullaha,
Shabbir Muhammad
 cd,
Muhammad Usman Khan
 ef,
Muhammad Nawaz Tahirg,
Ilham Khana,
Muhammad Asgharh and
Khawar Shahzad Mughalb
aInstitute of Chemical Sciences, Gomal University, Dera Ismail Khan, Khyber Pukhtunkhwa, Pakistan. E-mail: madeel@gu.edu.pk
bDepartment of Chemistry, Khwaja Fareed University of Engineering & Information Technology, Rahim Yar Khan-64200, Pakistan. E-mail: khalid@iq.usp.br; muhammad.khalid@kfueit.edu.pk
cDepartment of Physics, College of Science, King Khalid University, P.O. Box 9004, Abha 61413, Saudi Arabia
dResearch Center for Advanced Material Science (RCAMS), King Khalid University, P.O. Box 9004, Abha 61413, Saudi Arabia
eDepartment of Chemistry, University of Okara, Okara-56300, Pakistan
fDepartment of Applied Chemistry, Government College University, Faisalabad-38000, Pakistan
gDepartment of Physics, University of Sargodha, Sargodha, Punjab, Pakistan
hDepartment of Physics, Khwaja Fareed University of Engineering & Information Technology, Rahim Yar Khan-64200, Pakistan
First published on 17th February 2021
Abstract
In the present study, three novel fluorinated terphenyl compounds i.e., 2′,4,4′′,5′-tetrafluoro-1,1':4′,1′′-terphenyl (1), 2′,5′-difluoro-1,1':4′,1′′-terphenyl (2) and 2′,5′-difluro-4,4′′-diphenoxy-1,1:4′,1′′-terphenyl (3) have been synthesized by Suzuki Miyaura method. Single crystal XRD study reveals ð-ð stacking stabilization in molecular packing along with F⋯H and F⋯C interactions. This computational quantum chemical exploration was also done by using density functional theory (DFT) methods. The comparison of experimental (SC-XRD) and theoretical (DFT) investigations on structural parameters have been reported which shows reasonable agreements. Hirshfeld surface analysis explores the strength of intermolecular interactions present in the synthesized compounds. A substantial computational analysis of synthesized compounds is done for their optoelectronic and third-order nonlinear optical properties. The third-order NLO study was performed at M06/6-311G* level of theory. A comparative analysis of third-order polarizability of studied compounds is done with that of para-nitroaniline (p-NA) molecule which is often considered as a prototype NLO molecule. The third-order NLO analysis results suggest that all investigated compounds 1, 2 and 3 have significant potential as efficient third-order NLO molecules as compared to p-NA. The studied compounds 1, 2 and 3 possess about 13.7 times, 5.2 times and 5.17 times larger third-order polarizability amplitudes than that of p-NA (25.45 × 10−36 esu) as calculated at same M06/6-311G* levels of theory. Time-dependent density functional theory (TD-DFT) calculations are performed for electronic excitation energies and their oscillator strengths. The studies of frontier molecular orbitals (FMO) analysis, total and partial density of states (DOS) were performed to investigate the intramolecular charge transfer (ICT) process in the entitled compounds.
Introduction
In recent years, the demand and production of innovative nonlinear optical materials (NLO) has increased significantly due to their wide spread application in optoelectronic and photonics.1–4 The wide range applicability of NLO material is attributed to their fascinating photo-physical behavior upon exposure to intense laser light.5–7 Among all the materials explored for NLO properties, the synthetic organic compounds got enormous contemporary attention due to their speedy response time, greater laser damage threshold, higher photoelectric coefficients, lower dielectric constants, versatility of design and low-cost development.8–11The NLO related properties of organic compounds arise due to strong intramolecular charge transfer (ICT) which originates from a delocalized π-electron framework or a π-conjugated linker between electron donor and acceptor group, generating a push–pull system.12 This push–pull system containing π-conjugated organic compounds have emerged as an attractive class of third-order NLO materials due to their potentially broad third-order susceptibilities associated with short turnaround time.13–15 The third-order NLO response plays a chief role in recent time automated applications. Generally, third-order NLO polarizability is regarded as sign of two photon absorption (TPA).16 Kamath et al. synthesized a range of new chalcones containing terphenyl which demonstrated third order NLO and optical power limiting activity due to two-photon absorption.17
Terphenyls are aromatic non-planar structures residing of three phenyl rings chain connected by single bonds. Due to π-conjugated system, terphenyl derivatives and fluorinated terphenyle demonstrate distinctive electronic, optical and bioactive properties.18–30 The synthesis of terphenyl and fluorinated terphenyls derivatives have been a blooming topic of research due to their wide range of application in drug discovery and material sciences.31 Several methods and strategies have been established in this regard, but the most general and productive method among them is palladium-catalyzed Suzuki Miyaura coupling method.
Due to limited literature available regarding to the third-order NLO properties of terphenyls, herein this research work, the synthesis of three novel centrosymmetric fluorinated terphenyl compounds i.e. 2′,4,4′′,5′-tetrafluoro-1,1':4′,1′′-terphenyl (1), 2′,5′-difluoro-1,1':4′,1′′-terphenyl (2) and 2′,5′-difluro-4,4′′-diphenoxy-1,1:4′,1′′-terphenyl (3) has been reported through Suzuki Miyaura coupling approach having potential for third-order NLO response. The centrosymmetric crystal groups of all the synthesized compounds prevent any use in second-order NLO applications because compounds with centrosymmetric crystal groups do not show NLO response at bulk-levels.
Experimental and instrumentation
General scheme of synthesis and instrumentation
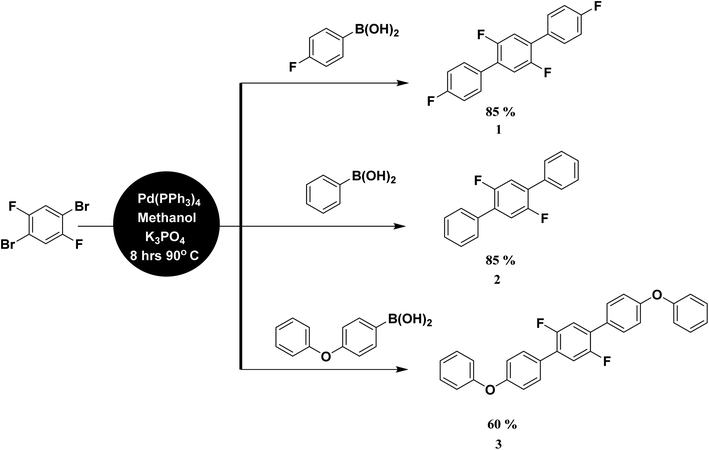
Analytical grade chemicals (Merck®, Acros®, and Aldrich®) and commercial grade solvent were purchased, which were distilled prior to use. The starting material, 1,4-dibromo-2,5-difluorobenzene was treated with three different aryl boronic acids under Suzuki Miyaura condition in the presence of Pd(PPh3)4 catalyst, K3PO4 base and methanol suspension on a magnetic hot plate for about 8 hours at 90–100 °C (Scheme 1). The general catalytic mechanism completed in three steps i.e., oxidative addition, transmetallation and reductive elemination (Scheme S1†). The product formation was monitored by thin layer chromatography (TLC) followed by purification process through column chromatography. Ethyl acetate/hexane mixture was used as a solvent front and eluting system in both cases. The compounds were further characterized by spectroscopic techniques. For melting point quantification, Stuart, SMP10 (England) device was used. Bruker Kappa APEX-2 Diffractometer was used with CCD-Kamera (MoKα and graphite monochromator, = 0.71073 Å) for SC-XRD (Fig. 1–7). For NMR spectra, Bruker-Advance 300 MHz spectrometer was used with operating frequency 300 MHz for proton and 75.47 MHz for carbon. IR spectra were determined by Prestige-21 SHIMADZU Japan FTIR spectrophotometer. UV spectra were recorded on Shimadzu UV 1601 UV/Vis double beam spectrophotometer.Synthesis of 2′,4,4′′,5′-tetrafluoro-1,1':4′,1′′-terphenyl (1)
Starting with 4-fluorolphenyl boronic acid (0.113 g, 0.8092 mmol), 1,4-dibromo-2,5-difluorobenzene (0.100 g, 0.3678 mmol), K3PO4 (0.234 g, 0.233 mmol), Pd (PPh3)4 (3 mol%, 0.013 mg), in a 5 ml suspension of methanol, crystalline solid compound 1 (94 g) was synthesized and isolated with m.p 184–186 °C and yield 85%; UV λmax (CHCl3)/nm 339 (0.051A) (Fig. S7†). 1H NMR (300 MHz, CDCl3):δ = 7.70–7.65 (m, 4H, ArH), 7.59–7.57 (m, 2H, ArH), 7.27–7.23 (m, 4H, ArH), (Fig. S1†); 13C NMR (75 MHz, DMSO-d6): δ = 161.80, 151.03, 132.16, 131.81 (C), 131.20,118.41, 116.01 (Ar-CH) (Fig. S2†); IR (KBr): ν = 1610 (w), 1525 (s), 1479 (m), 1392 (m), 1234 (br), 1163 (m), 1018 (w), 883 (m), 829 (m), 779 (s), 623 (w) cm−1.Synthesis of 2′,5′-difluoro-1,1':4′,1′′-terphenyl (2)
Starting with phenyl boronic acid (0.098 mg, 0.809 mmol), 1, 4-dibromo-2, 5-difluorobenzene (0.100 g, 0.3678 mmol), K3PO4 (0.234 g, 0.233 mmol), Pd (PPh3)4 (3 mol%, 0.013 mg), in a 5 ml suspension of methanol, the compound 2 was synthesized as a light brown solid (94 mg) with m.p 158–160 °C and yield 85%; UV λmax (CHCl3)/nm 326 (0.508A) (Fig. S8†). 1H NMR (300 MHz, CDCl3): δ = 7.58–7.56 (m, 2H, ArH), 7.36–7.23 (m, 10H, ArH) (Fig. S3†); 13C NMR (75 MHz, DMSO-d6): δ = 154.80, 136.61, 131.82, (C), 129.21, 127.80, 127.61, 118.44, (Ar-CH) (Fig. S4†); IR (KBr): ν = 2918 (w), 1916 (w), 1615 (w), 1571 (w), 1545 (w), 1485 (w), 1391 (w), 1120 (M), 1137 (m), 1045 (m), 1005 (w), 947 (w), 892 (w), 845 (w), 810 (w), 735 (w), 557 (m).Synthesis of 2′, 5′-difluro-4,4′′-diphenoxy-1,1:4′,1′′-terphenyl (3)
Starting with 4-phenoxyphenyl boronic acid (0.173 g, 0.809 mmol), 1,4-dibromo-2,5-difluorobenzene (0.100 g, 0.3678 mmol), K3PO4 (0.234 g, 0.233 mmol), Pd (PPh3)4 (3 mol%, 0.013 mg), in a 5 ml suspension of methanol, the crystalline solid compound 3 (99 mg) was synthesized with m.p 188 to 180 °C and yield 60%; UV λmax (CHCl3)/nm 343(1.70A) (Fig. S9†). 1H NMR (300 MHz, CDCl3): δ = 7.68–7.66 (m, 6H,Ar-H), 7.60–7.58 (m, 4H,Ar-H), 7.50–7.48 (m, 4H, Ar-H), 7.40–7.37 (t, 2H, Ar-H, J = 6.00 Hz), 7.27–7.23 (m, 4H, Ar-H) (Fig. S5†); 13C-NMR (75 MHz, DMSO-d6): δ = 157.00, 155.90, 154.81, 131.11, 129.21, (C) 128.42, 121.82, 118.91, 118.40, 118.01(Ar-CH) (Fig. S6†); IR (KBr): ν = 1587 (m), 1479 (s), 1394 (w), 1230 (s), 1165 (s), 1118 (w), 889 (w), 806 (w), 785 (s), 752 (m), 690 (m), cm−1.Computational procedure
All the quantum chemical calculations in the present investigation were performed using Gaussian 16 suit of programs.32 The geometry optimizations were performed using B3LYP with 6-311G* basis set.33,34 The B3LYP functional is the most commonly used functional to optimize the molecular geometries for the purpose of their comparison with relevant experimental results or in combined experimental and computational studies.35 The optimized geometries are compared with their respective experimental single crystal geometries, which showed a reasonable agreement among each other. For the calculation of linear polarizability and third-order nonlinear optical (NLO) polarizability, we used M06 functional with same 6-311G* basis set because B3LYP has been reported to overestimate the hyperpolarizabilities.36,37 The M06 is more recently developed functional from Minnesota group of functionals as designed by Zhao and Truhlar et al.38 The M06 has used to calculate NLO properties of several organic compounds. For the calculation of linear and NLO polarizabilities, we used finite field (FF) method which was originally developed by Kurtz et al.39 In FF method, a static electric field is applied and NLO response properties compounds were calculated by differentiating total energy or dipole moment with respect to applied field. The details of FF methods can be found in our previous full computational studies.40,41 For linear isotropic polarizability, the following equation was used:
 | (1) |
For anisotropy of linear polarizability (Δα), the following equation is used:
 | (2) |
Similarly, for average γ third-order polarizability:
 | (3) |
Under the Kleinmann symmetry, the above tensors are reduced to six components at least for static second hyperpolarizability.
 | (4) |
All the individual components of polarizability and NLO optical hyperpolarizability were obtained from Gaussian 16 suit of programs.
Results and discussion
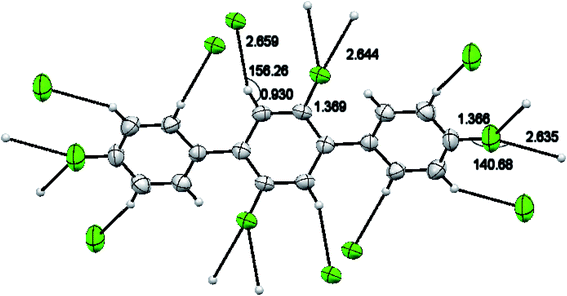
A light brown needle like crystal of the synthesized compound 2′,4,4′′,5′-tetrafluoro-1,1':4′,1′′-terphenyl (1) C18H10F4 was selected to get the single crystal XRD data. The approximate dimensions of crystal having triclinic system were found as 0.340 × 0.150 × 0.120 mm3. The volume of crystal was 334.63(9) Å3. The two 4-fluoro benzene rings coupled to middle difluoro benzene ring are a bit twisted and not planar as torsion angle value of 44.1(4) ° is observed for bonds C2–C1–C7–C8. The bond length 1.492(4) Å for newly coupled C7–C1 is observed. The bond lengths 1.367(4) Å and 1.369(3) Å for bonds F1–C4 and F2–C8 were measured respectively. For C2–C1–C7 an angle of 122.0(3)°, for F2–C8–C7 an angle of 119.0(3) ° and for F1–C4–C3 an angle 118.2(3)° is observed. There is CH⋯F and CF⋯H interactions found in 1 as shown in Fig. 3. For bonds C9H9⋯F2; the bond length for C9–H9 is 0.930 Å and 2.659 Å for weak interaction of H9⋯F2 and bond angle for C9H9⋯F2 is 159.26°. For bonds C8F2⋯H9; the bond length for C8–F2 is 1.369 Å and 2.659 Å for weak interaction of H9⋯F2 and bond angle for C8F2⋯H9 is 138.14°. For bonds C4F1⋯H5; the bond angle is 140.68° and the bond lengths for C4–F1 and F1⋯H5 are 1.366 Å and 2.635 Å respectively. Different crystal parameters, refinement, bond angles and data collection are described in Table 1.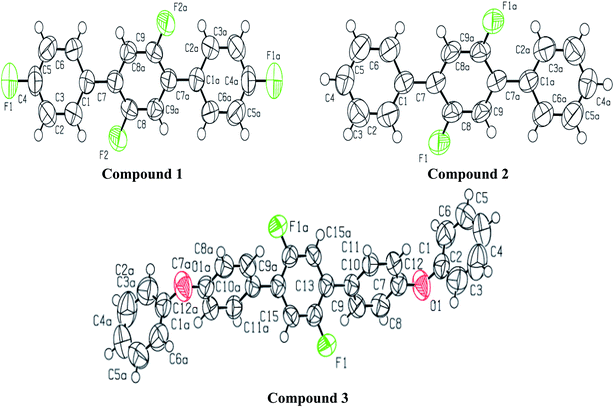 | ||
| Fig. 1 ORTEP diagram of compound 1, 2 and 3 showing the atom-labeling scheme. Displacement ellipsoids are drawn at the 50% probability level. Symmetry code: (a) 1 − x, 1 − y, −z. | ||
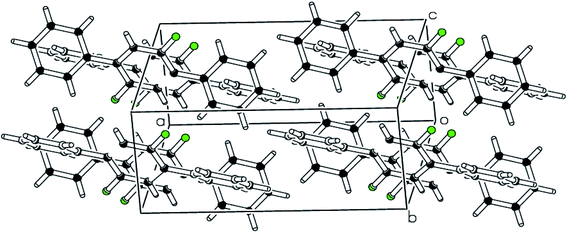 | ||
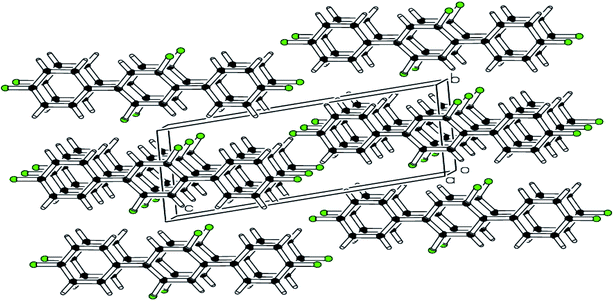
| Fig. 4 pi–pi stacking along a-axis stabilizing the molecules is shown in packing diagram compound 2. | ||
| Crystal parameters | 1 | 2 | 3 |
|---|---|---|---|
| a Computer programs: APEX2 (Bruker, 2007), SAINT (Bruker, 2007), SHELXS97 (Sheldrick, 2008), SHELXL2014/6 (Sheldrick, 2015), ORTEP-3 for Windows (Farrugia, 1997) and PLATON (Spek, 2009), WinGX (Farrugia, 1999) and PLATON (Spek, 2009). | |||
| CCDC # | 2025097 | 2025098 | 2025099 |
| Chemical formula | C18H10F4 | C18H12F2 | C30H20F2O2 |
| Mr | 302.26 | 266.28 | 450.46 |
| Crystalsystem, space group | Triclinic, P![[1 with combining macron]](https://www.rsc.org/images/entities/char_0031_0304.gif) |
Monoclinic, P21/c | Monoclinic, P21/n |
| Temperature (K) | 296 | 296 | 296 |
| a, b, c (Å) | 3.8023(6), 6.1680(10), 14.583(2) | 13.5172 (12), 7.2166 (5), 6.7331 (6) | 13.5116(9), 5.8650(4), 14.3546(10) |
| á, â, ã (°) | á = 98.324(10) | á = 90 | á = 90 |
| â = 95.514(9) | â = 96.411 (4) | â = 100.463(4) | |
| ã = 95.661(9) | ã = 90) | ã = 90 | |
| V (Å3) | 334.63(9) | 652.69 (9) | 1118.62(13) |
| Z | 1 | 4 | 2 |
| Radiation type | Mo Kα | Mo Kα | Mo Kα |
| μ (mm−1) | 0.125 | 0.10 | 0.09 |
| Crystal size (mm) | 0.340 × 0.150 × 0.120 | 0.32 × 0.22 × 0.20 | 0.42 × 0.28 × 0.22 |
| Data collection | |||
| Diffractometer | Bruker Kappa APEXII CCD | Bruker Kappa APEXII CCD | Bruker Kappa APEXII CCD |
| Absorption correction | Multi-scan (SADABS; Bruker, 2005) | Multi-scan (SADABS; Bruker, 2005) | Multi-scan (SADABS; Bruker, 2005) |
| Tmin, Tmax | 0.973, 0.982 | 0.966, 0.974 | 0.965, 0.978 |
| No. of measured, independent and observed [I > 2σ(I)] reflections | 1300, 1300, 793 | 5080, 1287, 913 | 6647, 2186, 1556 |
| Rint | 0.000 | 0.035 | 0.051 |
(sin![[thin space (1/6-em)]](https://www.rsc.org/images/entities/char_2009.gif) θ/λ)max (Å−1) θ/λ)max (Å−1) |
0.617 | 0.617 | 0.617 |
| Refinement | |||
| R[F2 > 2σ(F2)], wR(F2), S | 0.052, 0.131, 1.09 | 0.075, 0.227, 1.06 | 0.065, 0.191, 1.38 |
| No. of reflections | 2367 | 1287 | 2186 |
| No. of parameters | 148 | 91 | 155 |
| H-atom treatment | H-atom parameters constrained | H-atom parameters constrained | H-atom parameters constrained |
| Δρmax, Δρmin (e Å−3) | 0.23, −0.20 | 0.66, −0.21 | 0.21, −0.23 |
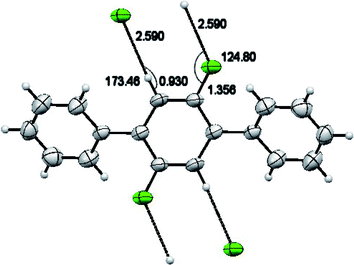
For synthesized compound 2′,5′-difluoro-1,1':4′,1′′-terphenyl (2) having molecular formula C18H12F2 and F. W = 266.28, a suitable crystal having light brown color was selected. The estimated size of selected crystal was 0.320 × 0.220 × 0.200 mm3 and measured volume was 652.69(9) Å3. The monoclinic crystal system with P21/c was observed for compound 2 with cell dimensions as [a = 13.517(12) Å, b = 7.21(5) Å, c = 6.7331(6) Å], [α = 90°, β = 96.41(4)° and γ = 90°]. For Z = 2 and, 1.355 mg m−3 is the calculated density. 5080 total measured reflections and 1287 unique reflections [R(int) = 0.0346] were utilized to calculate XRD data. μ = 0.097 cm −1 is the linear absorption coefficient. The maximum and minimum peaks and holes are 0.66 and −0.21 e Å−3, respectively. For bonds C2–C1–C7–C8 torsion angle value of 39.7(3)° predicts that the two aryl rings attached to middle difluoro benzene ring are a bit twisted. For C1–C7 the bond length is 1.489(3) Å. For F1–C8 and C8–C9 the bond lengths are 1.357(2) Å and 1.370(3) Å respectively. Angles of 122.43(19)°, 124.0(2)° and 120.9(2)° were observed for bonds C2–C1–C7, C8–C7–C1 and F1–C9–C7–C1 respectively. There is CH⋯F and CF…H interactions found in compound 2 as shown in Fig. 5. For bonds C8F1⋯H9; the bond angle is 124.80° and the bond lengths for C8–F1 and F1⋯H9 are 1.356 Å and 2.590 Å respectively. Different crystal parameters, refinement, bond angles and data collection are described in Table 1.
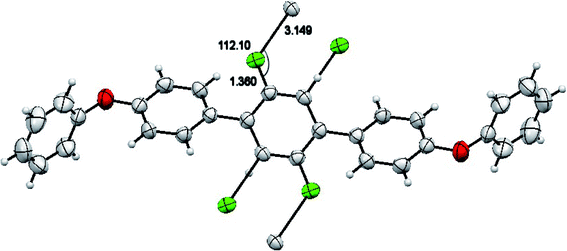
The molecules of 2′,5′-difluro-4,4′′-diphenoxy-1,1:4′,1′′-terphenyl (3) are symmetric. The symmetry in 3 molecules is due to a mirror plane passing through C15 and C15a atoms in the middle difluro benzene. The compound 3 molecule can be divided into three parts i.e. (i) A = the phenoxy group (PhO) (C1–C6/O1), (ii) B = phenyl group (Ph) (C7–C12) and (iii) C = difluoro benzene ring (C13–C15/C13a–C15a/F1/F1a) are not planar as they are a bit twisted. The dihedral angle between A and B is 89.93(5)°, A and C is 63.50(8)°, and B and C is 50.45(6)°. No classical H-bonds were observed in 3 molecules. The stability of compound 3 is due to F–C–F⋯π and π⋯π interactions. There is CF…C interactions found in compound 3 as shown in Fig. 7. For bonds C14–F1⋯C15; the bond angle is 112.10° and the bond lengths for C14–F1 and F1⋯C15 are 1.360 Å and 3.149 Å respectively. The packing diagram is shown in Fig. 6.
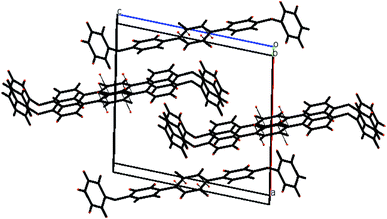 | ||
| Fig. 6 The packing diagram shows that molecules are stacked with pi–pi interaction along the a-axis of compound 3. | ||
Hirshfeld analysis
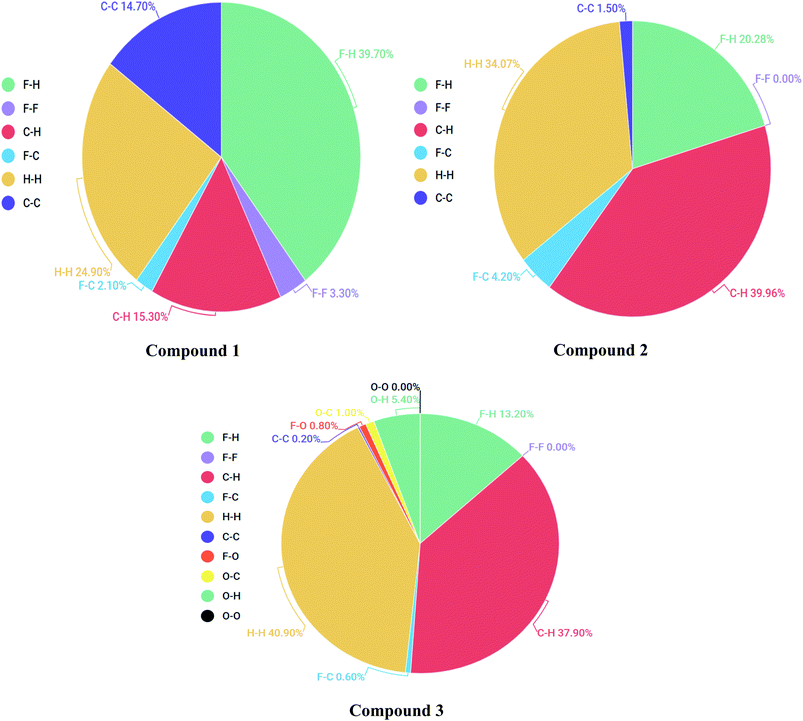
Each point of the Hirshfeld surface contained two kinds of critical distances viz de and di, these were the distances from that point to the adjacent nucleus, outward and inward to the surface of molecule respectively.42,43 Hirshfeld surface analysis for 1, 2 and 3 was done to estimate the strength of intermolecular interactions. The Hirshfeld surface structure for compounds 1, 2 and 3 are arranged in Fig. 8(A–C) respectively. According to Hirshfeldnorm displayed a surface plot, red, white and blue colours indicated strongest, intermediate and weakest intermolecular interactions respectively.44,452-Dimensional fingerprint plots were helpful to evaluate intermolecular interactions in regard to measuring individual participation of each intermolecular interaction present in the structure.46 The individual intermolecular interactions of compounds are plotted in Fig. 9. Percentage intermolecular contributions of different inter-atomic associations of compounds 1, 2 and 3 surfaces are also shown in Fig. 9.
Moreover, in the figures percentage contributions in the Hirshfeld surface concerning the outsider atoms clarifies and explain its role in crystal packing.
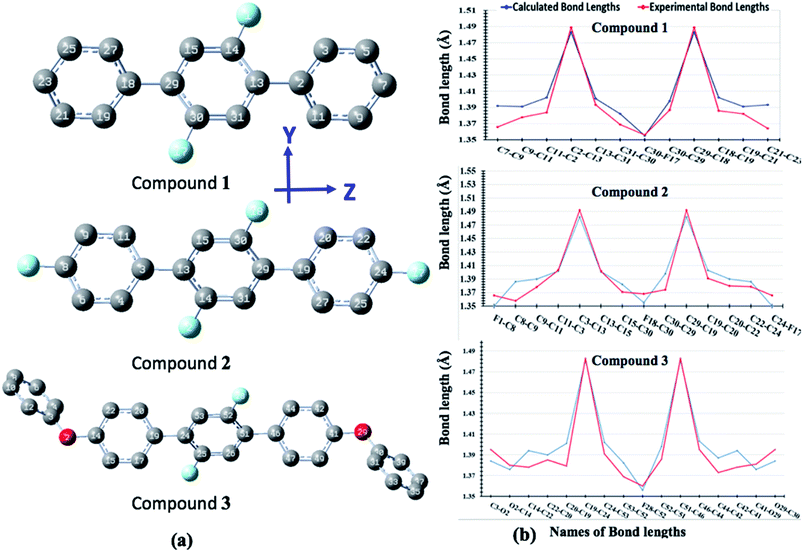
Geometric parameters
The optimized geometrical parameters are compared with their single crystal counterparts for compounds 1, 2 and 3. To make geometry comparison more comprehensive, we have done the comparative analysis of important bond lengths in graphical illustration as shown in Fig. 10. The Fig. 10 shows that there is reasonably good agreement between calculated and experimental bond lengths. The bond lengths of all compounds are drawn graphical for one half only because their geometries are symmetrically arranged. The study of torsion angles shows that for compound 1 its central core difluoro-benzene ring is found somewhat non-planer to the terminal benzene rings with their calculated and experimental torsion angles (C11–C12–C13–C14) of 40.15° and 37.69°, respectively. Similar, non-planarity were also found between central core difluoro-benzene ring and their terminal groups for compounds 2 (C30–C29–C19–C30) and 3 (C44–C45–C51–C52) with their calculated (experimental) torsion angles of 40.84°(40.53°) and 41.30°(50.12°), respectively. The variations in the calculated and experimental torsion angles of compound 3 are probably due to the gas phase and solid-state geometries where larger systems cause more torsional compressions in under high pressure solid-state.Average linear polarizability
The polarizability shows the capacity of a molecule to retort to an electric field and to attain an electric dipole moment.47 It is noteworthy that linear polarizability also plays an important role in turning the optical activity of a compound. Therefore, average linear polarizability of compounds 1, 2 and 3 are calculated at M06/6-311G* level of theory and collected in Table 2. We have calculated two types of average linear polarizabilities including isotropic (αiso) and anisotropic (αaniso) linear polarizabilities along with their individual components.| α components | 1 | 2 | 3 |
|---|---|---|---|
| áxx | 32.20 | 18.37 | 49.70 |
| áxy | 8.846 | 7.197 | 59.49 |
| áyy | 22.05 | 38.62 | 95.57 |
| áxz | −0.312 | −5.412 | −8.453 |
| áyz | −0.154 | −4.959 | 23.82 |
| ázz | 63.47 | 60.05 | 95.57 |
| áiso | 39.24 | 39.01 | 68.25 |
| áaniso | 40.41 | 40.25 | 60.58 |
Results mentioned in Table 2 reveal that individual polarizability component along z direction (αzz) contribute maximally to the average polarizability in contrast to other component along x and y directions owing to the direction of ICT along z-axis. The compound 3 has the highest value of total isotropic linear polarizability 68.25 × 10⁻²⁴ esu among all studied compounds. The average isotropic polarizability value is found almost similar as 39.24 × 10⁻²⁴ esu and 39.01 × 10⁻²⁴ esu in compounds 1 and 2 respectively. The similar behavior is noticed in case of average anisotropic polarizability values of investigated compounds 1, 2 and 3 where the differences among isotropic and anisotropic linear polarizabilities are found to be 1.17 × 10⁻²⁴ esu, 1.24 × 10⁻²⁴ esu and 7.67 × 10⁻²⁴ esu, respectively for compounds 1, 2 and 3 which indicates that direction of applied electric field does not influence the polarization process in our studied compounds.
Third-order NLO polarizability
The third-order NLO polarizability plays an important role in modern days hi-tech applications. All optical switching and computing possess a fundamental process of optically-induced change in refractive index caused by third-order NLO phenomena.48 Usually, third-order NLO polarizability is also considered as signature of two photon absorption (TPA).49 The third-order nonlinear polarizabilities of compounds 1, 2, and 3 at M06 level of theory in conjunction with 6-311G* basis set. The calculated third-order nonlinear polarizability values along with individual tensors of investigated compounds 1, 2 and 3 are given in Table 3.| γ | 1 | 2 | 3 | p-NA |
|---|---|---|---|---|
| a The η is ratio of 〈γ〉 amplitudes of each compound with 〈γ〉 of p-NA. | ||||
| γxxxx | 8.883 | 1.947 | 16.01 | 0.13 |
| γyyyy | 4.091 | 14.13 | 189.6 | 6.87 |
| γzzzz | 642.0 | 511.6 | 724.0 | 128.4 |
| γxxyy | 2.684 | 14.49 | 9.046 | 0.38 |
| γxxzz | −2.395 | 54.21 | 22.13 | 1.81 |
| γyyzz | −1.370 | 38.07 | 375.6 | −6.29 |
| 〈γ〉 | 131.6 | 134.6 | 348.7 | 25.45 |
| ηa | 5.17 | 5.20 | 13.70 | 1 |
It is evident from results collected in Table 3 that compound 3 has the largest average third-order NLO polarizability amplitude of 348.7 × 10−36 esu, while the lowest 〈γ〉 amplitude is calculated for compound 1 which is 131.6 × 10−36 esu among all studied molecules. A comparison analysis of investigated molecules indicates that the 〈γ〉 amplitude of compound 3 is 2.65 times larger than compound 1 and 2.59 times larger than compound 2. We also compared the γ results of compounds 1, 2 and 3 with para-nitroaniline (p-NA) at same level of theory. The comparison of third-order polarizability value with standard prototype NLO molecule p-NA is indicated by η (which is a ration between 〈γ〉 amplitude of studied compound to that the 〈γ〉 amplitude of p-NA) in Table 3. A careful analysis of Table 3 shows that studied compounds 1, 2 and 3 have 13.7 times, 5.2 times and 5.17 times larger third-order polarizability value than p-NA value 25.45 × 10−36 esu as calculated at same M06/6-311G* levels of theory. The decreasing order of 〈γ〉 amplitudes for all studied compounds is found as: 3 > 1 > 2. The p-NA molecule comparative analysis and third-order polarizability results suggest that all investigated compounds are good candidates for NLO response properties and associated applications. The NLO analysis confirmed that all studied compounds have significant NLO properties as compared to prototype standard compound which revealed their potential for technology related NLO applications.
Original of third order NLO
The origin of third order NLO is usually unveil independently by using a rough approximation which directly express the value of longitudinal γL. In order to trace the origin of higher-order NLO polarizability, we have executed TD-DFT computations to get a better understanding about the structure-NLO property relationship. By considering the renowned three-level approximations,50 the spectroscopic parameters are applied to understand the origin of higher-order NLO responses of the symmetric and asymmetric compounds.
 | (5) |
| Comp. | ΔE (eV) | fo | MO contributions |
|---|---|---|---|
| 1 | 4.23 | 0.97 | HOMO → LUMO (96%) |
| 2 | 4.21 | 0.97 | HOMO → LUMO (96%) |
| 3 | 3.95 | 1.49 | HOMO → LUMO (96%) |
The computed TD-DFT results of compound 1 exhibited transition energy of 4.23 eV with oscillating strength of 0.97. Similarly, the transition energy and f of compounds 2 and 3 are found to be 4.21, 3.95 eV and oscillator strengths are found to be 0.97 and 1.49, respectively. It is seen that compound 3 has larger oscillator strength and lower transition energy that results in larger amplitude of γ in compound 3 as compared with compounds 1 and 2. Thus, the parameters of three-level approximation including transition energy and oscillator strengths were also found in line with trend ofγ amplitudes as calculated by FF method.
The γ density analysis for third-order NLO polarizability
Nakano et al.,50,51 have suggested and used derivative of electron density for analyzing the spatial contributions of electrons to the third-order NLO polarizability. This 3-D depiction of the electron density derivatives is useful for illustrative spatial roles of electrons and also for revealing the electron correlation properties of higher-order polarizabilities. The γ density, defines the spatial electronic contributions to γiiivalue. The numerical calculation of this γ density is achieved as the third-order derivative of electron density with respect to applied electric field as given in following equation:
 | (6) |
Using this density, γiiiis obtained by
 | (7) |
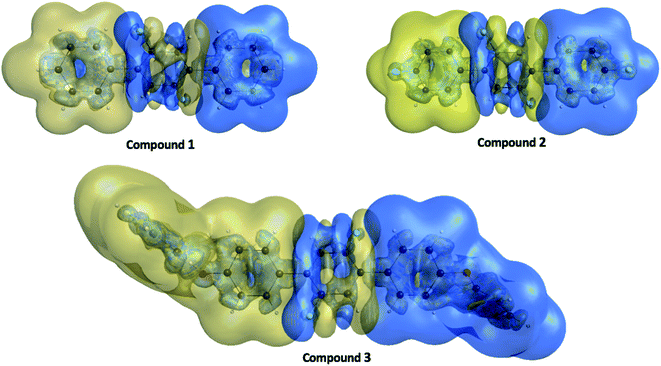 | ||
| Fig. 11 The γ density ρiii(3)(r) distributions for compounds 1, 2 and 3 where the golden and blue meshes represent positive and negative γ densities with iso-surfaces of ±10.00 a. u., respectively. | ||
Frontier molecular orbital (FMO) analysis
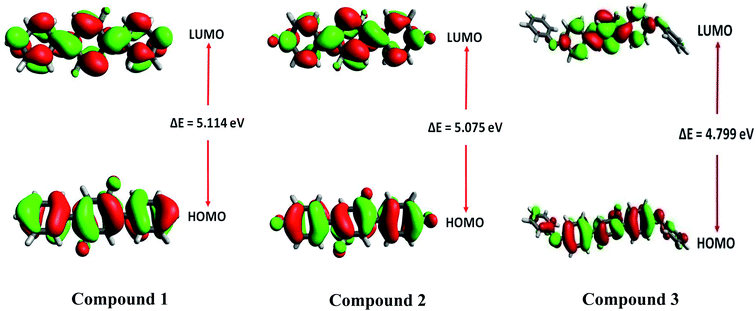
Frontier molecular orbitals (FMOs) analysis offers useful insights like chemical stability, interactions between the atoms, electronic behavior and charge transfer ability of investigated compounds 1, 2 and 3.53,54 The TD-DFT calculations show that HOMO and LUMO are crucial orbitals during intramolecular electronic transition process. The electronic density distributions for HOMO and LUMO orbitals are plotted as 3-D counters and shown in Fig. 12. A careful analysis of HOMO and LUMO orbital distributions in Fig. 12 illustrates that there are middling charge redistributions upon electronic transitions among compounds 1 and 2. While on the other hands, compound 3 indicates a clear intramolecular charge transfer process (from terminal phenyl groups to central core) as seen by the delocalized distributions of its HOMO and LUMO orbitals. The eletronic transition energy of a molecular system significantly depends upon the distribution of its FMOs and their relative energies.55 Moreover, HOMO–LUMO energy gap (EHL = ELUMO − EHOMO) is also used to calculate various global reactivity parameters. Compounds with narrow HOMO–LUMO energy gap is considered highly reactive, soft in nature with least stability.56 Contrarily, a compound enclosing large HOMO–LUMO energy gap is marked hard in nature and less reactive with higher stability.57 The M06/6-311G* level of theory is utilized to gain frontier molecular orbitals of investigated compounds 1–3. The computed results of HOMO and LUMO energies along with energy gaps are collected in Table 5.| Compounds | EHOMO (eV) | ELUMO (eV) | ΔEHL (eV) |
|---|---|---|---|
| 1 | −6.572 | −1.458 | 5.114 |
| 2 | −6.681 | −1.606 | 5.075 |
| 3 | −6.187 | −1.388 | 4.799 |
The energy gap values of investigated compounds 1, 2 are 3 are found close to each other with only a little difference of 0.039 eV. However, the smallest energy gap value among all investigated compounds 1–3 is found in the case of 3 with ΔEHL value of 4.799 eV. Overall, increasing order of ΔEHL is noticed as: 3 (4.799 eV) < 2 (5.075 eV) < 1 (5.114 eV). The 3-D pictorial representation of HOMO and LUMO of investigated molecules is shown in Fig. 12.
Density of states (DOS)
For the determination of contributions of electronic states of each fragment to overall molecular system, we have calculated the partial density of state (PDOS) projected to individual fragments and their total density of state (TDOS) for compounds 1, 2 and 3 as given in Fig. 13. We have divided DOS of the compounds 1, 2 and 3 into two fragments i.e. central group and terminal group as shown in Fig. 13. There are more number of states per electron volt in compound 3 as compared to compound 1 and 2 owing to the more number of atoms in compound 3. A careful analysis of Fig. 13 shows that the central core (blue encircled fragment) is same in all the three compounds but its contributions are different in compound 3 as compared to compounds 1 and 2. There is significant contribution of electronic states from the central core in the HOMO and LUMO orbital energy levels in compounds 1 and 2 while on the other hands, for compound 3 its PDOS shows less electronic states in HOMO and more in LUMO orbital energy levels. The trend of PDOS in compound 3 is different because there is clear push–pull configuration in compound 3 where central core is acting as electron pulling moiety while terminal fragments (methoxy-phenyl) are performing as electron pushing moieties. Thus, an intramolecular charge transfer process is envisioned from DOS studies of above entitled compounds.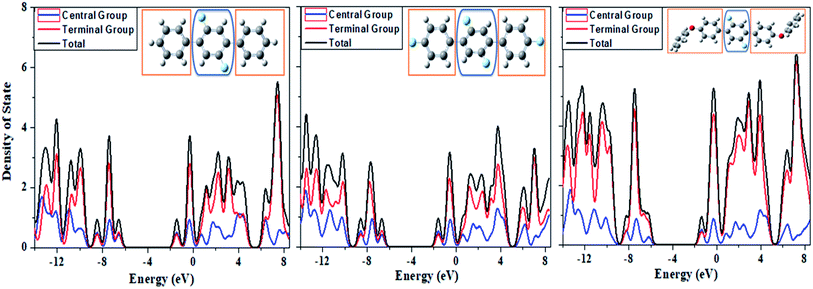 | ||
| Fig. 13 The computed spectra of partial density of state (PDOS) and total density of state (TDOS) for the systems 1, 2 and 3 from left to right, respectively. | ||
Conclusion
Three novel fluorinated terphenyl compounds i.e., 2′,4,4′′,5′-tetrafluoro-1,1':4′,1′′-terphenyl (1), 2′,5′-difluoro-1,1':4′,1′′-terphenyl (2) and 2′,5′-difluro-4,4′′-diphenoxy-1,1:4′,1′′-terphenyl (3) have been synthesized by Suzuki Miyaura approach followed by spectroscopic characterization and single crystal XRD analysis. Additionally, we applied density functional theory (DFT) methods for the calculations of third-order NLO response properties which are crucial indicators for third-harmonic generation and also often perceived as signature of two-photon absorption process. The validity of theoretical computational results has also tested by comparing experimental and computed data for synthesized compounds. The geometrical parameter of experimental SC-XRD results were closely related to optimized geometry DFT result. SC-XRD study revealed the stabilization due to pi–pi stacking in molecular packing along with F⋯H and F⋯C interaction. Hirshfeld Surface analysis explores the strength of intermolecular interactions present in compounds. Time-dependent density functional theory (TD-DFT) calculations were also performed to calculate transition energies of studied compound and the results of transition energies were used to trace the origin of third-order NLO response properties through three-level approximation. The molecular level insights were obtained by analyzing the frontier molecular orbitals (FMO) and DOS plots, which clearly projected intramolecular charge transfer process in the entitled compounds. The entitled compounds especially compound 3 showed a smaller HOMO–LUMO energy gap that suggests enhanced nonlinear optical (NLO) characteristics. To enhance the scope of our findings a semi-quantitative analysis was made by comparing of all investigated compounds with that of p-NA (often considered a prototype NLO molecule) at same methodology level. The compounds 1, 2 and 3 have shown significant NLO properties which are about 13.7 times, 5.2 times and 5.17 times larger than that of p-NA (25.45 × 10−36 esu). Thus, the present investigation highlights not only synthesis compounds 1, 2 and 3 but also highlight their computational exploration as advanced functional materials.Conflicts of interest
There are no conflicts to declare.Acknowledgements
The author from King Khalid University extends his appreciation to Deanship of Scientific Research at King Khalid University for funding the work through Research Project (R.G.P.2/109/41).References
- Z. Peng and L. Yu, Macromolecules, 1994, 27, 2638–2640 CrossRef CAS.
- N. Tsutsumi, M. Morishima and W. Sakai, Macromolecules, 1998, 31, 7764–7769 CrossRef CAS.
- E. M. Breitung, C.-F. Shu and R. J. McMahon, J. Am. Chem. Soc., 2000, 122, 1154–1160 CrossRef CAS.
- C.-C. Chang, C.-L. Pai, W.-C. Chen and S. A. Jenekhe, Thin Solid Films, 2005, 479, 254–260 CrossRef CAS.
- M. G. Papadopoulos, A. J. Sadlej and J. Leszczynski, Non-linear optical properties of matter, Springer, 2006 Search PubMed.
- R. W. Munn and C. Ironside, Principles and applications of nonlinear optical materials, Springer, 1993 Search PubMed.
- K. Rottwitt and P. Tidemand-Lichtenberg, Nonlinear optics: principles and applications, CRC Press, 2014 Search PubMed.
- P. S. Halasyamani and W. Zhang, Inorg. Chem., 2017, 56, 12077–12085 CrossRef CAS.
- B. Zhang, G. Shi, Z. Yang, F. Zhang and S. Pan, Angew. Chem., Int. Ed., 2017, 56, 3916–3919 CrossRef CAS.
- S. Yamashita, J. Lightwave Technol., 2012, 30, 427–447 CAS.
- L. Guo, Z. Guo and X. Li, J. Mater. Sci. Mater. Electron., 2018, 29, 2577–2584 CrossRef CAS.
- R. Mahmood, M. R. S. A. Janjua and S. Jamil, J. Cluster Sci., 2017, 28, 3175–3183 CrossRef CAS.
- P. N. Prasad and D. J. Williams, Introduction to nonlinear optical effects in molecules and polymers, Wiley, New York, 1991 Search PubMed.
- H. Nalwa, S. Miyata and P. A. Fleitz, Opt. Eng., 1997, 36, 2622 CrossRef.
- F. Bureš, D. Cvejn, K. Melánová, L. Beneš, J. Svoboda, V. Zima, O. Pytela, T. Mikysek, Z. Růžičková and I. Kityk, J. Mater. Chem. C, 2016, 4, 468–478 RSC.
- A. Karakas, T. Dag, H. El Ouazzani, K. Sebiaai and Y. Boughaleb, Opt. Quant. Electron., 2014, 46, 165–170 CrossRef CAS.
- L. Kamath, K. Manjunatha, S. Shettigar, G. Umesh, B. Narayana, S. Samshuddin and B. Sarojini, Optic Laser. Technol., 2014, 56, 425–429 CrossRef CAS.
- Y. S. Mary, C. Y. Panicker, B. Narayana, S. Samshuddin, B. Sarojini and C. Van Alsenoy, Spectrochim. Acta, Part A, 2014, 133, 480–488 CrossRef.
- H.-R. Liao, Y.-J. Lin, Y.-M. Chou, F.-T. Luo and B.-C. Wang, J. Lumin., 2008, 128, 1373–1378 CrossRef CAS.
- J. Hou, C. Yang, J. Qiao and Y. Li, Synth. Met., 2005, 150, 297–304 CrossRef CAS.
- K. Colladet, M. Nicolas, L. Goris, L. Lutsen and D. Vanderzande, Thin Solid Films, 2004, 451, 7–11 CrossRef.
- C. D. Dimitrakopoulos and P. R. Malenfant, Adv. Mater., 2002, 14, 99–117 CrossRef CAS.
- R. Friend, R. Gymer, A. Holmes, J. Burroughes, R. Marks, C. Taliani, D. Bradley, D. Dos Santos, J. Bredas and M. Lögdlund, Nature, 1999, 397, 121–128 CrossRef CAS.
- B. A. Reinhardt, L. L. Brott, S. J. Clarson, A. G. Dillard, J. C. Bhatt, R. Kannan, L. Yuan, G. S. He and P. N. Prasad, Chem. Mater., 1998, 10, 1863–1874 CrossRef CAS.
- J.-K. Liu, Chem. Rev., 2006, 106, 2209–2223 CrossRef CAS.
- D. N. Quang, T. Hashimoto, M. Nukada, I. Yamamoto, M. Tanaka and Y. Asakawa, Planta Med., 2003, 69, 1063–1066 CrossRef CAS.
- S.-Z. Tian, X. Pu, G. Luo, L.-X. Zhao, L.-H. Xu, W.-J. Li and Y. Luo, J. Agric. Food Chem., 2013, 61, 3006–3012 CrossRef CAS.
- J. Qiu, B. Zhao, W. Zhong, Y. Shen and H. Lin, Eur. J. Med. Chem., 2015, 94, 427–435 CrossRef CAS.
- A. Kamal, M. K. Reddy, T. B. Shaik, Y. Srikanth, V. S. Reddy, G. B. Kumar and S. V. Kalivendi, Eur. J. Med. Chem., 2012, 50, 9–17 CrossRef CAS.
- A. Parish, S. Gauza, S. T. Wu, J. Dziaduszek and R. Dabrowski, Liq. Cryst., 2008, 35, 79–86 CrossRef CAS.
- A. Parish, S. Gauza, S.-T. Wu, J. Dziaduszek and R. Dabrowski, Mol. Cryst. Liq. Cryst., 2008, 489, 22/[348]–339/[365] CrossRef.
- M. J. Frisch, G. W. Trucks, H. B. Schlegel, G. E. Scuseria, M. A. Robb, J. R. Cheeseman, G. Scalmani, V. Barone, G. A. Petersson, H. Nakatsuji, X. Li, M. Caricato, A. V. Marenich, J. Bloino, B. G. Janesko, R. Gomperts, B. Mennucci, H. P. Hratchian, J. V. Ortiz, A. F. Izmaylov, J. L. Sonnenberg, D. Williams-Young, F. Ding, F. Lipparini, F. Egidi, J. Goings, B. Peng, A. Petrone, T. Henderson, D. Ranasinghe, V. G. Zakrzewski, J. Gao, N. Rega, G. Zheng, W. Liang, M. Hada, M. Ehara, K. Toyota, R. Fukuda, J. Hasegawa, M. Ishida, T. Nakajima, Y. Honda, O. Kitao, H. Nakai, T. Vreven, K. Throssell, J. A. Montgomery Jr, J. E. Peralta, F. Ogliaro, M. J. Bearpark, J. J. Heyd, E. N. Brothers, K. N. Kudin, V. N. Staroverov, T. A. Keith, R. Kobayashi, J. Normand, K. Raghavachari, A. P. Rendell, J. C. Burant, S. S. Iyengar, J. Tomasi, M. Cossi, J. M. Millam, M. Klene, C. Adamo, R. Cammi, J. W. Ochterski, R. L. Martin, K. Morokuma, O. Farkas, J. B. Foresman and D. J. Fox, Gaussian 16 Rev. B.01, 2016 Search PubMed.
- A. D. Becke, J. Chem. Phys., 1993, 98, 1372–1377 CrossRef CAS.
- C. Lee, W. Yang and R. G. Parr, Phys. Rev. B: Condens. Matter Mater. Phys., 1988, 37, 785 CrossRef CAS.
- M. M. Jadhav, T. H. Chowdhury, I. Bedja, D. Patil, A. Islam and N. Sekar, Dyes Pigm., 2019, 165, 391–399 CrossRef CAS.
- A. G. Ioannou, S. M. Colwell and R. D. Amos, Chem. Phys. Lett., 1997, 278, 278–284 CrossRef CAS.
- S. Muhammad, A. R. Chaudhry and A. G. Al-Sehemi, Optik, 2017, 147, 439–445 CrossRef CAS.
- Y. Zhao and D. G. Truhlar, Theor. Chem. Acc., 2008, 120, 215–241 Search PubMed.
- H. A. Kurtz, J. J. Stewart and K. M. Dieter, J. Comput. Chem., 1990, 11, 82–87 CrossRef CAS.
- S. Muhammad, J. Mol. Graphics Modell., 2015, 59, 14–20 CrossRef CAS.
- S. Muhammad, Mater. Chem. Phys., 2018, 220, 286–292 CrossRef CAS.
- A. D. Herrera-Espana, J. Aguilera-González, G. J. Mena-Rejón, S. Hernández-Ortega and D. Cáceres-Castillo, Acta Crystallogr., Sect. E: Crystallogr. Commun., 2019, 75, 717–720 CrossRef CAS.
- N. K. Sebbar, B. Hni, T. Hökelek, A. Jaouhar, M. Labd Taha, J. T. Mague and E. M. Essassi, Acta Crystallogr., Sect. E: Crystallogr. Commun., 2019, 75, 721–727 CrossRef CAS.
- M. A. Spackman, J. J. McKinnon and D. Jayatilaka, CrystEngComm, 2008, 10, 377–388 CAS.
- V. Nagaveni, S. Naveen, T. S. Kumar, M. Kumara, K. Mahadevan and N. Lokanath, Pharma Chem., 2016, 8, 392–396 CAS.
- A. Saeed, M. Bolte, M. F. Erben and H. Pérez, CrystEngComm, 2015, 17, 7551–7563 RSC.
- M. U. Khan, M. Khalid, M. Ibrahim, A. A. C. Braga, M. Safdar, A. A. Al-Saadi and M. R. S. A. Janjua, J. Phys. Chem. C, 2018, 122, 4009–4018 CrossRef CAS.
- J.-L. Bredas, C. Adant, P. Tackx, A. Persoons and B. Pierce, Chem. Rev., 1994, 94, 243–278 CrossRef CAS.
- G. S. He, J. Zhu, A. Baev, M. Samoć, D. L. Frattarelli, N. Watanabe, A. Facchetti, H. Ågren, T. J. Marks and P. N. Prasad, J. Am. Chem. Soc., 2011, 133, 6675–6680 CrossRef CAS.
- M. Nakano, M. Okumura, K. Yamaguchi and T. Fueno, Mol. Cryst. Liq. Cryst., 1990, 182, 1–15 CrossRef.
- M. Nakano, K. Yamaguchi and T. Fueno, Chem. Phys. Lett., 1991, 185, 550–554 CrossRef CAS.
- S. Muhammad, K. Fukuda, T. Minami, R. Kishi, Y. Shigeta and M. Nakano, Chem. - Eur. J., 2013, 19, 1677–1685 CrossRef CAS.
- M. N. Arshad, A.-A. M. Al-Dies, A. M. Asiri, M. Khalid, A. S. Birinji, K. A. Al-Amry and A. A. Braga, J. Mol. Struct., 2017, 1141, 142–156 CrossRef CAS.
- M. N. Tahir, M. Khalid, A. Islam, S. M. A. Mashhadi and A. A. Braga, J. Mol. Struct., 2017, 1127, 766–776 CrossRef CAS.
- J. Wu, S.-X. Liu, A. Neels, F. Le Derf, M. Sallé and S. Decurtins, Tetrahedron, 2007, 63, 11282–11286 CrossRef CAS.
- J.-i. Aihara, J. Phys. Chem. A, 1999, 103, 7487–7495 CrossRef CAS.
- I. Khan, M. Khalid, M. Adeel, M. U. Khan, M. S. Khan, N. Ahmad, A. Ali and M. Akram, Optik, 2020, 219, 165285 CrossRef CAS.
Footnotes |
| † Electronic supplementary information (ESI) available. CCDC 2025097–2025099. For ESI and crystallographic data in CIF or other electronic format see DOI: 10.1039/d0ra08528f |
| ‡ Both authors contributed equally to this work. |
| This journal is © The Royal Society of Chemistry 2021 |

