 Open Access Article
Creative Commons Attribution 3.0 Unported Licence
Microwave-assisted synthesis of titania–amorphous carbon nanotubes/amorphous nitrogen-doped carbon nanotubes nanohybrids for photocatalytic degradation of textile wastewater
Sithembela A. Zikalala a,
Mandla B. Chabalalaa,
Nozipho N. Gumbi
 a,
Neil J. Coville
 b,
Bhekie B. Mamba
 ac,
Bridget K. Mutuma
 b and
Edward N. Nxumalo
 *a
*a
aInstitute for Nanotechnology and Water Sustainability, College of Science, Engineering and Technology, University of South Africa, Florida, 1709, Johannesburg, South Africa. E-mail: nxumaen@unisa.ac.za; Tel: +27 11 670 9498
bDSI-NRF Centre of Excellence in Strong Materials and Molecular Sciences Institute, School of Chemistry, University of the Witwatersrand, Johannesburg 2050, South Africa
cState Key Laboratory of Separation Membranes and Membrane Processes, National Centre for International Joint Research on Membrane Science and Technology, Tianjin, 300387, People's Republic of China
First published on 8th February 2021
Abstract
The synthesis of TiO2 nanohybrids fabricated using amorphous carbon nanotubes (aCNTs) and amorphous nitrogen doped carbon nanotubes (aNCNTs) via a microwave-assisted hydrothermal method is reported. The photocatalytic removal of Reactive Red 120 (RR 120) and organics from industrial textile wastewater using these nanohybrids is discussed. The synthesis process was shown to promote the removal of nano graphitic flakes from the outer walls of the aNCNTs and aCNTs and subsequent incorporation of these carbonaceous materials into TiO2 nanocrystals as such enabling a stronger interaction between the TiO2 and the carbonaceous material. This enabled the production of a surface plasmon resonance on the TiO2 and NTiO2 nanocrystals. The carbon residue was confirmed to be aCNTs and aNCNTs by TGA and DTA analyses. XPS analysis for the TiO2–aNCNT nanohybrids confirmed the C and N doping of TiO2 due to the amorphous residues from the aNCNTs. In addition, XPS and FTIR spectroscopic analysis confirmed the presence of surface oxygen-based groups. TEM micrograph analysis showed that aCNTs and aNCNTs promote the formation of monodispersed and small TiO2 particles; all below 7.4 nm. The NTiO2–aNCNT nanohybrids have the lowest energy band gap at 2.97 eV and the lowest PL intensity. The TiO2–aNCNT nanohybrids had superior adsorptive (98.2%) and photocatalytic (99%) removal for 20 ppm RR 120 dye solution at k1app 3.44 × 10⁻² min−1. Lastly, all the nanohybrids demonstrate the formation of visible-light absorbing intermediates from VAT-dyed textile wastewater. The work demonstrates the possibility of the use of these nanohybrids to derive new products through photocatalytic nanohybrids.
1. Introduction
Carbonaceous materials have received much attention due to their potential in enhancing the photocatalytic properties of TiO2 and its doped forms. Among many carbonaceous materials, carbon nanotubes (CNTs), carbon nanofibers (CNFs) and graphene are most widely used as support materials for TiO2 since they enhance the photocatalytic activity of TiO2 and its doped forms in several ways.1 First, their electron-rich surface enhances the absorption of light through photosensitization.2 Second, the high electrical conductivity of these carbonaceous supports decreases the electron–hole recombination (also known as charge recombination) in TiO2 hence making both photo-generated electrons (e−) and positive holes (h+) available to take part in the photocatalytic processes. In addition, these carbonaceous materials narrow the energy band gap (Eg) in TiO2 thus enabling the absorption of visible light by TiO2.3,4CNTs are cylindrical, tubular graphitic sheets that range from a single ring (single walled CNTs) to multiple concentric rings (multiwalled CNTs).5 The cylindrical morphology imputes CNTs with a high length to diameter ratio; a characteristic that makes them to have a high surface area.6 CNTs are renowned for their high tensile strength and high electrical conductivity; properties that are primarily due to the sp2 hybridization of the lattice carbons resulting in σ–σ, C–C bonds and π–π bonding resulting from the lone pair electrons on the carbons within the graphitic layer.7 Defects on these graphitic walls are characterized by sp3 hybridized carbons and as such decrease mechanical strength of CNTs. The introduction of heteroatoms into the graphitic lattice induces strain on the walls due to unequal bond strengths and lengths between the –C–C– and the carbon–heteroatom bond.8 The effect of heteroatom doping on the electrical conductivity, however, is dependent on electronegativity of the non-carbon atom relative to carbon. Electronegative and electron rich elements typically increase electrical conductivity.9
The quality of carbon nanotubes is also affected by the synthesis reaction environment in that low quality, thick-walled and less crystalline carbon nanotubes are produced when the synthesis times are longer temperatures, and carbon source concentrations are higher.10,11 Previous research has shown that chemical vapor deposition synthesis of CNTs at times longer than 1 h, high precursor and carrier gas flow rates and temperatures higher than 800 °C, results in the formation of CNTs with wide inner and outer diameters due to thick, but weak walls.10 While the inner layers of the walls may be graphitic, the outer layers generally consist of weakly held nano graphitic sheets and some amorphous residue.12,13 This makes the synthesis of such low-quality carbon nanotubes cheaper and as such appealing for the modification of semiconductors for catalytic applications. These types of CNTs are called amorphous carbon nanotubes (aCNTs).13,14
aCNTs have unique properties that make them find a different niche in several applications that crystalline CNTs do not occupy. The discontinuity of the walls imputes aCNTs with electrical and thermal properties that enable them to be good absorbers of electromagnetic radiation, have a large surface area, and an energy band gap (Eg) that is inversely proportional to the diameter. aCNTs also exhibit relatively the same electronic properties regardless of the chirality. This suggests aCNTs are suited for the attachment of nanoparticles; a feature attributed to the high density of structural defects on the outer surface of aCNTs.15 Additionally aCNTs are resistant to oxidation in air at temperatures below 300 °C.16 These properties have made aCNTs to be widely used in such processes as adsorption,17 lithium-ion storage cells,18 space technology.19 The unique electrical properties of aCNTs also make them suitable for use in photocatalytic degradation experiments.16,20
As such, aCNTs and the amorphous residue, have been explored in the modification of semiconductor photocatalysts and found to demonstrate exceptional photocatalytic performances.12,21,22 For example, the degradation of methylene blue (MB) using amorphous carbon (aC) coated TiO2 was found to follow the first order kinetics at rate constant of 16.4 h−1 as opposed to that of bare TiO2 (4.14 h−1).23 The synergistic effect of doping TiO2 with N and hybridizing it with amorphous C increased visible light photosensitivity and extended the band edge of the nanohybrid up to 600 nm (which corresponds to Eg ∼ 2.36 eV).21 aCNTs have also been reported in the fabrication of Ag–aCNT and MnO–aCNT nanohybrids formed by supporting Ag and MnO nanoparticle onto aCNTs.24,25 The Ag–aCNT nanohybrids had a lower energy Eg than the Ag.24 In the latter case, aCNTs were shown to photosensitize MnO in visible light and extend its absorption edge into the visible range.25 A mechanically weak form of nitrogen doped carbon was used to form a composite with AgPO4 and found to enhance the charge separation and hence the photocatalytic performance of the nanocomposite.26
Due to the bulk of semiconductor–crystalline CNT nanohybrids, concerns on these nanohybrids compromising the filtration efficiency of polymer membranes through the formation of macropores at the polymer/nanoparticle interface have been raised.27 This has led to the carbonaceous material–crystalline CNT nanohybrids having seen less transition into membrane technology.27 As such, more uniform and smaller carbonaceous material–crystalline CNT material nanohybrids are desirable to impute photocatalytic properties onto polymers while ensuring the sustainable use of semiconductor-based photocatalysts without compromising the filtration capabilities. aCNTs are promising candidates for the tuning of the optical properties of semiconductor photocatalysts with a possibility of maintaining a strong interaction between the TiO2 and the carbonaceous material.
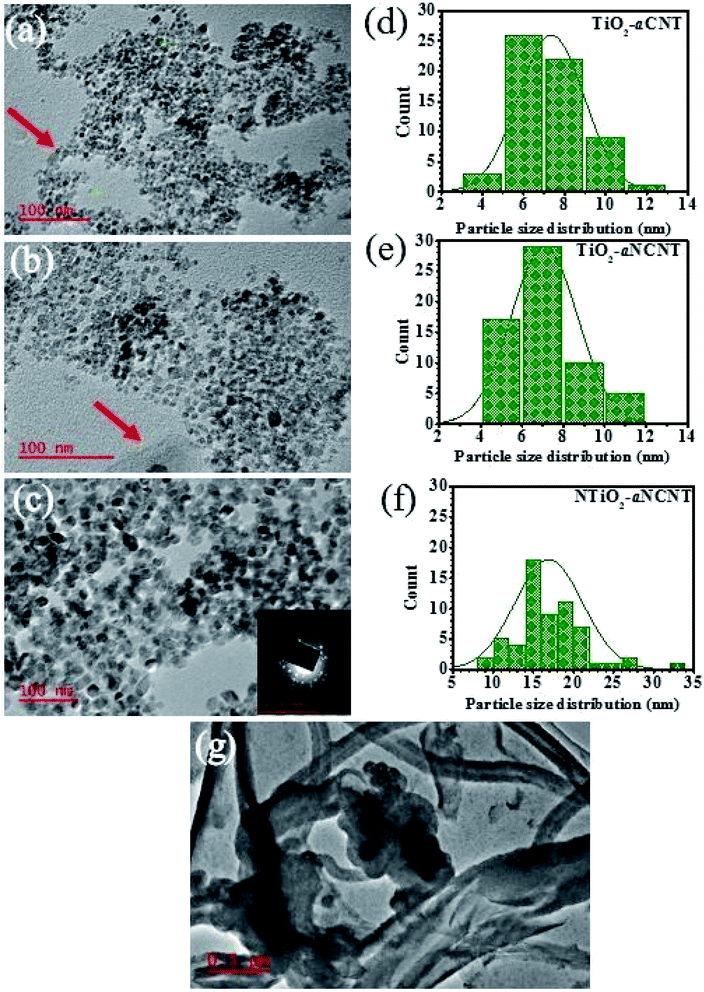
The aCNTs and aNCNTs used in this work were tailored to have loosely held graphitic nano flakes to investigate the contribution of the amorphous nature of aCNTs on the optical, chemical and mechanical properties of TiO2 and NTiO2. The nanotubes used in this study are characterized by thick walls in the range 40–100 nm, wider inner and outer diameters in the range 100–300 nm and bolus capping or open ends (Fig. 3(g)). Furthermore, addition of surface groups and doping with non-carbon elements into the CNT layers, makes the CNTs more amorphous and more prone to breaking down to shorter fragments and under extreme mechanical strain and extreme oxidizing environments to a mix of graphitic and amorphous residue.28 As such, it is expected that aNCNT would be fragmented to smaller graphitic and amorphous carbon residues which would be incorporated into or onto the NTiO2 nanoparticles.
In this study, an investigation of the influence of aCNT and aNCNTs on the properties of TiO2 and NTiO2 was conducted to study the effects of the amorphous nature of a CNT wall on its interaction with TiO2. In situ polymeric condensation of TiO2 and NTiO2 in an aCNT/aNCNT suspension was carried out using the microwave assisted hydrothermal method. These resultant photocatalytic nanohybrids were then evaluated for the degradation of RR 120 as a model dye. Finally, the nanohybrids were evaluated for the removal of color and organics in industrial textile effluent.
2. Materials and methods
2.1. Materials
Titanium butoxide (TiOBut), propanol, butanol, ethanol (Et·OH), acetylacetonate, FeCl·6H2O, Co(NO3)·6H2O and NH4OH, CaCO3 were all supplied by Sigma Aldrich South Africa. C2H2 and N2 gases supplied by Afrox South Africa, a tube furnace with an effective heating length of 80 cm equipped with a thermostat and a 1 m quartz tube were employed for the synthesis of aCNTs and aNCNTs. The synthesis of the TiO2–aCNT, TiO2–aNCNT and NTiO2–aNCNT nanohybrids was carried out in an MDS-6G synthesis/digestion microwave (Sineo-China) equipped with a reactor system that consists of Teflon-lined reactor vessels each covered with a SiC composite. Each vessel is held in a blast safety casing to enable pressure build up during synthesis.2.2. Synthesis of aCNTs and aNCNTs
The Fe–Co/CaCO3 bimetallic catalyst was synthesized using the wet impregnation technique adapted from previous procedures using FeCl·6H2O and Co(NO3)·6H2O as precursors.10,29 For the synthesis of aCNTs about 0.85 g of the Fe–Co/CaCO3 bimetallic catalyst powder in a quartz boat, was inserted into the quartz tube and the quartz tube placed into the furnace. The quartz tube was purged with N2 at a flow rate of 240 mL min−1 while the temperature of the furnace was being ramped up at 10 °C min−1 to 800 °C. C2H2 was then passed through the tube at 100 mL min−1 together with N2 kept at 240 mL min−1 for 2 h before cooling the furnace to room temperature in an inert atmosphere. A similar procedure was followed for the synthesis of aNCNTs except that vapor made from 14.5 M NH4OH was passed into the quartz tube with the C2H2 and N2. The aCNTs and aNCNTs were sonicated in aqua regia at 80 °C for 5 h and then rinsed with DI until the pH was neutral. The resultant aCNTs and aNCNTs were dried in an electric furnace at 70 °C overnight.2.3. Synthesis of TiO2–aCNT, TiO2–aNCNT and NTiO2–aNCNT nanohybrids
The sequence in the addition of the reagents up to aging through stirring was adapted from our previous work due to the degree of control on particle size distribution that the method showed.22 A weighed amount of aNCNTs was sonicated in 50 mL ethanol (Et·OH) at 40 °C for 1 h while keeping the beaker covered with parafilm to reduce evaporation of the ethanol. The amount of aNCNTs and aCNTs was calculated based on the stoichiometric mass of Ti in the 10 mL titanium butoxide (TiOBut) and was determined to be of a mass equal to 5 wt% of the Ti. A solution of TiOBut (Solution A) was prepared by dissolving 10 mL of TiOBut in a mixture consisting of 100 mL butanol and 10 mL acetylacetone. Another solution (Solution B) of 97% NH4OH dissolved in propanol![[thin space (1/6-em)]](https://www.rsc.org/images/entities/char_2009.gif) :
:![[thin space (1/6-em)]](https://www.rsc.org/images/entities/char_2009.gif) DI mixture of ratio 1
DI mixture of ratio 1![[thin space (1/6-em)]](https://www.rsc.org/images/entities/char_2009.gif) :
:![[thin space (1/6-em)]](https://www.rsc.org/images/entities/char_2009.gif) 1 was prepared and the Solutions A and B were simultaneously added dropwise into the suspension of aNCNTs under continuous sonication and stirring to form a gray precursor gel. The precursor gel was then removed from the ultrasonicator but stirring continued on a magnetic stirrer for 5 h. The precursor gel was then transferred into silicon carbide-coated Teflon reactor vessels, clamped into a blast-safety casing, and subjected to 30 min of microwave heating at 180 °C and 1 MPa using an MDS-6G synthesis/digestion microwave reactor. The resultant gray precipitate was sequentially washed in propanol, ethanol followed by a final rinse in a 1
1 was prepared and the Solutions A and B were simultaneously added dropwise into the suspension of aNCNTs under continuous sonication and stirring to form a gray precursor gel. The precursor gel was then removed from the ultrasonicator but stirring continued on a magnetic stirrer for 5 h. The precursor gel was then transferred into silicon carbide-coated Teflon reactor vessels, clamped into a blast-safety casing, and subjected to 30 min of microwave heating at 180 °C and 1 MPa using an MDS-6G synthesis/digestion microwave reactor. The resultant gray precipitate was sequentially washed in propanol, ethanol followed by a final rinse in a 1![[thin space (1/6-em)]](https://www.rsc.org/images/entities/char_2009.gif) :
:![[thin space (1/6-em)]](https://www.rsc.org/images/entities/char_2009.gif) 1 DI
1 DI![[thin space (1/6-em)]](https://www.rsc.org/images/entities/char_2009.gif) :
:![[thin space (1/6-em)]](https://www.rsc.org/images/entities/char_2009.gif) Et·OH solution. After vacuum drying, the precipitate was further dried in an oven at 100 °C for 48 h and crushed using a mortar and pestle. TiO2–aNCNT and TiO2–aCNT nanohybrids with 5 wt% CNT wt loading were synthesized in a similar way except that TiOBut was hydrolyzed using propanol
Et·OH solution. After vacuum drying, the precipitate was further dried in an oven at 100 °C for 48 h and crushed using a mortar and pestle. TiO2–aNCNT and TiO2–aCNT nanohybrids with 5 wt% CNT wt loading were synthesized in a similar way except that TiOBut was hydrolyzed using propanol![[thin space (1/6-em)]](https://www.rsc.org/images/entities/char_2009.gif) :
:![[thin space (1/6-em)]](https://www.rsc.org/images/entities/char_2009.gif) DI (1
DI (1![[thin space (1/6-em)]](https://www.rsc.org/images/entities/char_2009.gif) :
:![[thin space (1/6-em)]](https://www.rsc.org/images/entities/char_2009.gif) 1 v/v) instead of NH4OH (Table 1).
1 v/v) instead of NH4OH (Table 1).
| Nanohybrid | Description | Color |
|---|---|---|
| TiO2–aCNT | Titania–amorphous carbon nanotubes | Light gray |
| TiO2–aNCNT | Titania–amorphous nitrogen doped carbon nanotubes | Light gray |
| NTiO2–aNCNT | Nitrogen doped titania–amorphous nitrogen doped carbon nanotubes | Yellow gray |
2.4. Characterization of nanohybrids
Fourier transform infrared (FTIR) spectroscopic analysis (PerkinElmer Frontier FTIR spectrometer) was carried out to investigate the presence of surface functional groups on the nanohybrids. For transmittance measurements, each sample was ground with KBr and pressed to be a semi-transparent pellet and scanned in the range 450–4000 cm−1. Elemental analysis was carried out using an Axs TM® X-ray photoelectron spectrophotometer. Each powdered sample was pressed into a pellet before analysis. Particle size measurements and morphology investigations were carried out using a Jeol TEM 2010 (200 kV). Approximately 5 mg of nanohybrid powder was dispersed in 10 mL ethanol by ultrasonicating at room temperature. Two drops of the colloidal suspension were spread onto a Cu grid that had been previously sputter coated with ∼5 nm carbon. To determine the crystalline phase and to investigate the bonding configuration between NTiO2 and aCNTs/aNCNTs, Raman spectroscopic analysis was carried out using an Alpha 300RA AFM/Raman combined system (Witec). A double-sided, transparent tape was spread onto a microscope glass slide and ca. 5 mg of the nanohybrid powder was pasted onto the tape. Measurements were taken using the Raman 532 module at an integration time of 0.6 s.Thermogravimetric analysis (TGA) and differential thermal analysis (DTA) were carried out using a Trios TGA 5500 equipped with a high temperature furnace. For these analyses, ca. 10 mg of each nanohybrid was spread onto a platinum high temperature pan before inserting into the high temperature furnace. A ramp rate of 10 °C min−1 under a 25 mL min−1 N2 and air flow were used separately to determine the thermal stability profile in the temperature range 30–850 °C. The TGA and DTA data were analyzed using the Trios TGA analyzer software.
UV-vis absorbance was determined using a PerkinElmer Lambda 650 S UV-vis spectrometer equipped with a tungsten and deuterium lamp with a combined scan range of 180–800 nm. All the scans were done at a rate of 266 nm min−1 and all samples were scanned as powders. Photoluminescence spectroscopy was carried out using a Horiba Fluorolog FL3 spectrophotometer equipped with a xenon lamp with scan range of 200–750 nm. The nanohybrids were excited at 350 nm and the emission spectra were collected in the range 270–600 nm. All data, unless specified, was plotted and analyzed using Origin 8.5 Pro. Version.
2.5. Photocatalytic performance evaluation
The photocatalytic performance of the nanohybrids was first evaluated for the removal of RR 120 by dispersing 5 mg of each nanohybrid photocatalyst in 200 mL of a 20 ppm solution of the dye. The suspension was sonicated for 30 min at room temperature to achieve adsorption–desorption equilibrium between the dye and the nanohybrid photocatalysts. In the analysis of the efficiency of the nanohybrids, dye removal efficiency was considered during the adsorption–desorption stage and at 30 min after photocatalytic degradation and at the end of contact time i.e. 300 min. The nanohybrids were further evaluated for the removal of color from vat-dye laden industrial textile effluent under the similar conditions as in the case of RR 120.3. Results and discussion
3.1. Chemical composition analysis of the titania–amorphous carbon nanotube nanohybrids
![[double bond, length as m-dash]](https://www.rsc.org/images/entities/char_e001.gif) C–, alkane –C
C–, alkane –C![[double bond, length as m-dash]](https://www.rsc.org/images/entities/char_e001.gif) O and amine –N–H bending. There also occurs a primary alcohol –C–O stretching peak at 1059 cm−1 for all the nanohybrids and the aNCNTs. It is also expected that the molecular residue from the alcohol and acetylacetone used during the synthesis process also leave traces of these organic groups on the surfaces of the nanohybrids.
O and amine –N–H bending. There also occurs a primary alcohol –C–O stretching peak at 1059 cm−1 for all the nanohybrids and the aNCNTs. It is also expected that the molecular residue from the alcohol and acetylacetone used during the synthesis process also leave traces of these organic groups on the surfaces of the nanohybrids.
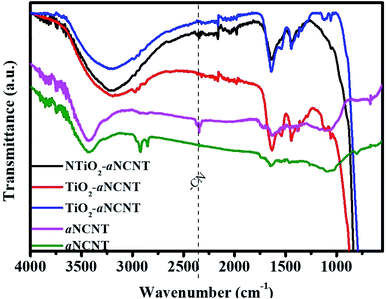 | ||
| Fig. 1 FTIR spectra of the titania–amorphous carbon nanotubes nanohybrids1 and amorphous nitrogen doped carbon nanotubes. | ||
FTIR peaks due to CO and COO− are observed for all nanohybrids at 1115 and 1059 cm−1 suggesting that the nanohybrids are capable of adsorbing organic molecules. The peak at 2348 cm−1 is assigned to –C–N– and gaseous CO2 bonds and it occurs in the aNCNTs and NTiO2–aNCNT nanohybrids.21 This confirms the doping of N into amorphous C and that the N plays a role in the formation of the TiO2/aNCNT interface.
![[double bond, length as m-dash]](https://www.rsc.org/images/entities/char_e001.gif) N which could suggest surface N groups.26 The Ti2p spectra has the Ti2p3/2 peak center at 455.75 and its Ti2p1/2 at 461.47 eV indicating a peak separation of the ∼6 eV and hence indexed to Ti4+ (Fig. 2(c)). These peaks indicate a blue shift of the Ti2p3/2 and Ti2p1/2 in Ti2+ which typically occur at 455.03 and 460.85 eV respectively.31 A blue shift in binding energies suggests that the elemental species is bonded to a more electronegative element; of which, in the case of TiO2–aNCNT nanohybrids, C is the most electronegative on the Pauling scale.32 In order of decreasing electronegativity, the elements in the nanohybrid are O (3.44) > N (3.04) > C (2.55) > Ti (1.54). Therefore, the blue shift of the binding energies for Ti2p3/2 and Ti2p1/2 in Ti2+ suggest the occurrence of the Ti–C dative bond.
N which could suggest surface N groups.26 The Ti2p spectra has the Ti2p3/2 peak center at 455.75 and its Ti2p1/2 at 461.47 eV indicating a peak separation of the ∼6 eV and hence indexed to Ti4+ (Fig. 2(c)). These peaks indicate a blue shift of the Ti2p3/2 and Ti2p1/2 in Ti2+ which typically occur at 455.03 and 460.85 eV respectively.31 A blue shift in binding energies suggests that the elemental species is bonded to a more electronegative element; of which, in the case of TiO2–aNCNT nanohybrids, C is the most electronegative on the Pauling scale.32 In order of decreasing electronegativity, the elements in the nanohybrid are O (3.44) > N (3.04) > C (2.55) > Ti (1.54). Therefore, the blue shift of the binding energies for Ti2p3/2 and Ti2p1/2 in Ti2+ suggest the occurrence of the Ti–C dative bond.
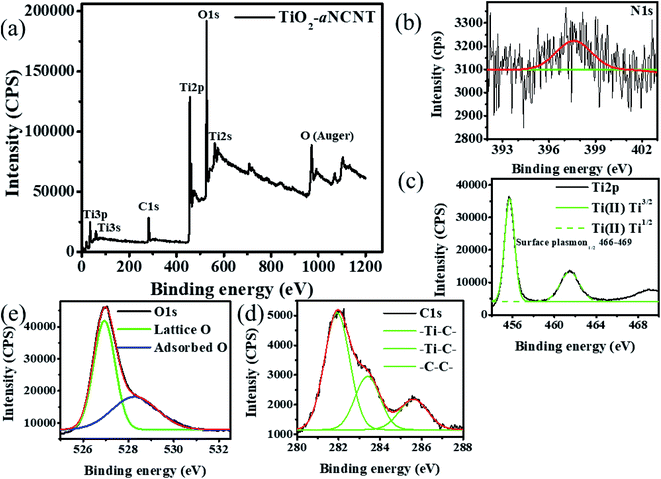 | ||
| Fig. 2 XPS analysis for the nanohybrid TiO2–aNCNT showing (a) wide scan, (b) N1s, (c) Ti2p, (d) C1s and (e) O1s spectra. | ||
| Atomic [%] | Error [%] | Elemental mass [%] | Error [%] | |
|---|---|---|---|---|
| O1s | 53.87 | 0.96 | 40.39 | 0.54 |
| C1s | 25.23 | 1.20 | 14.20 | 0.77 |
| N1s | 0.94 | 0.46 | 0.62 | 0.30 |
| Ti2p | 19.96 | 0.40 | 44.79 | 0.57 |
The occurrence of the –Ti–C– bond is further confirmed by the C1s peaks at 281.92 and 284.41 eV which are indexed to the –Ti–C– bond (Fig. 2(d)). The peak at 283.41 eV has also been found in nanohybrids of TiO2–amorphous carbon and has been attributed to the –Ti–C– bond in the configuration –O–Ti–C–.33 The C1s spectrum also has a peak in the binding energy range 284.01–286.80 eV, a range in which the binding energy for C in the bonding configurations –C–OH, –C–O–C–, –C–C–, –C–C–H and –C–N falls.34,35 The O1s spectrum shows that the nanohybrid consists of both lattice and surface oxygen of which the lattice oxygen is all the oxygen that is found in the TiO2 crystalline matrix (Fig. 2(e)). The surface O accounts for 38.7% of all the oxygen and is typically indexed to the functional –OH and –COOH groups. These groups are negatively charged, hence increasing the affinity of the nanohybrids for positively charged species in adoption and photocatalytic processes.
3.2. Particle morphology analysis of the titania–amorphous carbon nanotube nanohybrids
An analysis of the TEM micrographs shows that all the nanohybrids have relatively good particle dispersion hence demonstrating that the synthesis method resulted is well dispersed TiO2 nanoparticles. The role of doping either TiO2 (to form NTiO2) and aCNTs (to form aNCNTs) is revealed in the morphology, particle size and particle size variation of the of TiO2/NTiO2 in the nanohybrids. TiO2 nanoparticles are generally quasi spherical and have small particles with small differences in average particle size and particle size variation (Fig. 3(a) and (b)). The average particle size for the nanohybrid TiO2–aCNT is 7.35 ± 1.59 nm and that of the TiO2–aNCNT nanohybrids is 7.08 ± 1.60 nm (Fig. 3(d)). The NTiO2–aNCNT nanohybrids, on the other hand, has larger NTiO2 nanoparticles (16.90 ± 4.11 nm) with various shapes including cuboidal, rhomboid, quasi spherical and rod-shaped and hence a wide particle size distribution Fig. 3(c). Unlike the other nanohybrids, the NTiO2 nanoparticles all have defined crystal shapes with distinct edges. These features for NTiO2 are consistent with our previous observations and work by other researchers.36,37 As such, it can be established that the hydrothermal synthesis of N doped TiO2 leads to the formation of cuboidal NTiO2 nanoparticles. The small size of the TiO2–aCNT and TiO2–aNCNT nanohybrids make them better suited for applications where adsorption is a key step since smaller sized nanoparticles offer a higher surface area for adsorption.38The TiO2–aCNT and TiO2–aNCNT nanohybrids show traces of aCNTs and aNCNTs, respectively (indicated by red arrows on the (Fig. 3(a) and (b)). In the former, the aCNT is densely covered by TiO2 nanoparticles resulting in the general tubular alignment of the TiO2 nanoparticle clusters whereas in the latter, the aNCNT is sparsely covered. The nanohybrid NTiO2–aNCNT, on the other hand, shows no traces of aNCNT structures although alkane and alkene peaks attributed to graphitic sheets and CNTs are observed in the FTIR spectra of the nanohybrid (Fig. 1). These observations are consistent with the Raman spectra of the nanohybrids, where D-and G-bands could be deconvoluted in the TiO2 based nanohybrids but not in NTiO2–aNCNT (Fig. 4 inset (b)). The absence of the aCNTs and the aNCNTs is due to their degradation, which results in their graphitic and amorphous residue being incorporated into the TiO2/NTiO2 nanocrystals. Lastly, selected area diffraction of the NTiO2 nanoparticles agrees with the Raman peak intensities in indicating good crystallinity of the nanohybrids (Fig. 3(c) inset) and Fig. 4). Therefore, the microwave assisted hydrothermal synthesis method is shown to be efficient in tailoring of doped and undoped TiO2–aCNT/aNCNT nanohybrids.
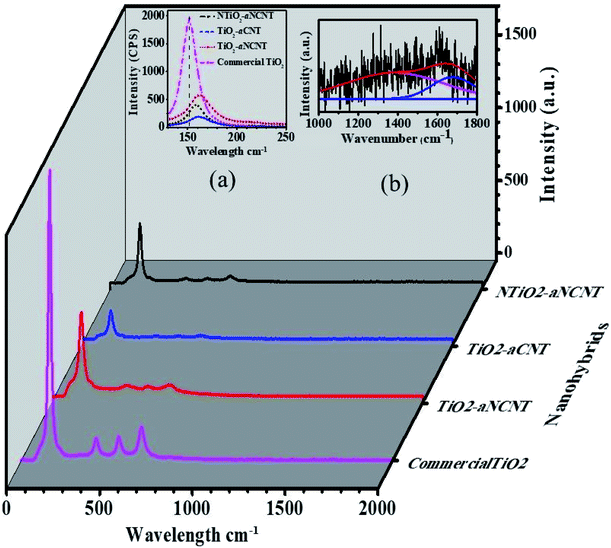 | ||
| Fig. 4 Raman spectra for the nanohybrids and commercial TiO2 with insets showing (a) the shifts in wavenumber due to hybridization (b) D- and G-bands for NTiO2–N-CNTs after functionalization. | ||
3.3. Raman spectroscopy analysis of nanohybrids
All the nanohybrids are of the anatase phase as indicated by the anatase Eg, A1g and B1g peaks arising from the symmetric stretch, antisymmetric bending and symmetric bending of the –O–Ti–O– bond respectively.39 The weak intensity of the Eg peaks indicate that the hydrothermally synthesized nanohybrids have lower crystallinity than commercial anatase TiO2. All the nanohybrids show a red shift of the Eg anatase peak compared to the Eg peak of commercial anatase TiO2. The anatase Eg peak for commercial TiO2 appears at 152 cm−1 while the nanohybrids appear at higher wavelengths in the decreasing order TiO2–aNCNT (163 cm−1) > TiO2–aCNT (160 cm−1) > NTiO2–aNCNT (157 cm−1) (Fig. 4 inset (a)). The degree of the shift of the wavenumber denotes the degree to which the electronic structure of TiO2 has been altered and thus, in the case of the nanohybrids, the strength of the bonds between TiO2/NTiO2 nanoparticles and the aCNTs/aNCNTs.33,34 Therefore, results indicate that the bond strength is in the decreasing order TiO2–aNCNT (163 cm−1) > TiO2–aCNT (160 cm−1) > NTiO2–aNCNT (157 cm−1); making the aNCNT to be the most suitable for forming a more stable TiO2–CNT interface. The stronger bonding between aNCNTs and TiO2 can be attributed to the introduction of partial positive charges (δ+) over C atoms and partial negative charges (δ−) over N atoms in the N-CNT skeleton. These charges reduce the surface energy of the NCNTs compared to CNT and thus making it energy favorable for the dative covalent attachment of TiO2 and NTiO2 seed crystals during the initial polymeric condensation of NTiO2 onto the CNTs.The D- and G-bands of the nanohybrids were of low intensity due to the disintegration of the carbon nanotubes and its integration into the TiO2/NTiO2 crystals and hence curve fitting was done to determine their exact peak position and intensities (Fig. 4 inset (b)). The disappearance of the D- and G-bands due to aCNTs is in agreement with previous observations where MnO was embedded onto aCNTs.40 Curve fitting of the Raman spectra of the nanohybrids showed weak D- and G-peaks for TiO2–aCNT and TiO2–aNCNT nanohybrids such that analysis of these peaks was not possible. An analysis of peak intensities and D- and G-band band positions was carried out to determine the degree of bonding between TiO2/NTiO2 nanoparticles with aCNTs and the aNCNTs. Previous studies have shown that the modification of CNTs with heteroatoms and heteroatomic groups alters the electronic properties of the CNTs thus interfering with both the position and intensity of the graphitic D- and G-bands.7,41,42 An attachment of electron acceptor groups results in a blue shift of the D- and G-bands while electron donor groups produce a red shift.41,42 The D- and G-bands of the nanohybrid NTiO2/TiO2–aCNT/aNCNT had red shift of both the D- and G-bands relative to those of aNCNTs from 1397 to 1382 cm−1 for the D-band and 1589 to 1676 cm−1 for the graphitic band (Table 3). This could suggest that the bonding between NTiO2/TiO2 and aCNT/aNCNT occurs through the –OH groups on the Ti(OH)4 intermediate donating their lone pair of electrons to the surface –OH and –COOH groups of the aNCNTs and aCNTs. For the aNCNTs, the –OH groups on the Ti(OH)4 intermediate could also donate their lone pair of electrons to the δ+ surface C atoms to form a dative covalent bond. This additional bonding configuration is expected to make the bonding between TiO2 and aNCNTs to be stronger as suggested by the greater change in the wavenumber for the anatase Eg band due to the nanohybrid TiO2–aNCNT. This is despite the dative bond between Ti4+ and the N-CNTs withdraws electrons from the NCNTs. The extra electrons due to the presence of N in the N-CNTs and the presence of N in NTiO2 alters the electronic behavior of the nanohybrid and hence its response to the light, including the exciting laser during Raman spectroscopic analysis. This points to the degree by which doping both TiO2 and CNTs alters the optical properties of the nanohybrid.
| Nanohybrid | Properties | D-band | G-band |
|---|---|---|---|
| aNCNTs | Wavelength pos. (cm−1) | 1367 | 1589 |
| Band area (a.u.) | 4748 | 1293 | |
| FWHM (cm−1) | 317 | 100 | |
| IG/ID | 0.272 | ||
| aCNTs | Wavelength pos. (cm−1) | 1357 | 1596 |
| Band area (a.u.) | 9303 | 4269 | |
| FWHM (cm−1) | 234.2 | 96.8 | |
| IG/ID | 0.458 | ||
| NTiO2–aNCNT | Wavelength pos. (cm−1) | 1382 | 1676 |
| Band area (a.u.) | 392 | 1092 | |
| IG/ID | 0.359 | ||
| TiO2–aCNT | N/A | ||
| NTiO2–aCNT | N/A |
3.4. Thermogravimetric analysis of nanohybrids
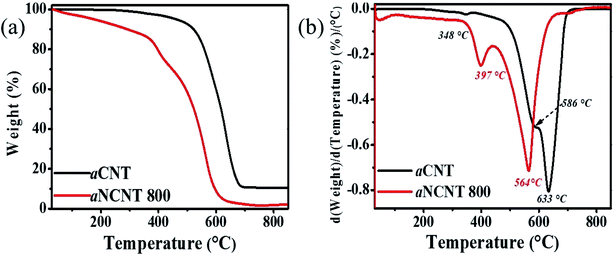
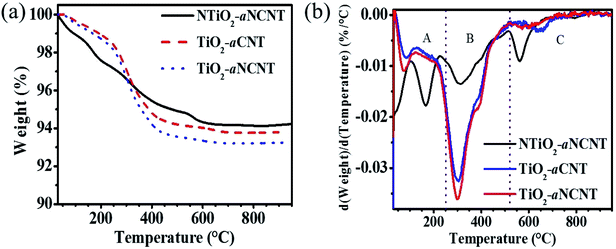
TGA and DTA thermograms for aCNTs and aNCNT confirm the coexistence of an amorphous carbon and the crystalline forms in each sample. It is further revealed that both amorphous and crystalline forms of aNCNTs degrade at lower temperatures compared to those of aNCNTs. Furthermore, the amorphous nature of aNCNTs relative to aCNTs is demonstrated by a lower intensity of the differential peak corresponding to crystalline aNCNTs being lower that corresponding to crystalline aCNTs (Fig. 5(b)).DTA and TGA thermograms of the nanohybrids show that all the nanohybrids have a dual composition of amorphous carbon and crystalline CNTs and NCNT, with the latter having the highest wt% composition in each hybrid (Fig. 6(a) and (b)). The increase in the DTA peak due to amorphous residue from both the aNCNTs and aCNTs relative to the DTA peak corresponding to the crystalline forms suggest that the nanohybrid synthesis process resulted in the breaking down of part of the crystalline forms into amorphous carbon residue and hence the aim of this work achieved. Previous reports have demonstrated that CNTs and aNCNTs synthesized at high temperatures, at long reaction times, high flow rates of the carbon source are prone to having thick flaky walls whose outer wall is weakly held to the inner crystalline form.10 The nanohybrids also demonstrate high adsorption for water and polar organics because of the wt% loss in the temp range 30–250 °C (Table 4 and Fig. 6b). This suggest that they are suited for applications where adsorption is part of the mechanism e.g. photocatalytic applications and sensing with NTiO2–aNCNT showing a greater adsorptive capability. The occurrence of these surface groups is also corroborated by the broad –OH vibration peak in all the nanohybrids in the FTIR spectra for the nanohybrids (Fig. 1). For the nanohybrid TiO2–aNCNT the occurrence of the surface groups is further confirmed by the occurrence of adsorbed oxygen peaks in the O1s spectra (Fig. 2(f)). The degradation temperature peaks for the crystalline forms of the aNCNTs and aCNTs occur at slightly lower temperatures in the nanohybrids compared to the aNCNTs and aCNTs. This is attributed to the TiO2 and NTiO2 trapping more heat at any given temperature and hence delivering more heat to the carbonaceous forms compared to the case where the carbonaceous forms are without TiO2.42 The amorphous form of aCNTs and aNCNTs are thermally degraded at a lower temperature range in the nanohybrids (224–448 °C) than in the aCNTs (550–650 °C) (Fig. 5(b)). However, these amorphous forms in the nanohybrids degrade in the same temperature for all the nanohybrids and over a wider range. In addition, the DTA thermograms have a shoulder peak occurring at 380 °C. The longer degradation range and the occurrence of the shoulder peak suggests that the two components are being degraded in the temperature range 224–448 °C. We reason that the shoulder peak at 380 °C is due to graphitic flakes peeling off from outer walls of the thick aNCNT and aCNTs during the synthesis of the nanohybrids while the lower temperature range is due to the amorphous form and towards the extreme low of this DTA peak, it is the carbonaceous fragments and atoms intercalated into the TiO2 lattice.
| Nanohybrid | wt% loss per temperature range (%) | ||
|---|---|---|---|
| <250 °C | 25 < 520 °C | >520 °C | |
| TiO2–aCNT | 1.27 | 4.73 | 0.377 |
| TiO2–aNCNT | 1.50 | 5.03 | 0.299 |
| NTiO2–aNCNT | 2.56 | 2.52 | 0.681 |
In retrospect, the DTA and TGA thermograms of the nanohybrids suggest that their chemical and mechanical integrity in air has its upper threshold at 200 °C. At higher temperatures, the doped ∼C and the amorphous carbon residue is oxidized yet these are essential for the maintenance of visible light absorption, and low charge recombination. Also, the changes in the thermal degradation temperatures in the region for degradation for aNCNTs and aCNTs lead to the inference of the strength of the interfacial bond between the TiO2 or NTiO2 nanoparticles and the aCNTs. The greater the shift from the thermal degradation of the aCNTs, the stronger the interaction between the aCNTs and the TiO2 nanoparticles. The idea works on the assumption that the chemical interaction at the interface between the CNTs and the TiO2 introduces a new set of bonds with unique bond strengths and enthalpies. Therefore, these deviations of the thermal degradation temperatures suggest that the nanohybrid between NTiO2/TiO2 and aNCNTs/aCNTs has been formed.34,42
3.5. Optical response of the nanohybrids
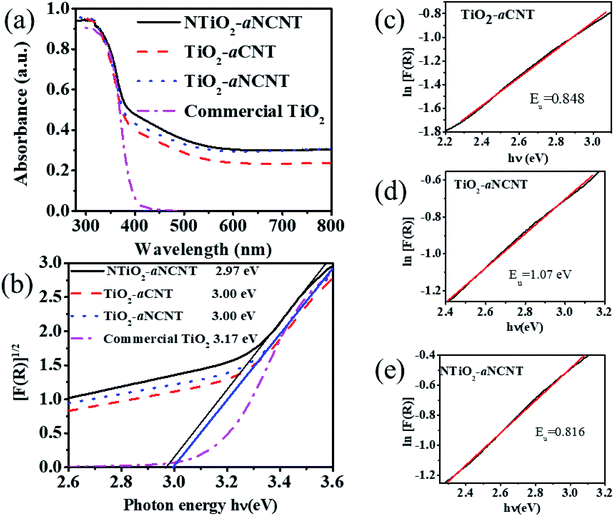
Hybridizing TiO2 with aNCNTs or aCNTs produced nanohybrids with increased photosensitization in the visible range as shown by an increase in absorbance from 0 to the range 0.23–0.303 for the nanohybrids. aNCNTs have a higher photosensitization effect on TiO2 than aCNTs and doping of TiO2 with N has insignificant contribution into photosensitization of the nanohybrids as shown by the insignificant difference in the visible light absorbance for the nanohybrids TiO2–aNCNT (0.293 a.u.) and NTiO2–aNCNT (0.303) (Fig. 7(a)).
Photosensitization of the nanohybrids is further enhanced by the Urbach energies of the nanohybrids. Urbach energy (Eu) is evidenced by the occurrence of Urbach tails at the band edge of semiconductor UV-vis spectra.37,43 At constant temperature Eu is due to crystalline defects. These defects can be due to the transformations in the crystalline structure due to temperature changes, occurrence of dopants (which distort the crystalline structure) and amorphosity of the nanocrystals.44,45 In semiconductor photocatalysis, Eu enhances the absorption of light beyond the absorption edge. Eu is the reciprocal of the slope in a plot of the natural log of the absorption coefficient [ln(R)] and photon energy (hν).45 The results show that the hybridizing TiO2 with aNCNTs is effective in enhancing visible light absorption through synergistic effect of doping TiO2 with N and hybridizing it with aNCNTs is effective in enhancing visible light absorption through Eu. This is shown by the nanohybrid TiO2–aNCNT having the highest Eu of 1.07 eV (Fig. 7(d)). However, the synergy of doping TiO2 with N and hybridizing with aNCNT suppresses the effect of aNCNTs in increasing the Eu as shown by the low Eu for the nanohybrid NTiO2–aNCNT (0.816 eV) compared to that of TiO2–aCNT (0.848 eV).
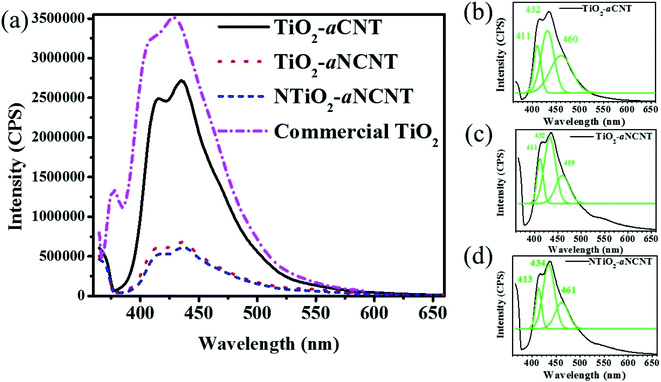
The PL spectra of the nanohybrids is also used to infer the presence of crystal defects and uncapped bonds on the surface of crystalline materials such as TiO2. Charge recombination occurring at crystal defects is indicated by the peaks occurring at 460 nm while charge recombination due to ∼dangling bonds is indicated by PL spectra not going back to 0 CPS at the longer wavelengths.46 Therefore, the PL spectra for the nanohybrids indicates that they have O vacancies but do not have any dangling bonds (Fig. 8(b)–(d)). A controlled occurrence of these O vacancies can enhance the photocatalytic activity of TiO2 in that, these sites introduce mid-band gap states closer to the VB hence providing an alternative conduction band in a lower energy state. The overall effect is the reduction of the Eg.47 However, as it is in the case of most dopants, this reduction in the Eg is beneficial if there is an efficient means of sequestering photogenerated electrons away from the VB of the TiO2 since there charge recombination is reduced. It is, therefore, expected that the occurrence of these vacancies in the nanohybrids TiO2–aNCNT and NTiO2–aNCNT enhances the photocatalytic activity due to the low charge recombination.
3.6. Photocatalytic performance of the nanohybrids
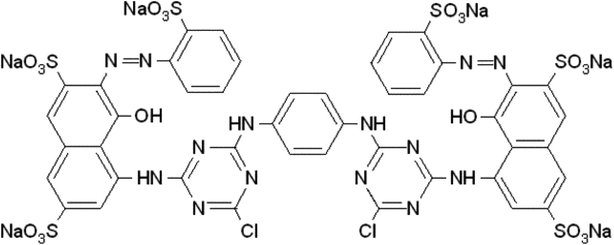
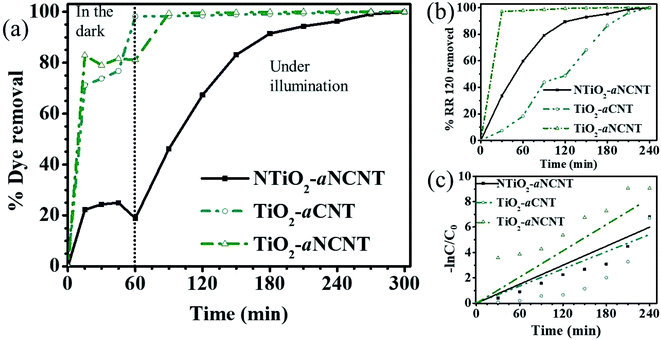
A. Adsorptive removal of the dye RR 120. The nanohybrid TiO2–aCNT had the highest adsorptive dye removal of 98.2% at 60 min of adsorption–desorption equilibrium (Table 5). While the nanohybrid TiO2–aNCNT, showed the second highest overall adsorptive removal of the dye (81.1%), it showed the fastest adsorptive removal, reaching 82.9% within 30 min (Fig. 10(a)). The nanohybrid NTiO2–NCNT showed the lowest adsorptive removal and the highest leaching of the dye molecules reaching its maximum at 45 min and subsequently leaching off 6% of the already adsorbed dye. Given that adsorption is a factor of active surface area and charge difference between the catalyst and the pollutant, the high adsorptive capacity of the nanohybrids TiO2–aCNT and TiO2–aNCNT is typical of catalysts with a large active surface area.48 The surface is a factor of particle size, particle size distribution and dispersion. Small, monodisperse and well dispersed nanoparticles offer high active surface area. The adsorptive behavior of the nanohybrids behave as predicted by the TEM micrographs of the nanohybrids in that the nanohybrids TiO2–aCNT and TiO2–aNCNT have the smallest particle size (7.35 ± 1.5 and 7.07 ± 1.6 nm, respectively) and are better dispersed (Table 5 and Fig. 3). NTiO2–aNCNT, on the other hand, has the highest particle size distribution (16.9 ± 4.1 nm) and the lowest adsorption. It also suggests that at the operational pH for the adsorption, the TiO2–aNCT and TiO2–aCNT nanohybrid photocatalysts have an overall negative charge, hence they actively attract the dye molecules. Charge behavior of the dye RR 120 and its interaction with CNT-based photocatalysts has shown that the attractive forces are due to the positively charged sulfite groups (R-SO3−) after the dissociation of the Na+ ion and the – interactions arising from π–π the cyclic rings in the RR 120 molecule (Fig. 9).49 Also, being an azo dye, the RR 120 molecule is rich in N and as such it is expected that in its interaction with the N-doped photocatalysts, the lone pairs of the N atoms will result in the repulsion between the dye molecules and the photocatalysts. The low adsorptive capacity of NTiO2–aNCNT and the highest adsorption of TiO2–aCNT could suggest that the repulsion due to these lone pairs is more pronounced than the possible attractive forces due to the – interactions between the cyclic carbon rings in the dye π–π molecules and the –C–C– making up of the aNCNTs and aNCNTs.
| Nanohybrid | Eg (eV) | PL intensity (×10−6 CPS) | kapp (×10−2 min−1) | Particle size (nm) | % dye adsorption | % dye removed at 30 min under illumination |
|---|---|---|---|---|---|---|
| TiO2–aCNT | 3.00 | 0.272 | 2.25 | 7.35 ± 1.59 | 98.2 ± 2.0 | 99 ± 1.75 |
| TiO2–aNCNT | 3.00 | 6.8 | 3.44 | 7.07 ± 1.60 | 81.1 ± 1.55 | 99 ± 1.65 |
| NTiO2–aNCNT | 2.97 | 6.07 | 2.49 | 16.9 ± 4.1 | 18.9 ± 1.91 | 46 ± 2.3 |
B. Photocatalytic removal of the dye RR 120 under illumination. The TiO2–aNCNT nanohybrids demonstrates the highest photocatalytic degradation of the dye jumping from 81.1% to 99.1% after 30 min under illumination while the removal by TiO2–aCNT only reaches 99% dye removal after 120 min of illumination (Fig. 10(b), (c) and Table 5). The nanohybrid NTiO2–aNCNT shows improved photocatalytic removal by reaching 99.9 overall dye removal at contact time 300 min like all the nanohybrids at an overall apparent first order constant of 2.49 × 10⁻² min−1, a rate constant that is higher than that for TiO2–aCNT (2.25 × 10⁻²). Kinetic studies of the photocatalytic removal of the dye demonstrate that the photocatalytic degradation of the dye follows pseudo first order kinetics.
A comparison of the photocatalytic performance of these nanohybrids with the physicochemical properties of the nanohybrids leads to the following observations:
(i) The dye removal performance for the TiO2–aCNT nanohybrids is more dependent on the small particle size, monodispersity and good particle dispersion (properties which insinuate a large surface area) more than it does rely on the optical properties;
(ii) The NTiO2–aNCNT nanohybrids, however, relies more on its good photocatalytic properties such as low Eg and high photosensitization in the visible to near infrared region. These properties make it more suited for visible light photocatalysis than all the nanohybrids. This means that the photocatalytic degradation by the TiO2–aNCNT photocatalytic nanohybrids proceeds through the production of the reactive oxidation species (O2˙− and −˙OH) more than the surface mediated redox degradation of the nanohybrids;
(iii) The TiO2–aNCNT nanohybrids have high visible light photosensitization, high Eu but high Eg; characteristics which make it relatively better suited for visible light photocatalysis than TiO2–aCNT and NTiO2–aNCNT photocatalytic nanohybrids. The nanohybrid TiO2–aNCNT also has the smallest particle size and good particle size distribution. Therefore, it is the most suited nanohybrid for photocatalytic degradation because it possesses both the good characteristics and not the downside characteristics from the latter.
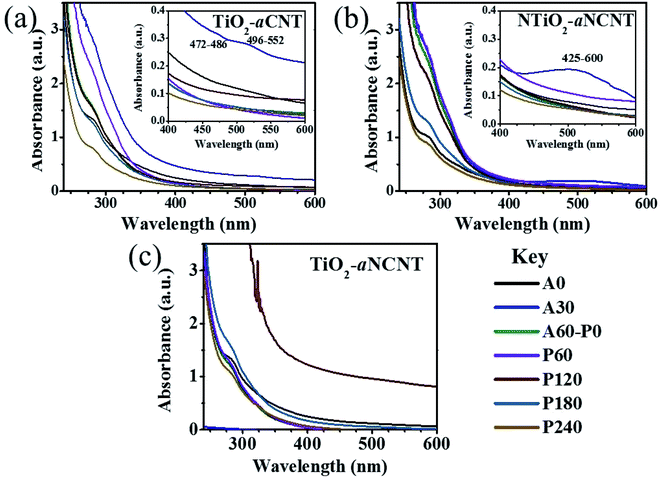 | ||
| Fig. 11 UV-vis spectra† of depicting degradation profiles for textile wastewater during photocatalytic treatment of the (a) TiO2–aNCNT (b) NTiO2–aCNT and (c) TiO2–aNCNT nanohybrids. Insets show the formation of peaks in the process of the oxidative treatment. | ||
Another feature common to all the TiO2–CNT nanohybrids is the fluctuation of the absorbance spectra for aliquots. For example, the aliquot collected at 30 min during sonication in the dark for the TiO2–aCNT nanohybrid has a high absorbance than the wastewater before degradation (Fig. 11).
Similar observations are made on the nanohybrid NTiO2–aNCNT. The nanohybrid TiO2–aNCNT shows the highest adsorptive removal of the organics from the wastewater within the first 30 min. This is evidenced by the decrease of the absorbance to almost zero across the whole spectrum Fig. 11(c). In addition to this, the aliquot collected after 120 min of degradation under illumination (P120) has the highest absorbance (Fig. 11(c)). These features also point to the possibility of the formation of UV-absorbing intermediates through a chemical reaction of intermediates formed from the degradation of non-UV absorbing organic moieties.54 VAT dyes, which are insoluble, can be broken down to water-soluble intermediates through the action of the radicals produced in AOPs. This would result in an increase in the concentration of dissolved organic moieties and hence an increase in the overall absorbance spectrum.55 However, in all the nanohybrids, the final aliquots collected at 240 min of degradation under illumination (P240) has the lowest absorbance. This points to the fact that the concentration of the organic pollutants in the wastewater has decreased and hence in overall the catalysts are showing catalytic degradation for the organics in the textile wastewater. In essence, the nanohybrids are shown to effectively break down textile dyes in industrial wastewater. High photocatalytic and adsorptive activity is desirable for photocatalysts to be incorporated into photocatalytic reactor membranes in order to accommodate the typical reduction in photocatalytic activity of the photocatalyst once in the PMR as it has been observed before.56 The proposed photocatalysts have the additional advantage of demonstrating the catalytic degradation of VAT dyes in industrial textile water as suggested by the formation of visible light absorbing intermediates. In as much different photocatalysts are generally evaluated for efficacy under different environments, the photocatalytic activity of TiO2–aCNT and TiO2–aNCNT nanohybrids on single dye systems is comparable to the activity of photocatalytic nanohybrids that are made from crystalline CNTs (Table 6). We attribute the good activity to the high adsorption of the dye by these catalysts; a feature that is unique to these photocatalytic nanohybrids. This makes them offer a niche for the use of photocatalytic membrane reactors that can be used to form potentially useful intermediates.
| Photocatalyst | Application | Result | Ref. |
|---|---|---|---|
| Magnetic MWCNT–TiO2 | Photocatalytic degradation of malachite green (MG) | 100% 20 ppm removal of MG at pH5 and catalyst loading of 200 ppm catalyst loading | 57 |
| Catalyst reusable despite the bulk of TiO2–MWCNT and simple electrostatic attraction | |||
| TiO2–Pt–MWCNT | Photocatalytic hydrogen production under irradiation | 2327 and 2091 μmol g L−1 H2 produced in 2 h under irradiation of glycerol and methanol respectively | 58 |
| Ag3PO4@MWCNTs@Cr:SrTiO3 | Photocatalytic degradation of malachite green | 100% removal of MG in 6 min at 100 mg pollutant per 1 g of catalyst under solar irradiation | 59 |
| Ag3PO4@NC | Photocatalytic degradation of norfloxacin, diclofenac and phenol | k1app = 1.248, 0.925, and 0.721 min−1 for the degradation of, norfloxacin, diclofenac and phenol | 26 |
| All Ag3PO4@NC nanohybrids performed better than Ag3PO4 | |||
| Amorphous C doped ZnxCd1−xS | H2 evolution under visible light | Energy band gap reduction from 2.7 to 2.3 eV and up to 280% increase in H2 evolution with incorporation of amorphous Carbon | 60 |
| Sn@aCNT | Lithium-ion storage batteries | Specific capacity of 749 mA h g−1 at current density of 0.2 A g−1 | 11 |
| Amorphous carbon doped ZnO/Zn | Photocatalytic degradation of basic blue 41 (12.5 ppm) and 100 mg L−1 catalyst loading under visible light | 7.046 × 10⁻¹ ppm dye adsorption in 60 min and 90% dye removal in 180 min at k1app = 17.2 × 10⁻³ min−1 | 61 |
| TiO2–aCNT, TiO2–aNCNT, NTiO2–aNCNT (radiation microwave hydrothermal synthesis) | Photocatalytic degradation of Congo red dye under LED white light | Dye removal efficiency at 30 min adsorption and 120 min photodegradation TiO2–aCNT – 69.4 and 92.5%, TiO2–aNCNT – 89.2 and 99.2%, NTiO2–aNCNT – 42.9% and 82.6% | 22 |
| TiO2–aCNT, TiO2–aNCNT, NTiO2–aNCNT | Photocatalytic degradation of RR 120 (20 ppm) at 100 ppm catalyst loading | Dye removal efficiency at 60 min adsorption and 300 min photodegradation TiO2–aCNT – 98.2 and 99.9%, TiO2–aNCNT – 81.1 and 99.9% NTiO2–aNCNT – 18.9% and 99.9% | Current work |
4. Conclusions
This work has demonstrated that amorphous CNTs, which have been previously deemed to be of less value, can tailor the optical properties of TiO2 to enable visible light absorption through energy band gap reduction and visible light sensitization. In addition to this, these nanohybrids were synthesized through a simple and more reproducible microwave assisted hydrothermal method. The nanohybrids with the smallest particle size, narrowest particle size distribution, highest visible light sensitization, and lowest energy band gap were found to have the highest photocatalytic activity. The nanohybrids with a small particle size, good particle size dispersion but lower ability to absorb visible light have the highest adsorptive capacity and lowest degradation rate constant. Finally, these nanohybrids show a degree of photocatalytic activity for the degradation of organic pollutants in industrial wastewater. Herein, we present another step in the direction towards energy efficiency, and economic industrial wastewater treatment through photocatalysis. The small particle size, narrow particle size distribution and the intimate contact between TiO2 and the graphitic material from aCNTs makes the subject nanohybrids better suited for the fabrication of photocatalytic reactor membranes with fewer micropores at the TiO2 polymer interface. The formation of visible light absorbing intermediates also opens a niche for the use of these nanohybrids in the fabrication of photocatalytic membrane reactors that can drive reactions for the generation of potentially useful intermediates from wastewater.Conflicts of interest
There are no conflicts to declare.Acknowledgements
The authors would like to acknowledge the National Research Foundation for funding and the Institute for Nanotechnology and Water Sustainability of the University of South Africa for providing further funding and laboratory space for this work. Due appreciation goes to the Center for Sustainable Agriculture and Environmental Sciences of the University of South Africa for providing access to equipment for microwave synthesis. Lastly, our sincere gratitude to Ms Alice Magubane and Mr Victor Mashindi of the University of the Witwatersrand for assisting with CVD reactors for the synthesis of carbon nanotubes.References
- W. Fang, M. Xing and J. Zhang, J. Photochem. Photobiol., C, 2017, 32, 21–39 CrossRef CAS.
- G. J. Kavarnos and N. J. Turro, Chem. Rev., 1986, 86, 401–449 CrossRef CAS.
- V. Etacheri, C. Di Valentin, J. Schneider, D. Bahnemann and S. C. Pillai, J. Photochem. Photobiol., C, 2015, 25, 1–29 CrossRef CAS.
- J. L. Won, J. M. Lee, S. T. Kochuveedu, T. H. Han, H. Y. Jeong, M. Park, J. M. Yun, J. Kwon, K. No, D. H. Kim and S. O. Kim, ACS Nano, 2011, 6, 935–943 Search PubMed.
- B. Makgabutlane, L. N. Nthunya, M. S. Maubane-Nkadimeng and S. D. Mhlanga, J. Environ. Chem. Eng., 2020, 104736 Search PubMed.
- Y. Lin, S. Wu, C. Yang, M. Chen and X. Li, Appl. Catal., B, 2019, 245, 71–86 CrossRef CAS.
- P. Ayala, R. Arenal, M. Rümmeli, A. Rubio and T. Pichler, Carbon, 2010, 48, 575–586 CrossRef CAS.
- L. Acauan, A. C. Dias, M. B. Pereira, F. Horowitz and C. P. Bergmann, ACS Appl. Mater. Interfaces, 2016, 8, 16444–16450 CrossRef CAS.
- M. Terrones, A. G. Souza and A. M. Rao, in Carbon Nanotubes, ed. A. J. D. S. Dresselhaus, Springer Berlin Heidelberg, Berlin, Topics in Applied Physics, 2008, vol. 111, pp. 531–566 Search PubMed.
- S. D. Mhlanga, K. C. Mondal, R. Carter, M. J. Witcomb and N. J. Coville, S. Afr. J. Chem., 2009, 62, 67–76 CAS.
- T. Zhao, Y. Liu and J. Zhu, Carbon, 2005, 43, 2907–2912 CrossRef CAS.
- B. Bera, NanoTrends, 2019, 21(1), 36–52 CAS.
- D. Ganguly, D. Banerjee, B. Das, N. S. Das, U. K. Ghorai and K. K. Chattopadhyay, Mater. Res. Bull., 2019, 112, 307–313 CrossRef CAS.
- A. Rakitin, C. Papadopoulos and J. Xu, Phys. Rev. B: Condens. Matter Mater. Phys., 2000, 61, 5793–5796 CrossRef CAS.
- S. Sarkar, D. Banerjee, N. S. Das, U. K. Ghorai, D. Sen and K. K. Chattopadhyay, Phys. E, 2018, 97, 162–169 CrossRef CAS.
- L. Xu, Y. Zhang, X. Zhang, Y. Huang, X. Tan, C. Huang, X. Mei, F. Niu, C. Meng and G. Cheng, Bull. Mater. Sci., 2014, 37, 1397–1402 CrossRef CAS.
- L. Zhong, A. Tang, P. Yan, J. Wang, Q. Wang, X. Wen and Y. Cui, J. Colloid Interface Sci., 2019, 537, 450–457 CrossRef CAS.
- X. Zhou, L. Yu, X. Y. Yu and X. W. D. Lou, Adv. Energy Mater., 2016, 6, 1601177 CrossRef.
- T. Zhao, C. Hou, H. Zhang, R. Zhu, S. She, J. Wang, T. Li, Z. Liu and B. Wei, Sci. Rep., 2014, 4, 1–7 CrossRef.
- M. N. Ng and M. R. Johan, INEC 2010 - 2010 3rd Int. Nanoelectron. Conf. Proc., 2010, pp. 392–393 Search PubMed.
- J. Wang, C. Fan, Z. Ren, X. Fu, G. Qian and Z. Wang, Dalton Trans., 2014, 43, 13783–13791 RSC.
- S. A. Zikalala, R. Selvaraj, F. Al Marzouqi, A. T. Kuvarega, B. B. Mamba, S. D. Mhlanga and E. N. Nxumalo, J. Environ. Chem. Eng., 2020, 8(5), 104082 CrossRef CAS.
- T. Xia, W. Zhang, Z. Wang, Y. Zhang, X. Song, J. Murowchick, V. Battaglia, G. Liu and X. Chen, Nano Energy, 2014, 6, 109–118 CrossRef CAS.
- T. K. Han, L. B. Fen, N. M. Nee and M. R. Johan, Sci. World J., 2014, 2014, 847806 Search PubMed.
- S. Sarkar, D. Banerjee, N. S. Das and K. K. Chattopadhyay, Appl. Surf. Sci., 2015, 347, 824–831 CrossRef CAS.
- Y. Lin, C. Yang, S. Wu, X. Li, Y. Chen and W. L. Yang, Adv. Funct. Mater., 2020, 30, 1–13 Search PubMed.
- D. S. Dlamini, B. B. Mamba and J. Li, Sci. Total Environ., 2019, 656, 723–731 CrossRef CAS.
- Y. Zhao, Y. Tang and A. Star, J. Visualized Exp., 2013, 75, 1–7 Search PubMed.
- Z. N. Tetana, S. D. Mhlanga, G. Bepete and N. J. Coville, S. Afr. J. Chem., 2012, 65, 39–49 CAS.
- K. Chizari, I. Janowska, M. Houllé, I. Florea, O. Ersen, T. Romero, P. Bernhardt, M. J. Ledoux and C. Pham-Huu, Appl. Catal., A, 2010, 380, 72–80 CrossRef CAS.
- NIST Photoelectron Spectroscopy Database 20 Version 4.1, https://srdata.nist.gov/xps/, accessed 9 June 2019 Search PubMed.
- L. I. Johansson, H. I. P. Johansson and K. L. Håkansson, Phys. Rev. B: Condens. Matter Mater. Phys., 1993, 48, 14520–14523 CrossRef CAS.
- W. Li, R. Liang, A. Hu, Z. Huang and Y. N. Zhou, RSC Adv., 2014, 4, 36959 RSC.
- M. C. Biesinger, B. P. Payne, A. P. Grosvenor, L. W. M. Lau, A. R. Gerson and R. S. C. Smart, Appl. Surf. Sci., 2011, 257, 2717–2730 CrossRef CAS.
- J. E. Krzanowski and R. E. Leuchtner, J. Am. Ceram. Soc., 1997, 80, 1277–1280 CrossRef CAS.
- D. Wu, M. Long, W. Cai, C. Chen and Y. Wu, J. Alloys Compd., 2010, 502, 289–294 CrossRef CAS.
- S. A. Zikalala, A. T. Kuvarega, B. B. Mamba, S. D. Mhlanga and E. N. Nxumalo, Mater. Today Chem., 2018, 10, 1–18 CrossRef CAS.
- M.-Q. Yang, N. Zhang and Y. Xu, ACS Appl. Mater. Interfaces, 2013, 5, 1156–1164 CrossRef CAS.
- F. Tian, Y. Zhang, J. Zhang and C. Pan, J. Phys. Chem. C, 2012, 116, 7515–7519 CrossRef CAS.
- D. Ganguly, D. Pahari, N. S. Das, P. Howli, B. Das, D. Banerjee and K. K. Chattopadhyay, J. Electroanal. Chem., 2016, 778, 12–22 CrossRef CAS.
- F. Inoue, R. A. Ando and P. Corio, J. Raman Spectrosc., 2010, 42, 1379–1383 CrossRef.
- P. Corio, K. C. Silva, N. A. Soares, F. Inoue and J. J. Santos, Chem. Phys. Lett., 2019, 723, 96–101 CrossRef CAS.
- B. Choudhury and A. Choudhury, J. Lumin., 2013, 136, 339–346 CrossRef CAS.
- V. V. Kondalkar, S. S. Mali, N. B. Pawar, R. M. Mane, S. Choudhury, C. K. Hong, P. S. Patil, S. R. Patil, P. N. Bhosale and J. H. Kim, Electrochim. Acta, 2014, 143, 89–97 CrossRef CAS.
- M. V. Kurik, Phys. Status Solidi, 1971, 8, 9–45 CrossRef CAS.
- A. Kusior, M. Synowiec, K. Zakrzewska and M. Radecka, Crystals, 2019, 9, 163 CrossRef CAS.
- N. Kelaidis, A. Kordatos, S. R. G. Christopoulos and A. Chroneos, Sci. Rep., 2018, 8, 1–8 CrossRef CAS.
- W. S. Wang, D. H. Wang, W. G. Qu, L. Q. Lu and A. W. Xu, J. Phys. Chem. C, 2012, 116, 19893–19901 CrossRef CAS.
- E. Bazrafshan, F. K. Mostafapour, A. R. Hosseini, A. Raksh Khorshid and A. H. Mahvi, J. Chem., 2012, 2013, 1–8 Search PubMed.
- S. Ahirrao, in Industrial Wastewater Treatment, Recycling and Reuse, Elsevier Ltd., 2014, pp. 489–520 Search PubMed.
- K. Paździor, L. Bilińska and S. Ledakowicz, Chem. Eng. J., 2018, 120597 Search PubMed.
- C. Burgess, O. Thomas, V. Cerda, C. Gonzalez, E. Touraud, S. Spinelli, F. Theraulaz, B. Roig, M. Pouet, N. Azema, V. Mesnage, S. Vaillant, H. Descherf, E. Baures, J. Roussy, M. Domeizel and G. Junqua, UV-Visible spectrophotometry of water and wastewater, Elsevier, Amsterdam, 1st edn, 2007, vol. 27 Search PubMed.
- M. Joshi, R. Bansal and R. Purwar, Indian J. Fibre Text. Res., 2004, 29, 239–259 CAS.
- D. D. Phong and J. Hur, Water Res., 2015, 87, 119–126 CrossRef CAS.
- X. R. Xu, H. Bin Li, W. H. Wang and J. D. Gu, Chemosphere, 2004, 57, 595–600 CrossRef CAS.
- A. T. Kuvarega, N. Khumalo, D. Dlamini and B. B. Mamba, Sep. Purif. Technol., 2018, 191, 122–133 CrossRef CAS.
- G. Daneshvar Tarigh, F. Shemirani and N. S. Maz’hari, RSC Adv., 2015, 5, 35070–35079 RSC.
- N. Naffati, M. J. Sampaio, E. S. Da Silva, M. F. Nsib, Y. Arfaoui, A. Houas, J. L. Faria and C. G. Silva, Mater. Sci. Semicond. Process., 2020, 115, 105098 CrossRef CAS.
- Y. Lin, S. Wu, X. Li, X. Wu, C. Yang, G. Zeng, Y. Peng, Q. Zhou and L. Lu, Appl. Catal., B, 2018, 227, 557–570 CrossRef CAS.
- H. Li, G. Wang, X. Zhang and Z. Jin, Int. J. Hydrogen Energy, 2020, 45, 8405–8417 CrossRef CAS.
- S. Lanfredi, M. A. L. Nobre, P. S. Poon and J. Matos, Molecules, 2020, 25, 96–116 CrossRef CAS.
Footnote |
| † The spectra of the samples are named according to the stage and time at which each sample was collected i.e. adsorptive (A) for adsorption–desorption equilibration and photocatalytic (P) for degradation under illumination. The times at which the samples are collected at each stage are indicated in Arabic numerals. |
| This journal is © The Royal Society of Chemistry 2021 |

