 Open Access Article
Study on the decomposition mechanism and kinetic model of natural gas hydrate slurry in water-in-oil emulsion flowing systems
Xiaofang Lv *a,
Yang Liu*a,
Shidong Zhou
 a,
Bohui Shi
 b and
Kele Yanc
aJiangsu Key Laboratory of Oil and Gas Storage & Transportation Technology, Changzhou University, Changzhou, Jiangsu 213016, People's Republic of China. E-mail: lvxiaofang5@cczu.edu.cn; liu.y@cczu.edu.cn; Tel: +86-519-8329-0866
bNational Engineering Laboratory for Pipeline Safety, MOE Key Laboratory of Petroleum Engineering, Beijing Key Laboratory of Urban Oil and Gas Distribution Technology, China University of Petroleum-Beijing, Beijing 102249, People's Republic of China
cSINOPEC Research Institute of Safety Engineering, Qingdao, Shandong 266000, People's Republic of China
First published on 19th January 2021
Abstract
Hydrate slurry decomposition in flow systems is a significant subject that involves flow assurance and development of marine natural gas hydrates. Firstly, the decomposition mechanism of hydrate slurry is studied in this work, and it is proposed that desorption of the gas from the surface of the decomposed hydrate particles might be the main reason for the coalescence of particles and water droplets during the hydrate slurry decomposition. Secondly, a hydrate slurry decomposition kinetic model comprehensively considering the influencing factors (i.e., the intrinsic kinetics, heat and mass transfer) is proposed in this work, based on the classic intrinsic kinetic model and the hydrate slurry dissociation experiments conducted in a flow loop system. The fugacity difference is used as the driving force for the hydrate decomposition, and the influence of particle coalescence, and heat and mass transfer is also considered. The effect of the heat and mass transfer is coupled with the apparent decomposition reaction rate constant. Meanwhile, the time-dependent interfacial parameters would significantly impact on the hydrate dissociation rate, which are considered to enhance the predictive precision of the decomposition kinetic model. Further, the integrated decomposition kinetics model proposed in this paper could well describe the trends of the amount of released gas and the dissociation rate of the experimental flow systems. Through combining the experimental results of the hydrate slurry decomposition, the decomposition parameters under actual flowing conditions were obtained.
1. Introduction
Hydrates1,2 are polycrystalline, non-stoichiometric clathrates consisting of water molecules and small gas molecules, such as methane, ethane, CO2, etc., or relatively large hydrocarbon molecules, such as cyclopentane, neo hexane etc., wherein the water molecules form cages from hydrogen bonds and the gas or hydrocarbon molecules act as guest molecules wrapped inside them. Hammerschmidt3 discovered hydrate blockage in gas pipelines in 1934. With oil and gas resource exploitation going into deeper water, hydrate blockage has become a prominent issue in the flow assurance of the petroleum industry in recent decades.4 Hydrate decomposition is a process involving the deconstruction of the lattice, the desorption of the guest gas molecules and the diffusion of gas molecules from the bulk phase to gas phase.2,5,6 Research on the hydrate dissociation mechanisms is the key to managing the issues of hydrate blockage in flow systems,7 exploring deep-water hydrate resources,8–11 applying hydrate technology as gas media for gas storage and transportation,12 purification and separation,13–16 and developing hydrate slurry transportation technology.17–21Currently, most studies build their hydrate decomposition kinetics models considering such influencing factors as the intrinsic kinetics, heat and mass transfer, with an experimental basis in stirring vessels or static conditions. The model developing process generally experienced three stages: the initial intrinsic kinetics models, succeeding heat or mass transfer models, and later integrated models.
1.1. The intrinsic kinetics models
Kim22,23 was the first to propose an intrinsic kinetics model from methane hydrate decomposition experiments, which laid the foundation for the kinetics research of hydrate decomposition. Subsequent researchers have presented many intrinsic models24–27 based on the improvement and advancement of Kim's model. Clarke24 derived one-dimensional hydrate decomposition rate equation from Kim's model, considering the hydrate particle irregularity and distribution. Sun25 presented an available decomposition model to describe the condition above the freezing point, in which the decomposition rate decreased with time (as the decomposition reaction proceeded). This model balanced the calculation deviation from the constant interfacial area in Kim's model. Windmeier and Oellrich26,27 developed a theoretical model called Consecutive Desorption and Melting (CDM) model to estimate the rate of decomposition intrinsic kinetics. The CDM model presented that hydrate decomposition process comprised two steps: desorption of guest molecule followed by local solid body melting, which described the decomposition process from the microscopic aspect. Recently, Palodkar and Jana28,29 directly used the difference in the chemical potentials of the cavity-building water molecules in the liquid and hydrate phases as the hydrate dissociation driving force, and developed an intrinsic model considering the effect of salt irons and porous materials on hydrate decomposition. The abovementioned models ignored the effects of the heat and mass transfer.1.2. The heat or mass transfer models
Kamath30 took the heat transfer into account by analogizing the hydrate endothermic decomposition to the nucleate boiling phenomena. However, this model did not consider the effect of time on hydrate decomposition. Selim and Sloan31 described hydrate decomposition as a moving-boundary ablation process, then proposed a heat transfer kinetics model based on the heat conduction law of the one-dimensional infinite plane wall. This model only considered heat transfer in the non-decomposed hydrate zone by using the boundary moving rate to characterize the hydrate decomposition rate, which neglected the limitation of mass transfer on hydrate decomposition. On the other hand, through correlating the hydrate decomposition rate with the reduction in the thickness of the hydrate layer, Takeya32 established the mass balance equation of the hydrate surface, and built a mass transfer model considering the movement of hydrate interface.1.3. The integrated models
There are various degrees of difficulties in describing the hydrate decomposition process by merely considering a single controlling factor, thus an integrated model considering adequate dominating factors could more authentically simulate the dissociation process.6,33–35 Jamaluddin33 believed that the system pressure and mass transfer played an essential role in hydrate decomposition, and suggested that the heat transfer and intrinsic kinetics should also be considered. Therefore, Jamaluddin33 develop an integrated hydrate decomposition kinetics model, taking two significant rate-limiting factors, the mass and heat transfer, into consideration. Based on Jamaluddin's model, Goal34 proposed a decomposition model that regarded both the mass transfer and intrinsic kinetics as controlling factors. They supposed that the decomposition rate was controlled by the hydrate surface area and the over-pressure level (P–Peq), and the influence of the reaction order on the decomposition rate should be introduced. However, this model did not solve the problem involving time-dependent change in the phase interface parameters during the hydrate decomposition. Recently, Song et al.6 suggested that hydrate dissociation process could be divided into three microscopic steps: the desorption step of gas molecules, the collapse step of linked and basic cavities, and the diffusion step of gas molecules to the bulk phase. Statistical rate theory, interface response function and molecules diffusion theory were selected to explain the above three steps respectively. They developed a hydrate decomposition model considering intrinsic kinetics and mass transfer.In general, most of the parameters for the current decomposition models were obtained after simplification, which deviated from the actual decomposition process. There are relatively few kinetics mechanisms or model studies on hydrate slurry dissociation in a deep-water high-pressure flow system. The kinetic dissociation mechanism of hydrate slurry, the time-dependent problem of particle decomposition, agglomeration characteristics of dissociated particles, the heat- and mass-transfer mechanisms as well as the unsteady state of multiphase flow are not clearly revealed and still require further research, which greatly restrain the application and development of the decomposition kinetics model. Models developed recently6,26–29 have seldom considered all these mechanisms and characteristics. In this work, hydrate slurry was formed in W/O emulsion systems in a high-pressure flow loop, and dissociation experiments were conducted to investigate the hydrate decomposition mechanisms. Based on Kim's classic hydrate decomposition model,22,23 and with necessary simplifications for the abovementioned mechanisms and characteristics, a decomposition kinetic model for hydrate slurry flow systems was developed. Investigating the hydrate decomposition mechanisms and developing a decomposition kinetic model for slurry flow systems are the focus of this work, while results of hydrate formation of the flow systems can be found elsewhere.4,36
2. Experimental section
2.1. The high-pressure experimental flow loop
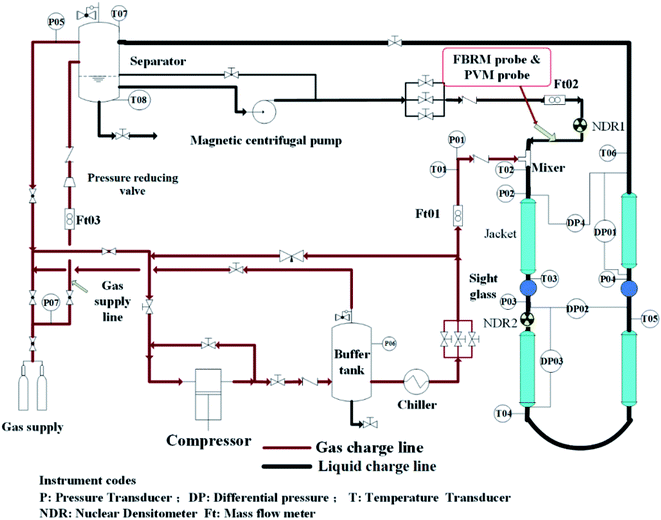
Experiments were carried out in the high pressure experimental loop for flow assurance studies. The schematic diagram is shown in Fig. 1. The 30 m long stainless steel test section consists of two rectilinear horizontal lengths joined together to form a pipe with 2.54 cm internal diameter, and a 5.08 cm diameter jacket circulating a water–glycol blend surrounded the test section. Operating temperature ranges from −20 °C to 100 °C. Natural gas and liquid phase were injected by a plunger compressor and a custom-made magnetic pump into the loop, respectively. It should be noted that the pump was designed to pose a minimal destructive impact on hydrates formed in the loop. For more details about the loop, please refer to our previous works.4,172.2. The instrumentation of hydrate experimental loop
A Focused Beam Reflectance Measurement (FBRM) probe and a Particle Video Microscope (PVM) probe were installed at the inlet of the test section, which allowed monitoring the evolution of objects, droplets, bubbles and solid particles that were carried inside the flow. Both the probes window cut the streamlines at a 45° angle, beginning at the center of the pipe. The FBRM and PVM probes were used to estimate the initial water droplet (Dp) size inside the fluid and to follow the hydrate particles agglomeration with the time. The mean square-weighted chord length could give more weight to the larger particles, so it is particularly well adapted to agglomeration phenomena.2.3. Fluids
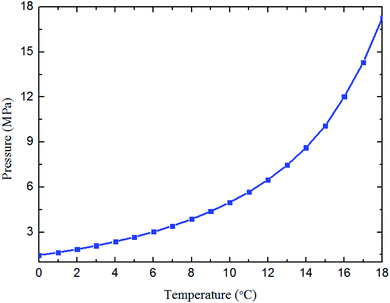
To better simulate the practical situation, deionized water, civil natural gas (Table 1) and diesel (Table 2) are employed for all the experiments. The electronic balance is used to weight the combined Anti-Agglomerants (AA) (with measuring error ±0.01 g). The mass ratio of AA to water phase can be adjusted to 1 wt%, 2 wt% and 3 wt%, through the high pressure piston pump. The type of combined AA provided by the Chemical Engineering Department at China University of Petroleum-Beijing is a mixture of sorbitan monolaurate (Span 20, C18H34O6, HLB = 8.6) and esters polymer.37 Span 20 serves as the emulsifier, and the polymer works as the effective anti-agglomerate. The natural gas hydrate formation curve (see Fig. 2) is obtained by the Chen–Guo model38 with the natural gas composition.| Composition | Mol% | Composition | Mol% |
|---|---|---|---|
| N2 | 1.53 | C3 | 3.06 |
| CO | 2.05 | iC4 | 0.33 |
| CO2 | 0.89 | iC5 | 0.04 |
| C1 | 89.02 | nC6+ | 0.01 |
| C2 | 3.07 | — | — |
| Composition | Mol% | Composition | Mol% |
|---|---|---|---|
| C11 | 0.89 | C16 | 6.83 |
| C12 | 3.36 | C17 | 7.99 |
| C13 | 5.38 | C18 | 7.46 |
| C14 | 6.2 | C19 | 6.38 |
| C15 | 6.78 | C20+ | 48.73 |
2.4. Experimental procedures
The specific procedures for one round of the hydrate formation and dissociation experiment was as follows:(1) Evacuate the entire experimental loop until the vacuum degree reaches 0.09 MPa.
(2) Load the diesel and water (100 vol% liquid loading) with a specific water-cut for each test. Here, water-cut was defined as the volume ratio of water to the total liquid. The diesel volume was fixed at 70 L for all experiments. The gas-supply unit began to inject gas into the separator at room temperature (20 °C) to reach the aimed experimental pressure.
(3) Circulate the water and oil mixture at a constant flow rate to form a homogeneous and stable emulsion with a specific AA dosage for each test. The stability of the water/oil emulsion was based off a relatively stable process (dynamic stability) according to the measured data from the FBRM under flow shear. The emulsion was regarded as stable when the average chord length of the water droplets fluctuated ±0.2 μm within 2 hours.
(4) Decrease the temperature gradually to a specific value under the initial pressure and flow velocity. Open the data acquisition system to continuously collect the temperature, pressure, pressure drop, flow rate, density, and the chord length, during the hydrate formation process.
(5) When the pressure, temperature and flow rate in the loop became stable, maintain the stable situation for at least 5 hours.
(6) To dissociate the hydrate slurry, heat the system at a constant volume using the bath system. Set the bath temperature to 30 °C and collect all data during the hydrate decomposition process.
(7) A round of hydrate formation and decomposition experiment is completed when all measured data are stable at the end of the hydrate decomposition process.
2.5. Description of the hydrate slurry decomposition process
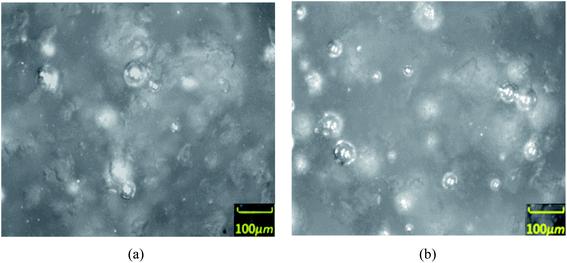
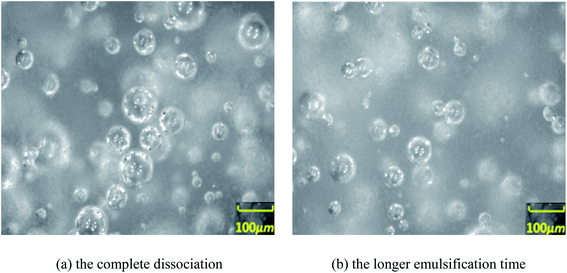
With the assistance of the PVM probe, the actual morphological changes and aggregation characteristic of the hydrate particles were obtained. Fig. 3–6 shows the morphology of the particles and their size distribution at different times during the dissociation process. In Fig. 3 before the hydrate dissociation, the particles are distributed in the flow system with irregular shapes. The hydrate slurry was easy to transport at this point in time. In Fig. 4 at the beginning of the dissociation, deconstruction of the hydrate lattice and desorption of the guest gas molecules occurred on the surfaces of hydrate particles, leading to shinning spots in the image captured by PVM probe. In Fig. 5 during the dissociation, hydrate particles would dissociate more thoroughly, resulting in better water wettability of the particle surface, more water droplets, and a rising agglomeration tendency. In other words, it was easier for “secondary aggregation” to occur, which could seriously influence the safety of the hydrate slurry transportation and should be evaded in the transportation technology. In Fig. 6 after complete dissociation, several water droplets were spread among the system, yet their size would decrease with a longer emulsification time, which again illustrated the agglomeration of hydrate particle and water droplet during the decomposition process.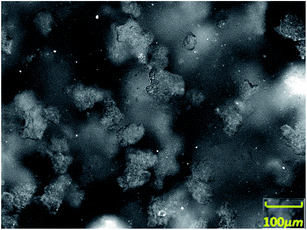 | ||
| Fig. 3 Image of the distribution of particles and water droplets before hydrate dissociation observed by PVM probe. | ||
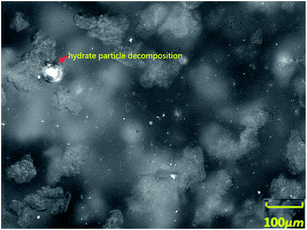 | ||
| Fig. 4 Image of the distribution of particles and water droplets at the beginning of hydrate dissociation observed by PVM probe. | ||
 | ||
| Fig. 5 Images of the distribution of particles and water droplets during hydrate dissociation (a and b) observed by PVM probe. (a) The complete dissociation (b) the longer emulsification time. | ||
 | ||
| Fig. 6 Images of the distribution of particles/droplets after hydrate dissociation (a and b) observed by PVM probe. | ||
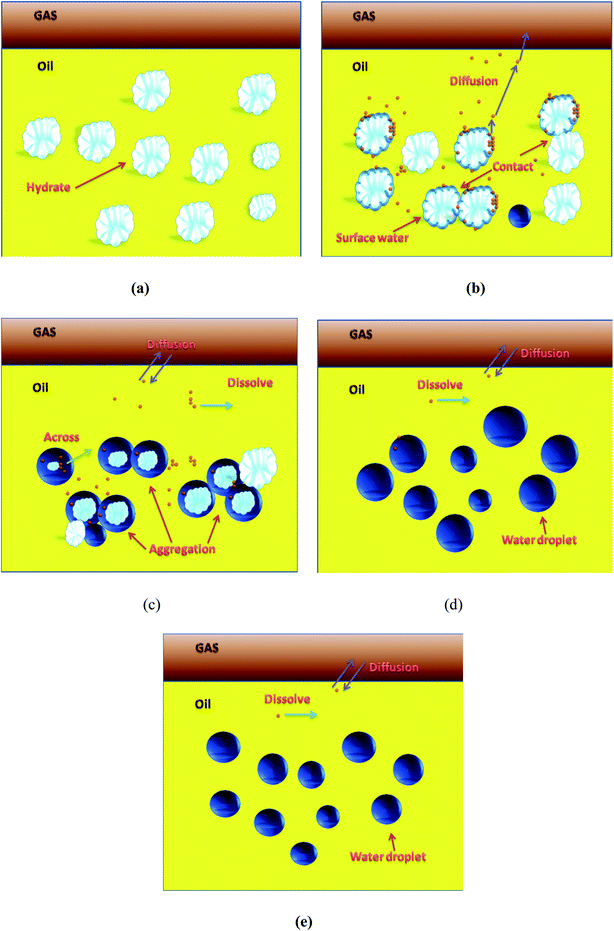
In other words, the morphology of the hydrate particles or droplets would change with time during the decomposition of hydrate slurry. Fig. 7 conceptually shows the decomposition kinetics process of hydrate slurry in the flow system. Before hydrate dissociation (Fig. 7a), the hydrate particles were distributed in the flow system as a function of AA, which could be regarded as stable slurry flow. Fig. 7b and c illustrate that the hydrate particles, dissociating particles and water droplets coexisted in the system with further decomposition, which gave rise to various collision forms among them. The cohesive force between particles and other particles as well as between particles and water droplets increased, resulting in a serious aggregation that increased the plugging tendency during the dissociation process and the destabilization of hydrate slurry. In the dissociation process, the probability of hydrate particle dissociation depended on the shape and size of particles, that is, different particles did not dissociate at the same time in the system. Fig. 7d showed that, after dissociation, the size of the water droplets in the system was larger than that of the particles before decomposition. Meanwhile, the water droplet size decreased with longer emulsification times, because the droplets were more evenly dispersed in the continuous phase, as shown in Fig. 7e.
The main reasons for the above microscopic particles and water droplets aggregation could be generally attributed to the capillary force and the collision between particles. However, during the process of hydrate slurry decomposition, it was determined that the gas was resolved from the surface of the decomposed hydrate particles, which would have a significant influence on the interfacial properties of the decomposition particles. Furthermore, it would destroy the surface properties of the decomposition hydrate particles, leading to coalescence between the adjacent particles. Based on this, it was proposed that desorption of the gas from the surface of the decomposition hydrate particles might be the main reasons for the coalescence of particles and water droplets during the hydrate slurry decomposition.
3. Hydrate slurry decomposition kinetic model
Hydrate slurry decomposition in the flow system is a complex, endothermic, system dependent process with multiple stages. Hydrate slurry decomposition is influenced by many factors such as intrinsic kinetics of hydrate dissociation, multiphase fluid mechanics, coalescence of particles and water droplets, mass and heat transfer, etc. However, most available models were developed based on the decomposition experiments in static vessels. The difference between the reaction vessels and flowing systems restricted the application scope of the decomposition mechanisms grasped from static conditions.Therefore, this paper proposed an integrated hydrate slurry decomposition kinetic model that comprehensively considers the influencing factors (i.e. the intrinsic kinetics, heat and mass transfer), based on the hydrate slurry dissociation mechanism and the results of decomposition kinetic experiments in pipeline systems. It should be noted that the genuine driving force for the hydrate decomposition is a chemical potential difference between old and new phases,2,28 which can be written as the fugacity difference under certain conditions.22,23,39 The model improved the intrinsic kinetic model of Kim,22,23 also used the fugacity difference as the driving force in the hydrate decomposition, and took the influence of particle coalescence, heat and mass transfer into account. Moreover, the heat and mass transfer factors in the actual pipeline system were introduced into the apparent decomposition reaction rate constant Kd. The effect of the coalescence of particles and water droplets was characterized by the interfacial area parameter in the decomposition process. The specific modelling process is shown as follows:
The hydrate decomposition intrinsic kinetic equation can be written as:22,23
 | (1) |
Then, the heat and mass transfer factors in the actual pipeline system are considered and introduced into the hydrate decomposition reaction rate constant Kd:
 | (2) |
Combining eqn (1) and (2), the hydrate slurry decomposition kinetic model for pipeline systems can be written as:
 | (3) |
At the same time, it can be determined from eqn (3) that the total superficial area parameter of the hydrate particles also plays an important role in hydrate slurry dissociation. The total superficial area parameter of the hydrate particles keeps changing as the decomposition reaction proceeds, which is difficult to predict due to the coupling process of the breakage and agglomeration of micro particles/droplets during decomposition. Therefore, the accurate real-time characterization of this parameter is the key point for ensuring the prediction accuracy of the hydrate decomposition kinetic model. On this basis, the relationship between the total superficial area parameter of the hydrate particles and the ratio of residual hydrate in the system is presented here. This relationship can thus give a real-time indication of the dynamic change of the reaction's superficial area in the decomposition process. From the above analysis, eqn (3) can be modified as:
 | (4) |
After a further simplification, eqn (5) shows that the hydrate slurry decomposition kinetic model comprehensively considers intrinsic kinetics, heat and mass transfer, and coalescence features.
 | (5) |
4. Simulation and prediction of the hydrate slurry decomposition kinetic model
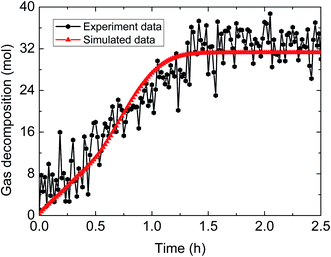
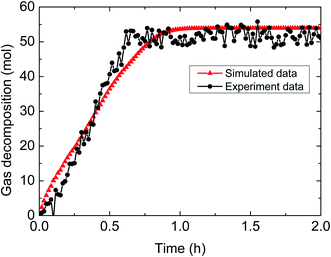
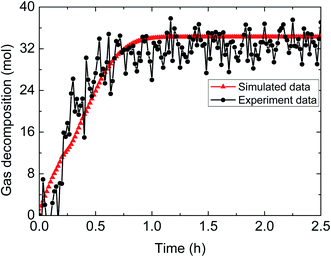
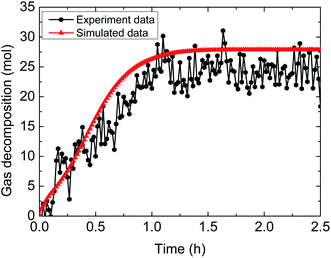
The hydrate decomposition kinetic process under various experimental conditions in the pipeline system was simulated, using the comprehensive decomposition kinetic model of hydrate slurry, which considered the intrinsic kinetics, heat and mass transfer, as well as particle agglomeration. The simulated results are shown in Fig. 8–13.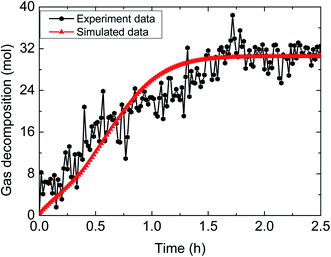 | ||
| Fig. 8 Comparison between experimental and simulated data (3% AA, 6.0 MPa, 0.6 m s−1 flow rate, 15% water-cut). | ||
 | ||
| Fig. 9 Comparison between experimental and simulated data (3% AA, 6.0 MPa, 1.0 m s−1 flow rate, 15% water-cut). | ||
 | ||
| Fig. 10 Comparison between experimental and simulated data (3% AA, 5.0 MPa, 1.0 m s−1 flow rate, 30% water-cut). | ||
 | ||
| Fig. 11 Comparison between experimental and simulated data (3% AA, 5.0 MPa, 1.0 m s−1 flow rate, 20% water-cut). | ||
 | ||
| Fig. 12 Comparison between experimental and simulated data (3% AA, 5.0 MPa, 1.0 m s−1 flow rate, 15% water-cut). | ||
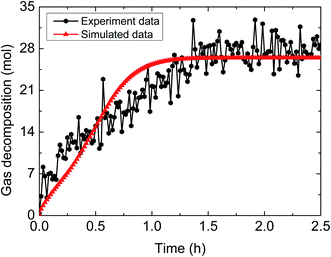 | ||
| Fig. 13 Comparison between experimental and simulated data (3% AA, 5.5 MPa, 1.0 m s−1 flow rate, 15% water-cut). | ||
The above comparisons between the simulated data and the experimental results indicate that the integrated model can characterize the trend of the amount of released gas during hydrate decomposition process. Table 3 tabulates the model parameters and calculation deviations under various experimental conditions. It can be seen in the table that the average absolute deviation between the simulated results and experimental results is within 22%.
| Water-cut (%) | Pressure (MPa) | Flow rate (m s−1) | Kd0 (mol (MPa−1 s−1 m−2)) | ΔE (J mol−1) | α0 | Absolute deviation (%) |
|---|---|---|---|---|---|---|
| 15 | 6.0 | 0.53 | 5.2 × 10¹⁰ | 64![[thin space (1/6-em)]](https://www.rsc.org/images/entities/char_2009.gif) 500 500 |
1.75 | 18.60 |
| 15 | 6.0 | 0.91 | 4.8 × 10¹⁰ | 64![[thin space (1/6-em)]](https://www.rsc.org/images/entities/char_2009.gif) 300 300 |
1.65 | 18.60 |
| 15 | 6.0 | 1.13 | 5.0 × 10¹⁰ | 64![[thin space (1/6-em)]](https://www.rsc.org/images/entities/char_2009.gif) 800 800 |
1.74 | 21.65 |
| 15 | 5.2 | 0.91 | 6.0 × 10¹⁰ | 64![[thin space (1/6-em)]](https://www.rsc.org/images/entities/char_2009.gif) 500 500 |
1.90 | 9.68 |
| 15 | 5.4 | 0.91 | 6.2 × 10¹⁰ | 64![[thin space (1/6-em)]](https://www.rsc.org/images/entities/char_2009.gif) 800 800 |
1.95 | 15.91 |
| 15 | 5.0 | 0.91 | 5.6 × 10¹⁰ | 64![[thin space (1/6-em)]](https://www.rsc.org/images/entities/char_2009.gif) 500 500 |
1.85 | 7.80 |
| 30 | 5.0 | 0.91 | 6.8 × 10¹⁰ | 56![[thin space (1/6-em)]](https://www.rsc.org/images/entities/char_2009.gif) 500 500 |
4.10 | 9.23 |
| 20 | 5.0 | 0.91 | 6.0 × 10¹⁰ | 63![[thin space (1/6-em)]](https://www.rsc.org/images/entities/char_2009.gif) 300 300 |
2.00 | 0.72 |
According to the simulation of the hydrate slurry dissociation in the pipeline system, the model parameters for the hydrate slurry decomposition kinetic model are obtained (see Table 3). Then, the amount of gas consumption under other operating conditions are predicted using the model parameters in Table 3. The details are shown in Fig. 14–16.
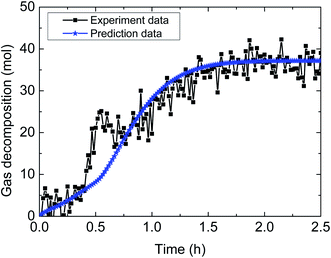 | ||
| Fig. 14 Comparison between experimental data and predicted results by the model (1% AA, 6.0 MPa, 0.6 m s−1 flow rate, 20% water-cut). | ||
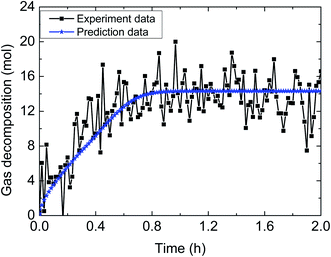 | ||
| Fig. 15 Comparison between experimental data and predicted results by the model (3% AA, 5.0 MPa, 1.2 m s−1 flow rate, 15% water-cut). | ||
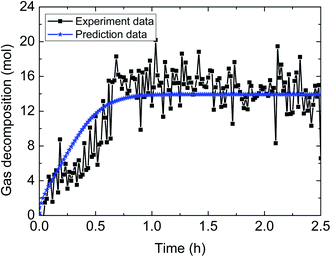 | ||
| Fig. 16 Comparison between experimental data and predicted results by the model (3% AA, 5.0 MPa, 0.6 m s−1 flow rate, 15% water-cut). | ||
Table 4 demonstrates the prediction deviation of the integrated model under different experimental conditions. Simulation of the hydrate decomposition kinetics provided the ability to predict for other experimental conditions, through correlating the simulation parameter values and existing experimental conditions. In general, the integrated model gives out simulated results with acceptable fitness to the experimental results of multiphase flow systems. The predictive deviation in Table 4 may originate from the insufficient consideration of other influencing factors, such as the unsteady state of multiphase flow (in other words, the fluid cannot be always regarded as hydrate slurry) as well as the difference of model parameter selection between static systems and flow systems. Therefore, it requires further experimentation and theoretical works to modify this model and enhance its predictive precision through comprehensively combination of intrinsic dynamics, heat transfer, mass transfer, mechanisms of multiphase flow and characteristics of particle agglomeration.
| Water-cut (%) | Pressure (MPa) | Flow rate (m s−1) | Kd0 (mol (MPa−1 s−1 m−2)) | ΔE (J mol−1) | α0 | Absolute deviation (%) |
|---|---|---|---|---|---|---|
| 15 | 5.0 | 0.60 | 6.0 × 10¹⁰ | 64![[thin space (1/6-em)]](https://www.rsc.org/images/entities/char_2009.gif) 500 500 |
3.70 | 22.00 |
| 15 | 5.0 | 1.20 | 5.8 × 10¹⁰ | 65![[thin space (1/6-em)]](https://www.rsc.org/images/entities/char_2009.gif) 000 000 |
3.60 | 16.61 |
| 20 | 6.0 | 0.60 | 5.6 × 10¹⁰ | 64![[thin space (1/6-em)]](https://www.rsc.org/images/entities/char_2009.gif) 300 300 |
1.98 | 14.17 |
5. Conclusions
(1) In the dissociation process, the probability of hydrate particle dissociation depended on the shape and size of particles.(2) During the hydrate dissociation process, gas molecules were released from the surface of the decomposed hydrate particles, while water molecules render better wettability of the particle surface, leading to “secondary aggregation” that significantly increases pipeline plugging tendency.
(3) The hydrate slurry decomposition kinetic model was able to account for the influence of heat and mass transfer. Then, the heat and mass transfer factors in the actual pipeline system were introduced into the hydrate decomposition reaction rate constant, which built the relationship between the total superficial area parameter of hydrate particles and the ratio of the residual hydrate in the system. This relationship can thus give a real-time indication of the dynamic change of the reaction's superficial area in the decomposition process.
(4) The total initial superficial area of the hydrate particles could be determined by the chord length distribution of hydrate particles under real-time in situ condition.
(5) The integrated decomposition kinetics model proposed in this paper could well describe the trends of the amount of released gas and the dissociation rate during hydrate decomposition. Meanwhile, the decomposition parameters under actual flowing conditions were obtained, through combining the experimental results of the hydrate slurry decomposition. The simulated results of the integrated model were verified by experimental data, with an average absolute deviation within 22% of the acceptable range.
Conflicts of interest
There are no conflicts to declare.Acknowledgements
This work was supported by the National Natural Science Foundation of China (Grant No. 51804046, 52004039, 51904330 & 51974037), PetroChina Innovation Foundation (Grant No. 2018D-5007-0602) and Natural Science Research Project of Jiangsu Colleges and Universities (Grant No. 18KJB440001).References
- E. D. Sloan, C. A. Koh, A. K. Sum, et al., Natural gas hydrates in flow assurance, Gulf Professional Publishing, 2010 Search PubMed.
- E. D. Sloan and C. A. Koh, Clathrate hydrates of natural gases, Taylor & Francis Group, New York, 2007 Search PubMed.
- T. Hammerschmidt, Formation of gas hydrates in natural gas transmission lines, Ind. Eng. Chem., 1934, 26(8), 851–855 CrossRef.
- X. F. Lv, B. H. Shi and Y. Wang, et al., Study on gas hydrate formation and hydrate slurry flow in multiphase transportation system, Energy Fuels, 2013, 27(12), 7294–7302 CrossRef CAS.
- S. Takeya and J. A. Ripmeester, Dissociation behavior of clathrate hydrates to ice and dependence on guest molecules, Angew. Chem., Int. Ed., 2008, 47, 1276–1279 CrossRef CAS.
- S. F. Song, B. H. Shi and W. C. Yu, et al., A new methane hydrate decomposition model considering intrinsic kinetics and mass transfer, Chem. Eng. J., 2019, 361, 1264–1284 CrossRef CAS.
- Y. Sohn, J. Kim and K. Shin, et al., Hydrate plug formation risk with varying water-cut and inhibitor concentrations, Chem. Eng. Sci., 2015, 126, 711–718 CrossRef CAS.
- X. S. Li, C. G. Xu and Y. Zhang, et al., Investigation into gas production from natural gas hydrate: a review, Appl. Energy, 2016, 172, 286–322 CrossRef CAS.
- X. S. Li and Y. Zhang, Study on dissociation behaviors of methane hydrate in porous media based on experiments and fractional dimension shrinking-core model, Ind. Eng. Chem. Res., 2011, 50(13), 8263–8271 CrossRef CAS.
- X. K. Ruan, M. J. Yang and Y. C. Song, et al., Numerical studies of hydrate dissociation and gas production behavior in porous media during depressurization process, J. Nat. Gas Chem., 2012, 21(4), 381–392 CrossRef CAS.
- Y. C. Song, L. Yang and J. Zhao, et al., The status of natural gas hydrate research in China: a review, Renewable Sustainable Energy Rev., 2014, 31, 778–791 CrossRef CAS.
- H. P. Veluswamy, A. Kumar and K. Premasinghe, et al., Effect of guest gas on the mixed tetrahydrofuran hydrate kinetics in a quiescent system, Appl. Energy, 2017, 207, 573–583 CrossRef CAS.
- S. Li, S. Fan and J. Wang, et al., CO2 capture from binary mixture via forming hydrate with the help of tetra-n-butyl ammonium bromide, J. Nat. Gas Chem., 2009, 18(1), 15–20 CrossRef CAS.
- Y. Kamata, Y. Yamakoshi and T. Ebinuma, et al., Hydrogen sulfide separation using tetra-n-butyl ammonium bromide semi-clathrate (TBAB) hydrate, Energy Fuels, 2005, 19(4), 1717–1722 CrossRef CAS.
- S. P. Kang and H. Lee, Recovery of CO2 from flue gas using gas hydrate: thermodynamic verification through phase equilibrium measurements, Environ. Sci. Technol., 2000, 34(20), 4397–4400 CrossRef CAS.
- Z. Xia, S. Li and Z. Chen, et al., Hydrate-based acidic gases capture for clean methane with new synergic additives, Appl. Energy, 2017, 207, 584–593 CrossRef CAS.
- X. F. Lv, J. Gong and W. Q. Li, et al., Experimental study on natural-gas-hydrate-slurry flow, SPE J., 2014, 19(2), 206–214 CrossRef.
- K. L. Yan, C. Y. Sun and J. Chen, et al., Flow characteristics and rheological properties of natural gas hydrate slurry in the presence of anti-agglomerant in a flow loop apparatus, Chem. Eng. Sci., 2014, 106, 99–108 CrossRef CAS.
- B. Z. Peng, J. Chen and C. Y. Sun, et al., Flow characteristics and morphology of hydrate slurry formed from (natural gas + diesel oil/condensate oil + water) system containing anti-agglomerant, Chem. Eng. Sci., 2012, 84, 333–344 CrossRef CAS.
- B. H. Shi, S. Chai and L. Y. Wang, et al., Viscosity investigation of natural gas hydrate slurries with anti-agglomerants additives, Fuel, 2016, 185, 323–338 CrossRef CAS.
- S. V. Joshi, G. A. Grasso and P. G. Lafond, et al., Experimental flow loop investigations of gas hydrate formation in high water cut systems, Chem. Eng. Sci., 2013, 97, 198–209 CrossRef CAS.
- H. C. Kim, A kinetic study of methane hydrate decomposition, The University of Calgary, Calgary, 1985 Search PubMed.
- H. C. Kim, P. R. Bishnoi and R. A. Heidemann, et al., Kinetics of methane hydrate decomposition, Chem. Eng. Sci., 1987, 42(7), 1645–1653 CrossRef CAS.
- M. Clarke and P. R. Bishnoi, Determination of the intrinsic rate of ethane gas hydrate decomposition, Chem. Eng. Sci., 2000, 55(21), 4869–4883 CrossRef CAS.
- C. Y. Sun, The kinetics of hydrate formation/dissociation and related topics, China University of Petroleum (Beijing), Beijing, 2001 Search PubMed.
- C. Windmeier and L. Oellrich, Theoretical study of gas hydrate decomposition kinetics-model development, J. Phys. Chem. A, 2013, 117(40), 10151–10161 CrossRef CAS.
- C. Windmeier and L. Oellrich, Theoretical study of gas hydrate decomposition kinetics-model predictions, J. Phys. Chem. A, 2013, 117(47), 12184–12195 CrossRef CAS.
- A. V. Palodkar and A. K. Jana, Growth and decomposition mechanism of clathrate hydrates in the presence of porous media and seawater: experimental validation, Energy Fuels, 2019, 33(2), 1433–1443 CrossRef CAS.
- A. V. Palodkar and A. K. Jana, Clathrate hydrate dynamics with synthetic-and bio-surfactant in porous media: model formulation and validation, Chem. Eng. Sci., 2020, 213, 115386 CrossRef CAS.
- V. A. Kamath and G. D. Holder, Dissociation heat transfer characteristics of methane hydrates, AIChE J., 1987, 33(2), 347–350 CrossRef CAS.
- M. S. Selim and E. D. Sloan, Heat and mass transfer during the dissociation of hydrate in porous media, AIChE J., 1989, 6(35), 1049–1052 CrossRef.
- S. Takeya, W. Shimada and Y. Kamata, et al., In situ X-ray diffraction measurements of the self-preservation effect of CH4 hydrate, J. Phys. Chem. A, 2001, 105(42), 9756–9759 CrossRef CAS.
- M. Jamaluddin, N. Kalogerakis and P. R. Bishnoi, Modelling of decomposition of a synthetic core of methane gas hydrate by coupling intrinsic kinetics with heat transfer rates, Can. J. Chem. Eng., 1989, 6(67), 948–954 CrossRef.
- N. Goal, M. Wiggins and S. Shah, Analytical modeling of gas recovery from in situ hydrates dissociation, J. Pet. Sci. Eng., 2001, 29, 115–127 CrossRef.
- Z. Yin, Z. Chong and H. Tan, et al., Review of gas hydrate dissociation kinetic models for energy recovery, J. Nat. Gas Sci. Eng., 2016, 35, 1362–1387 CrossRef CAS.
- B. H. Shi, J. Gong and C. Y. Sun, et al., An inward and outward natural gas hydrates growth shell model considering intrinsic kinetics, mass and heat transfer, Chem. Eng. J., 2011, 171(3), 1308–1316 CrossRef CAS.
- J. Chen, J. Liu and G. J. Chen, et al., Insights into methane hydrate formation, agglomeration, and dissociation in water + diesel oil dispersed system, Energy Convers. Manage., 2014, 86, 886–891 CrossRef CAS.
- G. J. Chen and T. M. Guo, A new approach to gas hydrate modelling, Chem. Eng. J., 1998, 71(2), 145–151 CrossRef CAS.
- V. Natarajan, P. R. Bishnoi and N. Kalogerakis, Induction phenomena in gas hydrate nucleation, Chem. Eng. Sci., 1994, 49(13), 2075–2087 CrossRef CAS.
- X. F. Lv, B. H. Shi and S. D. Zhou, et al., Study on the Decomposition Mechanism of Natural Gas Hydrate Particles and Its Microscopic Agglomeration Characteristics, Appl. Sci., 2018, 8(12), 2464 CrossRef CAS.
| This journal is © The Royal Society of Chemistry 2021 |

