
 Open Access Article
 This Open Access Article is licensed under a Creative Commons Attribution-Non Commercial 3.0 Unported Licence
Preparing, optimising, and evaluating chitosan nanocapsules to improve the stability of anthocyanins from Aronia melanocarpa†
Mingyue Wanga,
Li Lia,
Meizhi Wana,
Yang Linb,
Yuqi Tonga,
Yanmin Cuia,
Haotian Denga,
Chang Tana,
Yanwen Konga and
Xianjun Meng *a
*a
aCollege of Food, Shenyang Agricultural University, No. 120 Dongling Road, Shenhe District, Shenyang City 110866, People's Republic of China
bDepartment of Food Science and Technology, Zhejiang University of Technology, Hangzhou 310014, Zhejiang, People's Republic of China
First published on 23rd December 2020
Abstract
The anthocyanins extracted from Aronia melanocarpa are of great interest because of their potential health-related functionalities. However, their poor stabilities have limited their use in applications. Hence, to improve their physical and oxidative stability, we optimised the chitosan nanocapsules encapsulating anthocyanins from Aronia melanocarpa, and evaluated the systems in terms of their physicochemical characteristics, physical and oxidant stability in simulated gastrointestinal digestion and different storage environments. Results show that the obtained nanocapsules present favorable particle size (197 nm) with good surface morphology, highly encapsulation efficiency (65.7%), suitable zeta potential (+42.7 mV), and low polydispersity index (0.032). Furthermore, compared with free anthocyanins, the nanoencapsulated anthocyanins exhibited significantly slower degradation and stronger antioxidant activity during the simulated gastrointestinal digestion and environmental storage. Thus, the physical and oxidative stability of anthocyanins in Aronia melanocarpa was enhanced significantly by chitosan nanoencapsulation.
1 Introduction
Aronia melanocarpa, a shrub also known as the black chokeberry, has been reported to be a rich source of plant anthocyanins (ANT). ANT are known for their biological activity toward reducing chronic diseases such as diabetes, obesity, heart and circulatory diseases, nervous system disorders, and cancer.1–4 However, ANT are highly sensitive to environmental and chemical factors such as temperature, exposure to oxygen, light and enzymatic degradation, all of which limit the use of ANT in food applications.5,6To enhance their physical and oxidative stability, it is therefore demonstrated that nanoencapsulation techniques could protect the ANT from environmental and gastrointestinal degradation.7,8 However, different plant has their different ANT composition, it is necessary to verify whether the chosen delivery system will benefit to obtain nanocapsules capable of improving their stability.
Chitosan (CS) has received significant attention for use as a biopolymer in nanoencapsulation drug delivery. This natural polysaccharide is obtained from crustacean shells via the deacetylation of chitin and is considered particularly attractive as a wall material for nanoencapsulation owing to its biodegradability, biocompatibility, and lack of toxicity.9 Because CS is a cationic polymer, it can be cross-linked with the negatively charged groups of polyanions such as tripolyphosphate (TPP). TPP is commonly used as a cross-linking agent in ionic gelation because it is non-toxic, does not require organic solvents, and is readily controllable during the linking process.10,11
To date, the ionic cross-linking of CS with TPP, both food-safe compounds, has been applied to the delivery and encapsulation of proteins, genes, drugs, vitamins, and various phenolic compounds.12 However, to the best of our knowledge, there is no reported study on the nanoencapsulation of ANT extracted from Aronia melanocarpa.
Therefore, our study focused on the preparation and optimisation of nanocapsules to create a delivery system for ANT extracts from Aronia melanocarpa. The optimum nanoencapsulation conditions were modeled using a Box–Behnken design (BBD) based on response surface methodology (RSM) toward minimizing nanoparticle size and maximizing encapsulation efficiency (EE). The obtained nanoparticles were characterized by particle size and zeta potential analysis, transmission electron microscopy (TEM), and Fourier-transform infrared (FT-IR) spectroscopy. Moreover, we examined the effects of in vitro digestion, storage and light on the physical and oxidative stability of nanocapsules compared to free anthocyanins.
2 Materials and methods
2.1 Materials
Fresh Aronia melanocarpa was harvested in September 2019 and obtained from the Liaoning Fu KangYuan Black Chokeberry Technology (40°47′41′′N, 122°40′42′′E, Haicheng, Liaoning, China). Medium molecular weight CS (deacetylation degree: 75–85%) and TPP were purchased from Sigma–Aldrich (Steinheim, Germany). 2,2-Diphenyl-1-picrylhydrazyl (DPPH), acetonitrile, formic acid and potassium ferricyanide were purchased from Dingguo Biological Technology Co., Ltd. (Shenyang, Liaoning, China).2.2 Extracting the anthocyanins
The anthocyanins extraction and purification steps were performed according to the method developed by Meng et al. with some modifications.13 Prior to use, the samples were stored at −80 °C in an ultralow-temperature freezer. Next, 500 g of Aronia melanocarpa was washed and homogenised using a juicer. The samples were then extracted with 55% (v/v) ethanol with 0.1 vol% HCl at 45 °C for 90 min, with a 1![[thin space (1/6-em)]](https://www.rsc.org/images/entities/char_2009.gif) :44 material-to-solvent ratio, in an ultrasonication bath (KQ-700DV, Kunshan Ultrasonic Instruments, Jiangsu, China) at 400 W. The extraction solvent was removed by rotary evaporation (RE-5203A, Shanghai Bilon Instruments, Shanghai, China) at 45 °C until no alcohol remained in the sample, and the remaining anthocyanins extract was purified by NKA-9 absorbent resin (Beijing Solarbio Science and Technology Co., Ltd., Beijing, China). The obtained purified anthocyanins extract was lyophilised in a vacuum freeze-dryer. Then anthocyanins extract was further purified by semipreparative reverse-phase high-performance liquid chromatography (RPLC). All of anthocyanins absorption peaks were collected in a fraction collector. The extraction solvent was removed using rotary evaporation, and then the compounds were freeze-dried.
:44 material-to-solvent ratio, in an ultrasonication bath (KQ-700DV, Kunshan Ultrasonic Instruments, Jiangsu, China) at 400 W. The extraction solvent was removed by rotary evaporation (RE-5203A, Shanghai Bilon Instruments, Shanghai, China) at 45 °C until no alcohol remained in the sample, and the remaining anthocyanins extract was purified by NKA-9 absorbent resin (Beijing Solarbio Science and Technology Co., Ltd., Beijing, China). The obtained purified anthocyanins extract was lyophilised in a vacuum freeze-dryer. Then anthocyanins extract was further purified by semipreparative reverse-phase high-performance liquid chromatography (RPLC). All of anthocyanins absorption peaks were collected in a fraction collector. The extraction solvent was removed using rotary evaporation, and then the compounds were freeze-dried.
2.3 Determining anthocyanins content
The anthocyanins content was determined using the pH-differential method as the cyaniding-3-glucoside equivalents using the following equation:| Anthocyanins content, mg L−1) = (ΔA × M × F × 103)/ε × 1 | (1) |
900; 1 = path length in cm.
The anthocyanins were qualified and quantified by HPLC-DAD-ESI-MS2 and found to contain cyanidin-3-O-galactoside, cyanidin-3-O-arabinoside, cyanidin-3-O-glucoside, and cyanidin-3-O-xyloside (ESI). The total concentration of anthocyanins in Aronia melanocarpa was 938.72 mg g−1.
2.4 Preparing the nanocapsules
Nanocapsules were formed using the ionic gelation method.14 Briefly, CS was dissolved in a 1 vol% aqueous acetic acid solution to concentrations of 1.5–3.5 mg mL−1. TPP was then dissolved in distilled water to concentrations of 0.5–1.5 mg mL−1. CS void nanoparticles were formed by adding the TPP solution dropwise to the CS solution under magnetic stirring (7200 rpm, 1 h). The final pH of the mixed solution was adjusted to 4.6–4.8 using 0.5 mol L−1 NaOH. For the nanoencapsulation of A. melanocarpa ANT, the amount of ANT (3–9 mg) in methanol was prepared and slowly dripped into the CS solution with continuous stirring (7200 rpm) at room temperature (25 °C). After 10 min of ANT addition, the TPP solution was added dropwise into the mixture. To remove unencapsulated ANT, the system was dialyzed against distilled water for 3 h using a dialysis bag (molecular weight cutoff = 8000 Da). Subsequently, the system was vacuum freeze-dried for 24 h to obtain the ANT-NPs (ANT nanocapsules).2.5 RSM optimisation design
To elucidate the influence of various variables and optimum preparation conditions, a three-factor, three-level BBD based on RSM was used with Design-Expert software (version 8.0.6, Stat-Ease, Minneapolis, MN, USA). The response surface regression model was fitted to correlate the relationships between responses and independent variables using the following second-order polynomial equation:
 | (2) |
2.6 Determining encapsulation efficiency
EE was determined by separating the non-entrapped ANT by centrifugation at 10000g and 4 °C for 10 min. All measurements were performed in triplicate. EE was calculated as follows:| EE (%) = (total anthocyanins content − free anthocyanins content)/ (total anthocyanins content) × 100. | (3) |
2.7 Characterizing the nanocapsules
Particle size, zeta potential, and polydispersity index (PDI) were measured with a Zetasizer Nano ZS 90 instrument (Malvern Instruments, Malvern, UK) using the dynamic light scattering (DLS) technique at a fixed scattering angle of 90° at 25 ± 1 °C.
2.8 Physical and oxidative stability of nanocapsules
The physical stabilities of the free ANT and ANT-NPs were determined by measuring changes in retention rates. The oxidative stabilities of the non-loaded NPs, ANT-NPs, and free ANT were examined using DPPH and FRAP assays.| DPPH scavenging activity (%) = (Ac − As)/Ac × 100. | (4) |
In which Ac is the absorbance of the control and As represents the absorbance of the test sample.
| retention rate (%) = Ct/C0 × 100 | (5) |
2.9 Statistical analysis
All experiments were performed at a minimum of three times. Statistical analysis during the optimisation of the ANT-NPs was performed by analysis of variance (ANOVA) using Design-Expert software. LSD and Duncan's comparison was carried out to determine significant differences (p < 0.05) using SPSS software (version 19.0, SPSS, Chicago, IL, USA).3 Results and discussion
3.1 RSM design
| Run | Independent variables | Responses | |||
|---|---|---|---|---|---|
| X1 | X2 | X3 | Y1 | Y2 | |
| a X1: chitosan concentration (mg mL−1); X2: sodium tripolyphosphate concentration (mg mL−1); X3: anthocyanins amount (mg); Y1: particle size (nm); Y2: encapsulation efficiency (%). | |||||
| 1 | 3.5 | 1.5 | 6 | 299 | 53.4 |
| 2 | 2.5 | 1.5 | 3 | 384 | 55.3 |
| 3 | 2.5 | 0.5 | 3 | 280 | 44.3 |
| 4 | 1.5 | 1 | 9 | 664 | 40.5 |
| 5 | 3.5 | 0.5 | 6 | 263 | 51.5 |
| 6 | 1.5 | 0.5 | 6 | 419 | 37.9 |
| 7 | 2.5 | 1 | 6 | 220 | 65.8 |
| 8 | 3.5 | 1 | 3 | 342 | 50.2 |
| 9 | 1.5 | 1 | 3 | 447 | 49.6 |
| 10 | 2.5 | 1 | 6 | 237 | 62.7 |
| 11 | 2.5 | 1 | 6 | 197 | 63.9 |
| 12 | 2.5 | 0.5 | 9 | 255 | 46.1 |
| 13 | 3.5 | 1 | 9 | 271 | 57.8 |
| 14 | 2.5 | 1.5 | 9 | 546 | 41.4 |
| 15 | 2.5 | 1 | 6 | 209 | 64.4 |
| 16 | 1.5 | 1.5 | 6 | 611 | 59.1 |
| 17 | 2.5 | 1 | 6 | 203 | 60.1 |
| Factor | Particle size (nm) | Encapsulation efficiency (%) | ||||||||
|---|---|---|---|---|---|---|---|---|---|---|
| Sum of squares | df | Mean square | F-value | p-Value | Sum of squares | df | Mean square | F-value | p-Value | |
| a X1: chitosan concentration (mg mL−1); X2: sodium tripolyphosphate concentration (mg mL−1); X3: amount of anthocyanins (mg); Y1: particle size (nm); Y2: encapsulation efficiency (%); CV: coefficient of variation; R2: coefficient of determination. **significant p < 0.01. *significant p < 0.05. ns: not significant p > 0.05. | ||||||||||
| Model | 3.402 × 10⁵ | 9 | 37799.71 |
57.45 | <0.0001** | 1205.84 | 9 | 133.98 | 11.69 | 0.0019** |
| X1 | 1.663 × 10⁵ | 1 | 1.663 × 10⁵ | 252.76 | <0.0001** | 190.16 | 1 | 190.16 | 16.59 | 0.0047** |
| X2 | 50570.08 |
1 | 50570.08 |
76.86 | <0.0001** | 197.64 | 1 | 197.64 | 17.25 | 0.0043** |
| X3 | 27170.08 |
1 | 27170.08 |
41.30 | 0.0004** | 76.51 | 1 | 76.51 | 6.68 | 0.0363* |
| X12 | 65552.84 |
1 | 65552.84 |
99.63 | <0.0001** | 108.55 | 1 | 108.55 | 9.47 | 0.0179* |
| X22 | 15170.53 |
1 | 15170.53 |
23.06 | 0.0020** | 257.98 | 1 | 257.98 | 22.51 | 0.0021** |
| X32 | 36436.42 |
1 | 36436.42 |
55.38 | 0.0001** | 324.40 | 1 | 324.40 | 28.31 | 0.0011** |
| X1X2 | 6084.00 | 1 | 6084.00 | 9.25 | 0.0188* | 93.12 | 1 | 93.12 | 8.13 | 0.0247* |
| X1X3 | 20736.00 |
1 | 20736.00 |
31.52 | 0.0008** | 69.72 | 1 | 69.72 | 6.08 | 0.0430* |
| X2X3 | 8742.25 | 1 | 8742.25 | 13.29 | 0.0082** | 61.62 | 1 | 61.62 | 5.38 | 0.0535ns |
| Lack of fit | 3608.75 | 3 | 1202.92 | 4.83 | 0.0812ns | 61.83 | 3 | 20.61 | 4.48 | 0.0906ns |
| Pure error | 996.80 | 4 | 249.20 | 18.39 | 4 | 4.60 | ||||
| CV | 7.46 | 6.37 | ||||||||
| R2 | 0.9866 | 0.9376 | ||||||||
| Particle size = 304.77 − 122.76X1 + 97.38X2 + 71.38X3 − 19.50X1X2 − 36.00X1X3 + 46.75X2X3 + 31.19X12 + 60.02X22 + 93.02X32 | (6) |
 | ||
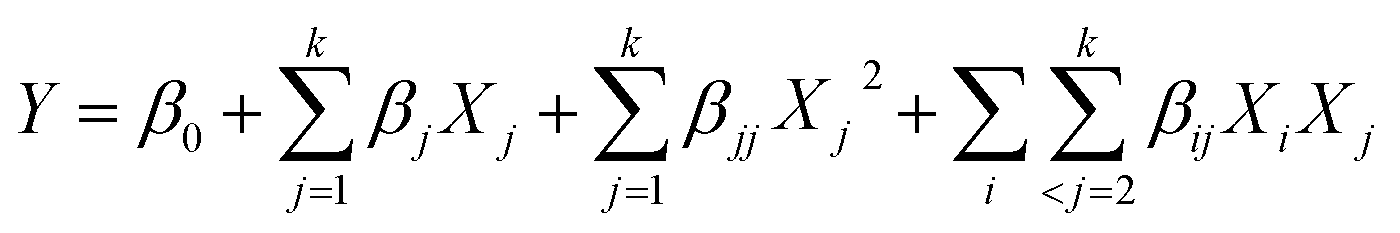
| Fig. 1 3D-response surface plots illustrating the effect of independent variables on particle size (nm) and encapsulation efficiency (EE, %): (A and D) chitosan (CS) and tripolyphosphate (TPP); (B and E) TPP and anthocyanins (ANT); and (C and F) CS and ANT. | ||
 | ||
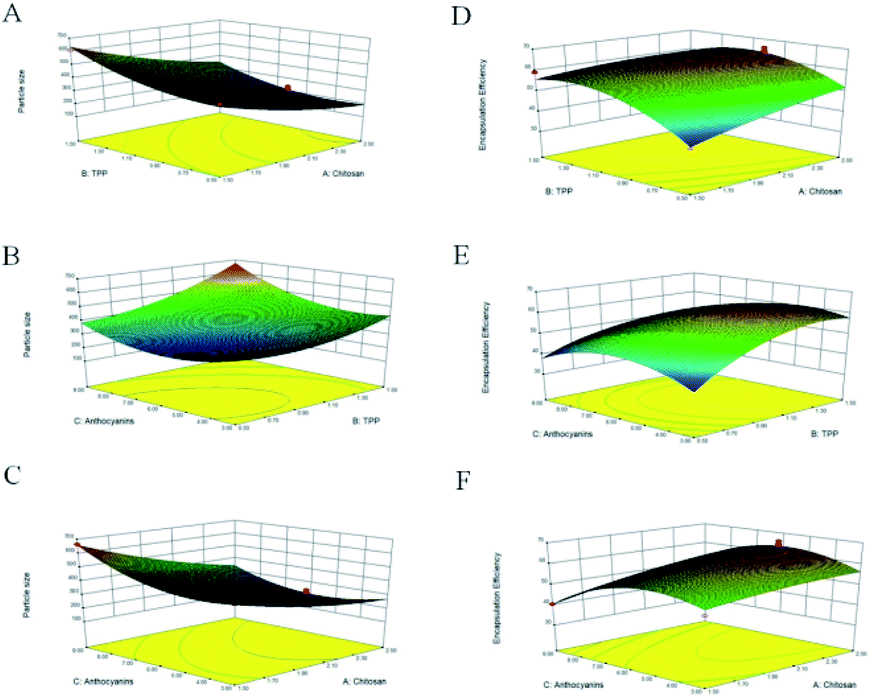
| Fig. 2 TEM images of (A and B) non-loaded nanocapsules and (C and D) ANT-NPs. | ||
Through regression analysis, the results (Table 2) revealed that particle size was affected significantly by X1, X2, and X3 at the p < 0.01 level. The secondary terms, namely X12, X22, and X32, were statistically significant at the p < 0.01 level, and the effects of both X1X3 and X2X3 were determined to be more significant than that of X1X2 at the p < 0.01 level. As illustrated, particle size fell in the 197–664 nm range and decreased with increasing CS (X1) and TPP (X2) concentrations to the midpoint of the response plot, above which particle size increased. Lower concentrations of either CS or TPP led to the formation of small nanocapsules. Similar results were observed in a study on the microencapsulation of lung proteins by Grenha et al.,21 who reported that particle size increased with increasing amount of added CS solution, which was attributed to the higher CS concentration that causes strong hydrogen bonding interactions and thereby hinders the formation of small nanoparticles with TPP.
The second-order polynomial equation expressed by eqn (7) and the corresponding 3D response surfaces (Fig. 1E–G) illustrate the interaction of each independent variable with EE.
| EE = 60.50 + 4.15X1 + 6.09X2 − 3.79X3 − 2.41X1X2 + 2.09X1X3 − 3.92X2X3 −1.27X12 − 7.83X22 − 8.78X3 | (7) |
The data in Table 2 reveal that only the X2X3 interaction term does not significantly affect EE. The quadratic terms X22 and X32 are more significant at the p < 0.01 level, while X12 is significant at the p < 0.05 level. EE increased with each variable until the midpoint, above which EE decreased (Fig. 1E–G). For example, an increase in ANT amount from 3 to 6 mg increased EE, but at higher amount, EE decreased. Consistently, Hu et al.,22 studied CS-TPP nanoparticles for the delivery of tea catechins and reported that EE increased as the amount of tea catechins was increased from 1 to 3%, and then decreased at higher amounts, consistent with our observations. This trend may be due to the high cross-linking density between CS and the loaded extract.
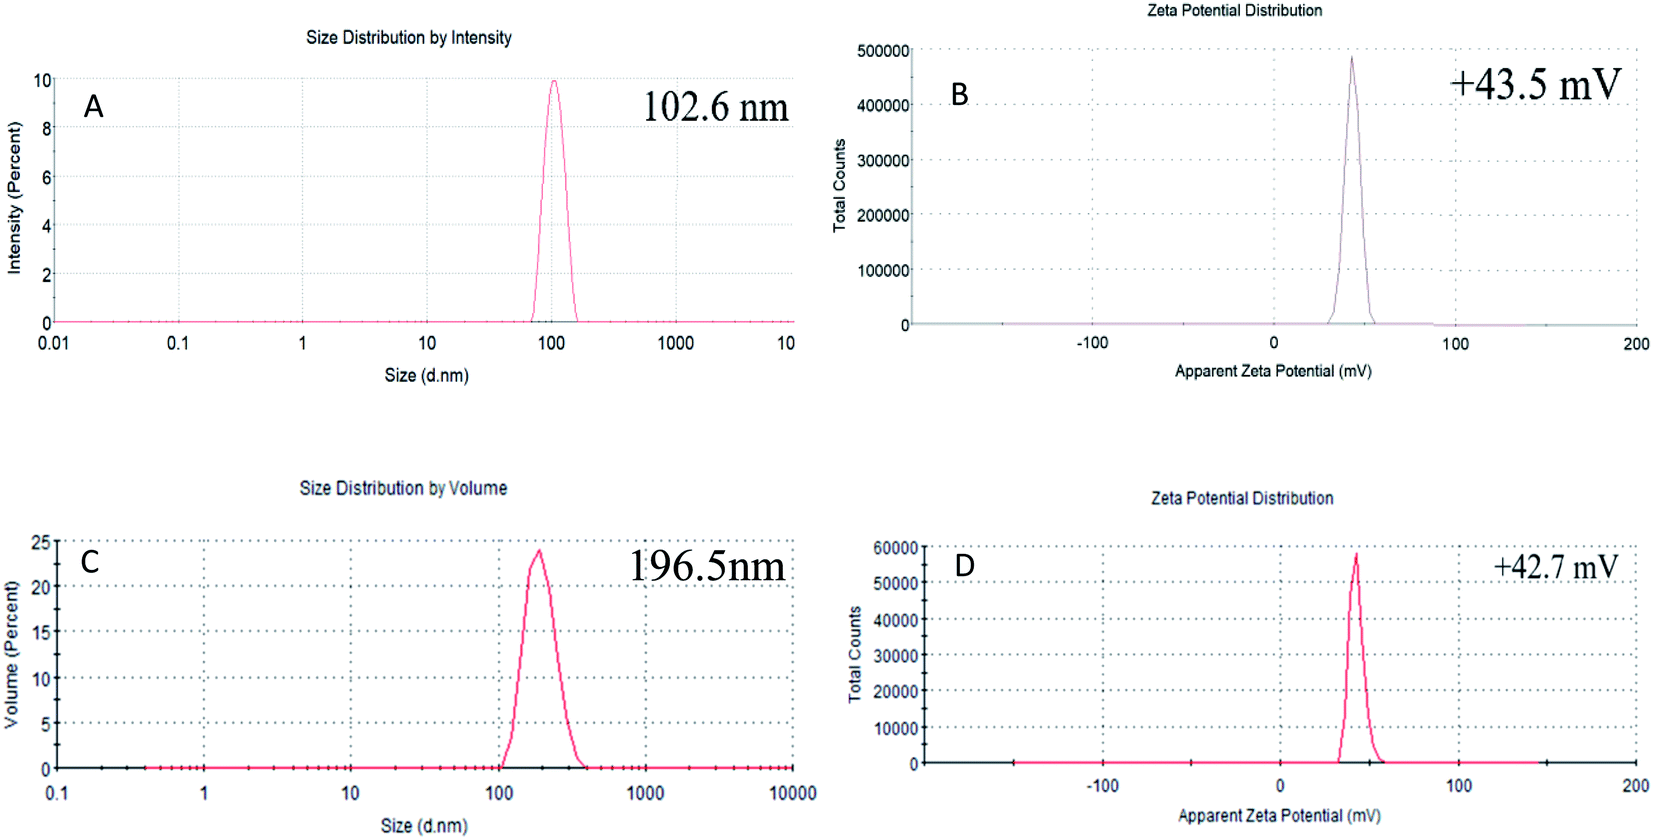 | ||
| Fig. 3 Particle sizes and zeta potentials of (A and B) non-loaded NPs and (C and D) ANT-NPs. | ||
3.2 Nanocapsules characterisation
TEM images of non-loaded NPs and ANT-NPs obtained under the optimised preparation conditions are displayed in Fig. 2. The non-loaded nanocapsules exhibit spherical morphologies with diameters below 100 nm, while those of ANT-NPs were 100–200 nm. It is considered that by adding ANT into chitosan nanocapsules leads to the formation of cross-link between chitosan and ANT resulted in a larger size distribution.25 However, non-loaded NPs and ANT-NPs are 102.6 nm and 196.5 nm in size, respectively, as determined by DLS, which are larger than the values determined by TEM. These discrepancies are possibly due to swelling of the CS layers of the nanocapsules in the presence of water, with DLS measuring hydrodynamic diameter, whereas TEM provides the actual diameter of the dried nanocapsule.26,27 Furthermore, both non-loaded NPs and ANT-NPs exhibited narrow particle-size distributions, as indicated by their PDIs of 0.047 and 0.032, respectively; these low PDIs accurately reflect the homogeneities of the nanocapsules.28
The zeta potentials of the nanocapsules were determined as an indicator of their stabilities. Generally, a high zeta potential reflects physical stability induced by electrostatic repulsion, which prevents nanocapsule aggregation.29 Fig. 2B and D shows that the zeta potential of the non-loaded NPs and ANT-NPs are +43.5 mV and +42.7 mV, which indicates that they are very physically stable.
![[double bond, length as m-dash]](https://www.rsc.org/images/entities/char_e001.gif) O, amide II, C–H, and –NH2 peaks at 1078, 1424, 1631, 2869, and 3425 cm−1, respectively. The spectrum of free ANT shows a peak at 3411 cm−1 that corresponds to –OH stretching vibrations, a strong peak at 2927 cm−1 assigned to C–H stretching, and a characteristic C–O peak located at 1196 cm−1.
O, amide II, C–H, and –NH2 peaks at 1078, 1424, 1631, 2869, and 3425 cm−1, respectively. The spectrum of free ANT shows a peak at 3411 cm−1 that corresponds to –OH stretching vibrations, a strong peak at 2927 cm−1 assigned to C–H stretching, and a characteristic C–O peak located at 1196 cm−1.
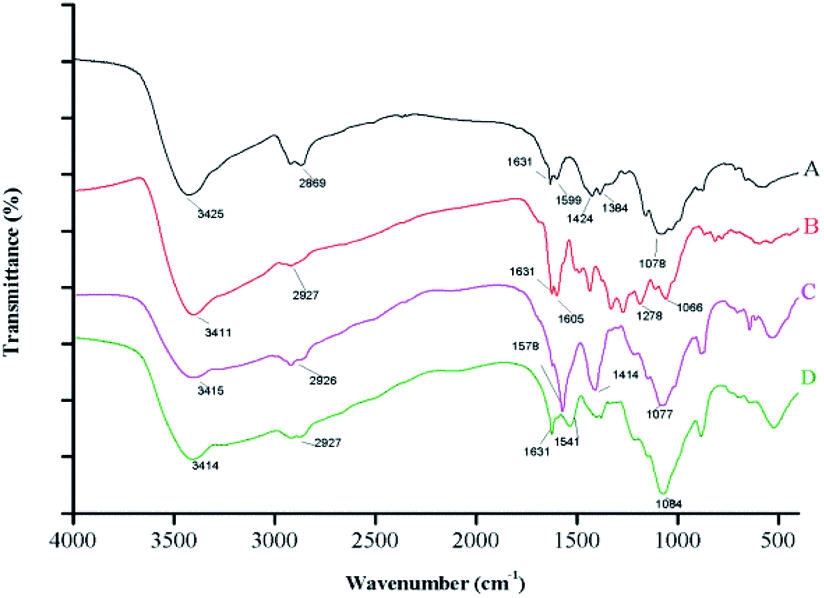 | ||
| Fig. 4 FT-IR spectra of (A) CS, (B) ANT, (C) non-loaded nanocapsules, and (D) ANT-NPs. | ||
The spectra of the non-loaded nanocapsules and the ANT-NPs overlapped at similar frequencies; the former reveals a shift in the amide II peak, from 1631 to 1578 cm−1, compared to that of free CS, which confirms that the amino groups of CS are linked to the phosphate groups of TPP. Similar result was in accordance with a previous study that nanoencapsulation by ionic gelation method.30,31 Moreover, it can be observed that the absorption bands of the ANT-NPs are narrow when compared with the non-loaded nanocapsules, which suggested that reciprocity between the amino or carbonyl groups of CS and the phenolic groups of ANT. Notably, a new band was detected in the FTIR spectrum of ANT-NPs at 1541 cm−1, which is associated with aromatic ring vibrations, confirming that the ANT was successfully entrapped in the ANT-NPs. These results further confirm the successful preparation of the ANT-NPs.
3.3 Physical and oxidant stabilities of the nanocapsules
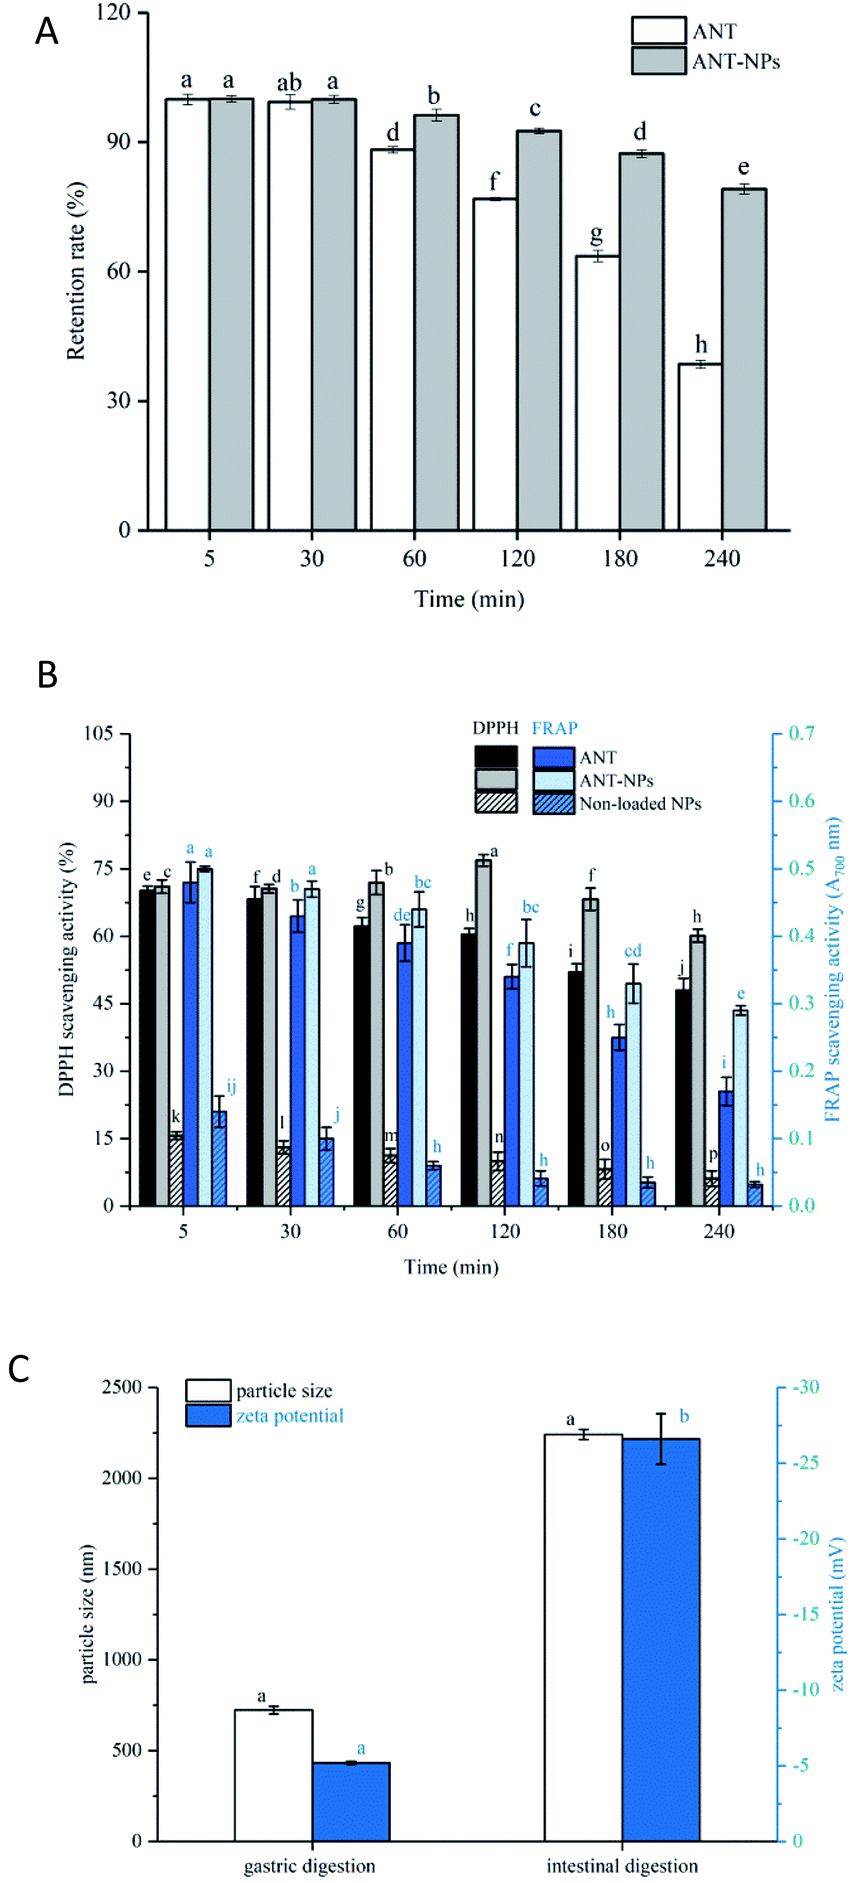 | ||
| Fig. 5 (A) Retention rates and (B) antioxidant activities of various formulations during in vitro digestion. (C) Particle size and zeta potential of ANT-NPs during in vitro digestion. Data are expressed as means ± standard deviations (n = 3). Samples designated with different letters indicate significant differences (Duncan, p < 0.05). | ||
The digestion process was divided into mouth, gastric, and intestinal phases in this study. Fig. 5A shows that there was no obvious release from both free ANT and ANT-NPs during mouth digestion, which may be due to the short exposure process and the absence of some specific enzymes.33 The retention rate of the ANT (96.24%) in ANT-NPs was clearly higher than that of free ANT (88.21%) when the samples were subjected to gastric digestion for 1 h. The retention rate of the ANT-NPs was more than 92%, while that of the free ANT was only 76% at the end of the gastric digestion period, which is significantly lower than those obtained from the ANT-NPs. Moreover, the retention rate of free ANT decreased rapidly to 38.52%, while that of ANT-NPs was 79.13% after simulated intestinal digestion. According to the abovementioned results, ANT-NPs exhibit a significantly lower release rate than free ANT under simulated gastrointestinal digestion. When combined with the results shown in Fig. 5C, the particle size and zeta potential of the ANT-NPs clearly change greatly during intestinal digestion, from original small stable particles to large unstable ones. This effect may be due to the fact that chitosan is readily dissolved under strong acid condition, which results in the relaxation of the ANT-NP structure.
To evaluate oxidative stability during digestion, the ANT-NPs were assayed by DPPH and FRAP, the results of which are compared with those of free ANT and the non-loaded NPs. The DPPH assay is usually used to evaluate the antioxidant activity of a substance. As shown in Fig. 5B, we found that ANT-NPs displayed an obviously higher DPPH scavenging activity (60.12%) than free ANT (47.94%) and non-loaded NPs (7.15%) at the end of the entire digestion process. Herein, non-loaded NPs showed limited DPPH radical scavenging activity, whereas free ANT showed potent activity, which is ascribable to the presence of numerous H-donating phenolic hydroxyl groups in the ANT. Moreover, the antioxidant capacity of the ANT-NPs, free ANT, and non-loaded NPs were further evaluated and compared using the FRAP assay. Initially, the FRAP reduction capacity of free ANT (0.48%) was similar with that of ANT-NPs (0.50%), while the FRAP reduction capacity of ANT-NPs (0.35%) was higher than that of free ANT (0.17%) at the end of the entire digestion process.
The above retention rates and antioxidant assay results reveal that the ANT-NPs exhibit excellent physical and oxidative stability during simulated gastrointestinal digestion.
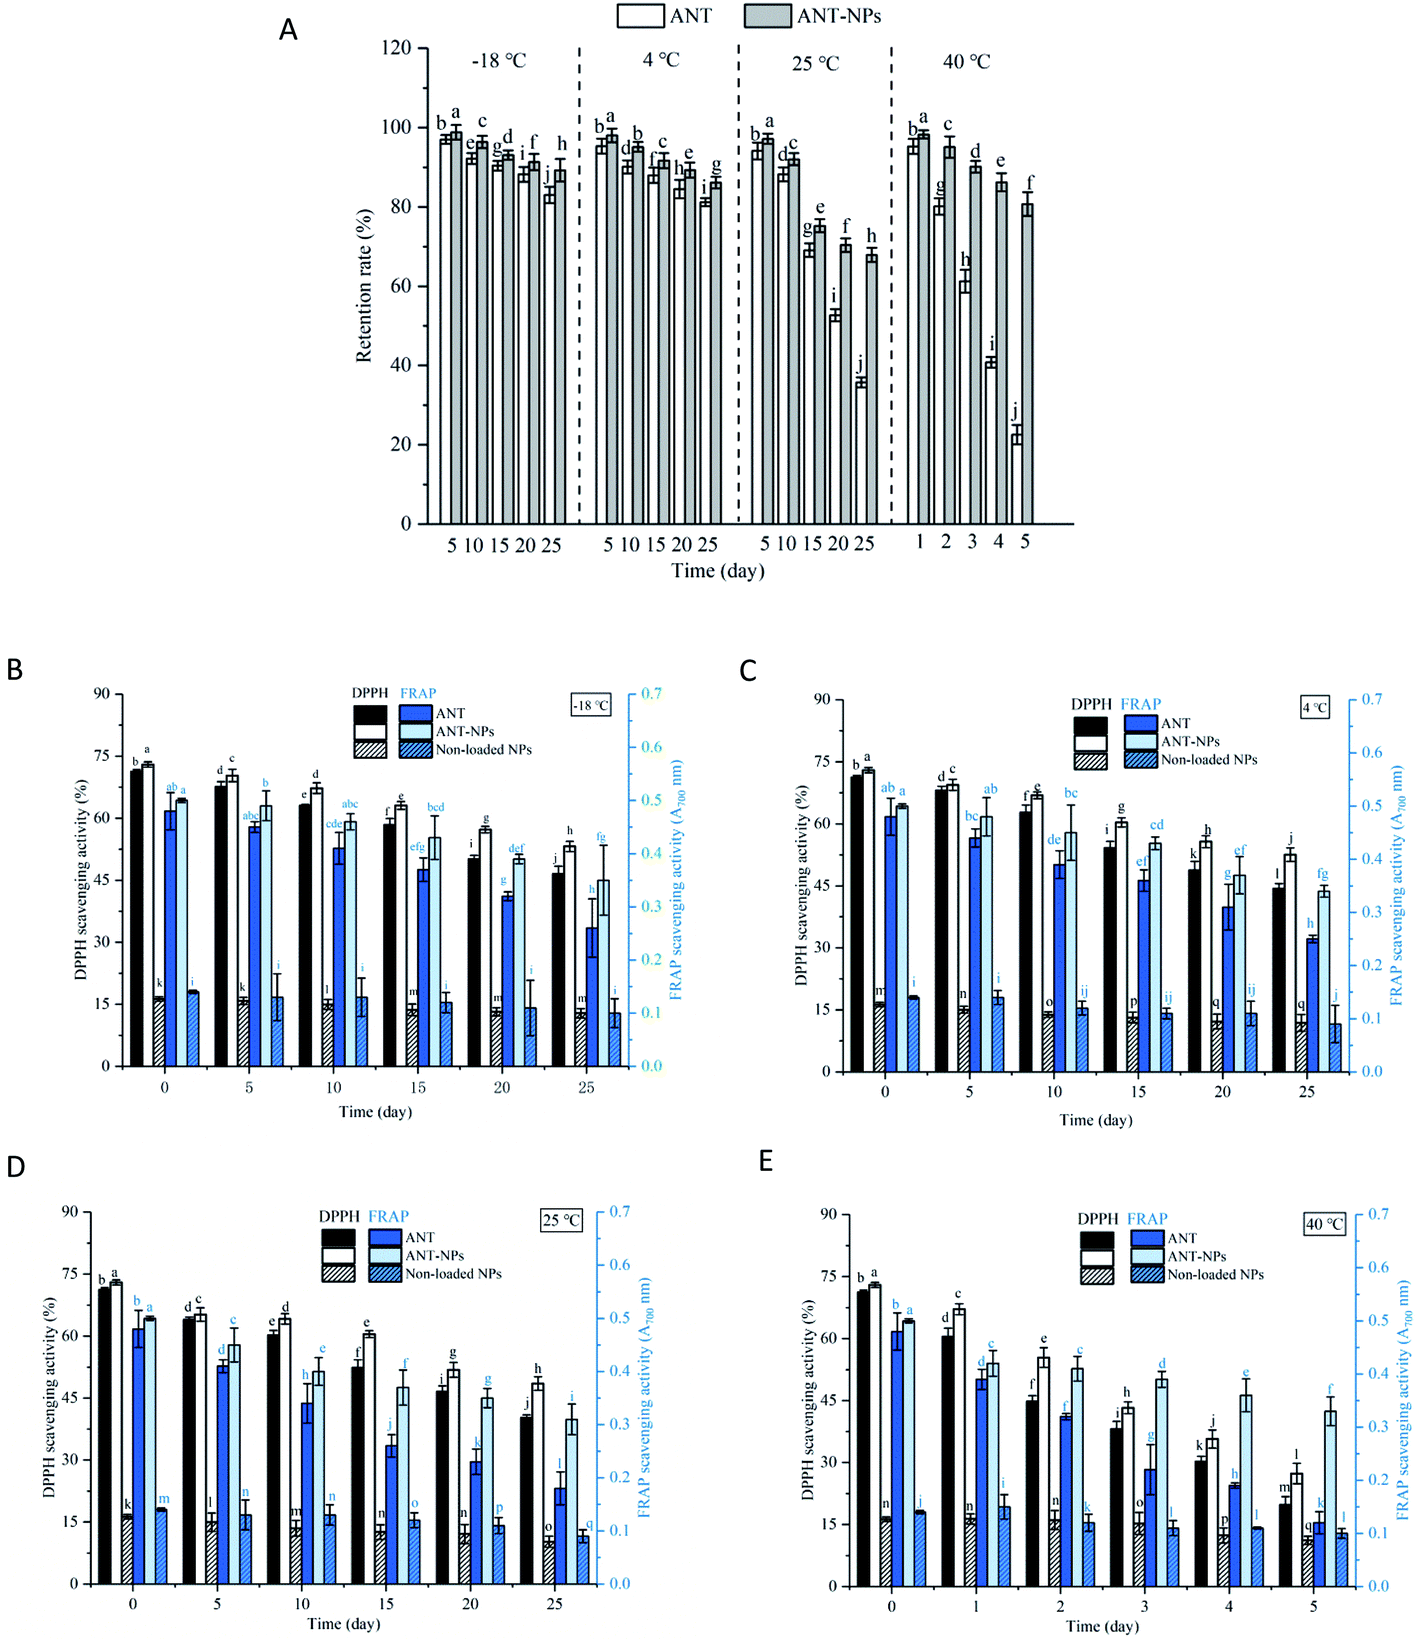 | ||
| Fig. 6 (A) Retention rates and (B–E) antioxidant activities of various formulations during storage process. (B–D) Storage at temperatures of −18, 4, and 25 °C for 25 d; (E) storage at a temperature of 40 °C for 5 d. Data are expressed as means ± standard deviations (n = 3). Samples designated with different letters are significantly different (Duncan, p < 0.05). | ||
The oxidative stabilities of free ANT, ANT-NPs, and the non-loaded NPs were subsequently assessed using the DPPH and FRAP assays. As shown in Fig. 6, the oxidative stabilities determined using these two assays exhibited the same trends. Our results revealed that the antioxidant activities of free ANT and ANT-NPs decreased with increasing storage temperature and time. Additionally, the decrease was observed to be more pronounced for free ANT, followed by ANT-NPs. The antioxidant activity of free ANT also decreased more rapidly at 40 °C (Fig. 6E). For example, the DPPH scavenging activity of ANT-NPs was 53.18, 52.56, 48.52 and 27.34% in the −20, 4, 25, and 40 °C treatment, respectively. In contrast, these figures were higher than those of equivalent free ANT, which were 46.5, 44.32, 40.27 and 19.77%, respectively. Interestingly, we found that the FRAP scavenging activities of ANT-NPs were also higher than those of free ANT at various storage temperatures. Notably, both the DPPH and FRAP scavenging activities of non-loaded NPs showed limited but not obvious reductions. We conclude that chitosan does not contribute to antioxidant activity, and that the significant enhancement in antioxidant activity is due to the inclusion of the ANT in the nanocapsules. These findings provide further evidence that nanoencapsulated ANT are more suited to storage than free ANT under various environmental conditions.
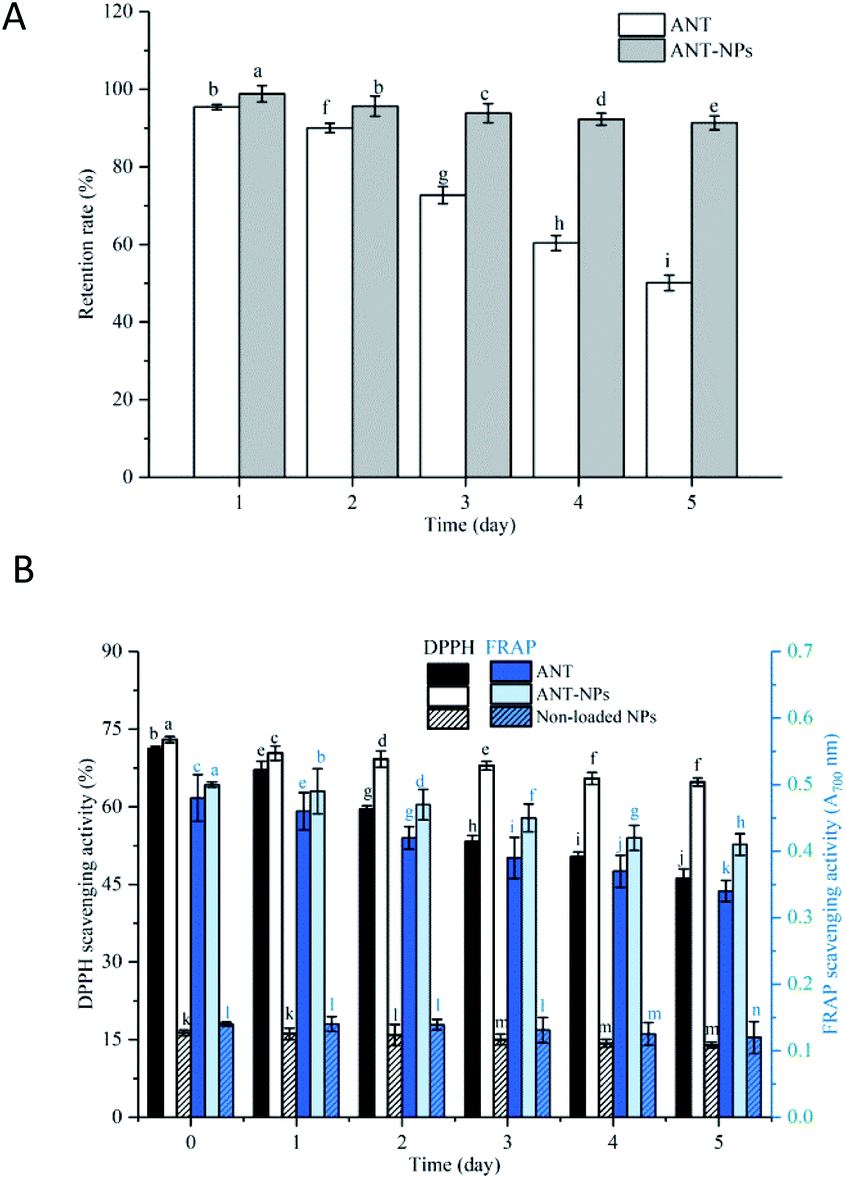 | ||
| Fig. 7 (A) Retention rates and (B) antioxidant activities of various formulations after exposure to light. Data are expressed as means ± standard deviations (n = 3). Different letters over columns indicate significant differences between preparations (Duncan, p < 0.05). | ||
4 Conclusions
In our study, response surface methodology (RSM) was used to optimise the preparation conditions of ANT-NPs with the chitosan (CS), tripolyphosphate (TPP) and anthocyanins (ANT). The achieved ANT-NPs with the best response exhibited maximum encapsulation efficiency (EE, 65.7%), minimum particle size (197 nm) and stable zeta potential (+42.7 mV). The successful load of ANT in ANT-NPs was clearly depicted through TEM and FT-IR spectroscopy. Compared with the free ANT, the ANT-NPs exhibited gradual release of ANT but sustained antioxidant activity during in vitro digestion. Additionally, it was also demonstrated that during storage and photo treatment, the ANT-NPs were able to preserve the retention rate and antioxidant activity of ANT against harsh environment. We therefore suggested the application of nanoencapsulation could be as a good alternative to enhance the physical and oxidant stability of ANT.Conflicts of interest
The authors declare that there are no conflicts of interest.Acknowledgements
Support for this study provided by the National Key Research and Development Program of China (Grant No. 2017YFD0400704-4) is gratefully acknowledged.References
- J. Zhang, J. Wu, F. Liu, L. Tong, Z. Chen, J. Chen, H. He, R. Xu, Y. Ma and C. Huang, Eur. J. Pharmacol., 2019, 858, 172500 CrossRef CAS
.
- S. Hamedi and M. Koosha, Appl. Clay Sci., 2020, 197, 105770 CrossRef CAS
- J. Y. Lee, Y.-u. Jo, H. Shin, J. Lee, S. U. Chae, S. K. Bae and K. Na, Int. J. Pharm., 2020, 586, 119597 CrossRef CAS
- L. Xie, H. Su, C. Sun, X. Zheng and W. Chen, Trends Food Sci. Technol., 2018, 72, 13–24 CrossRef CAS
- J. Koh, Z. Xu and L. Wicker, Food Chem., 2020, 302, 125343 CrossRef CAS
- X. Sun, Z. Yan, T. zhu, J. Zhu, Y. Wang, B. Li and X. Meng, Food Chem., 2019, 279, 63–69 CrossRef CAS
- S. Akhavan and S. M. Jafari, Nanoencapsulation of Food Bioactive Ingredients, 2017, pp. 223–260 Search PubMed
- L. Chen, C. Gnanaraj, P. Arulselvan, H. El-Seedi and H. Teng, Trends Food Sci. Technol., 2019, 85, 149–162 CrossRef CAS
- Y. Yang, J. Cheng, V. M. Garamus, N. Li and A. Zou, J. Agric. Food Chem., 2018, 66, 1067–1074 CrossRef CAS
- Y. Li, H. Song, S. Xiong, T. Tian, T. Liu and Y. Sun, Int. J. Biol. Macromol., 2018, 109, 672–680 CrossRef CAS
- M. Hamdi, R. Nasri, S. Li and M. Nasri, Int. J. Biol. Macromol., 2020, 145, 1140–1154 CrossRef CAS
- J. Chi, J. Ge, X. Yue, J. Liang, Y. Sun, X. Gao and P. Yue, LWT--Food Sci. Technol., 2019, 109, 101–107 CrossRef CAS
- L. Meng, J. Zhu, Y. Ma, X. Sun, D. Li, L. Li, H. Bai, G. Xin and X. Meng, Food Biosci., 2019, 30, 100413 CrossRef CAS
- K. Prasad, D. Mondal, M. Sharma, M. G. Freire, C. Mukesh and J. Bhatt, Carbohydr. Polym., 2018, 180, 328–336 CrossRef CAS
- T. Mohd, T. Belwal, I. D. Bhatt, V. Pande and S. K. Nandi, Ind. Crops Prod., 2018, 117, 66–74 CrossRef CAS
- J. Wang, H. Li, Z. Chen, W. Liu and H. Chen, Ind. Crops Prod., 2016, 89, 152–156 CrossRef CAS
- T. Wu, C. Grootaert, S. Voorspoels, G. Jacobs, J. Pitart, S. Kamiloglu, S. Possemiers, M. Heinonen, N. Kardum, M. Glibetic, G. Smagghe, K. Raes and J. Van Camp, J. Funct. Foods, 2017, 38, 128–139 CrossRef CAS
- D. Fasolo, B. Pippi, G. Meirelles, G. Zorzi, A. M. Fuentefria, G. von Poser and H. F. Teixeira, J. Drug Delivery Sci. Technol., 2020, 101573 CrossRef CAS
- I. Jazuli, Annu, B. Nabi, T. moolakkadath, T. Alam, S. Baboota and J. Ali, J. Pharm. Sci., 2019, 108, 3082–3090 CrossRef CAS
- T. Moolakkadath, M. Aqil, A. Ahad, S. Sarim Imam, A. Praveen, Y. Sultana and M. Mujeeb, Int. J. Pharm., 2020, 119125 CrossRef CAS
- A. Grenha, B. Seijo and C. Remuñán-López, Eur. J. Pharm. Sci., 2005, 25, 427–437 CrossRef CAS
- B. Hu, C. Pan, Y. Sun, Z. Hou, H. Ye, B. Hu and X. Zeng, J. Agric. Food Chem., 2008, 56, 7451–7458 CrossRef CAS
- J. Liang, F. Li, Y. Fang, W. Yang, X. An, L. Zhao, Z. Xin, L. Cao and Q. Hu, Colloids Surf., B, 2011, 82, 297–301 CrossRef CAS
- A. Shetta, J. Kegere and W. Mamdouh, Int. J. Biol. Macromol., 2019, 126, 731–742 CrossRef CAS
- J. Liang, H. Yan, X. Wang, Y. Zhou, X. Gao, P. Puligundla and X. Wan, Food Chem., 2017, 231, 19–24 CrossRef CAS
- J. Feng, Y. Wu, L. Zhang, Y. Li, S. Liu, H. Wang and C. Li, J. Agric. Food Chem., 2019, 67, 10432–10447 CrossRef CAS
- M. Luo, R. Zhang, L. Liu, J. Chi, F. Huang, L. Dong, Q. Ma, X. Jia and M. Zhang, J. Food Eng., 2020, 284, 110065 CrossRef CAS
- M. Sharma, R. Sharma, D. K. Jain and A. Saraf, Int. J. Biol. Macromol., 2019, 135, 246–260 CrossRef CAS
- S. N. Mazloomi, A. S. Mahoonak, M. Ghorbani and G. Houshmand, J. Food Eng., 2020, 280, 109976 CrossRef CAS
- C. Tan, M. J. Selig and A. Abbaspourrad, Carbohydr. Polym., 2018, 181, 124–131 CrossRef CAS
- J. Wu, Y. Wang, H. Yang, X. Liu and Z. Lu, Carbohydr. Polym., 2017, 175, 170–177 CrossRef CAS
- I. Gheonea, I. Aprodu, A. Cîrciumaru, G. Râpeanu, G. E. Bahrim and N. Stănciuc, J. Food Eng., 2021, 288, 110166 CrossRef CAS
- K. Tai, M. Rappolt, L. Mao, Y. Gao, X. Li and F. Yuan, Food Hydrocolloids, 2020, 99, 105355 CrossRef CAS
- K. Sarabandi and S. M. Jafari, J. Food Eng., 2020, 286, 110131 CrossRef CAS
- M. Zembyla, A. Lazidis, B. S. Murray and A. Sarkar, J. Food Eng., 2020, 281, 109991 CrossRef CAS
- S. Kanokpanont, R. Yamdech and P. Aramwit, Artif. Cells, Nanomed., Biotechnol., 2018, 46, 773–782 CrossRef CAS
- J. Ge, P. Yue, J. Chi, J. Liang and X. Gao, Food Hydrocolloids, 2018, 74, 23–31 CrossRef CAS
- Y. Lang, H. Gao, J. Tian, C. Shu, R. Sun, B. Li and X. Meng, LWT--Food Sci. Technol., 2019, 115, 108434 CrossRef CAS
Footnote |
| † Electronic supplementary information (ESI) available. See DOI: 10.1039/d0ra08162k |
| This journal is © The Royal Society of Chemistry 2021 |