
 Open Access Article
 This Open Access Article is licensed under a Creative Commons Attribution-Non Commercial 3.0 Unported Licence
Porous BMTTPA–CS–GO nanocomposite for the efficient removal of heavy metal ions from aqueous solutions†
Juan Huang‡
a,
Weirong Cui‡a,
Ruping Liangac,
Li Zhanga and
Jianding Qiu *ab
*ab
aCollege of Chemistry, Nanchang University, Nanchang 330031, China. E-mail: jdqiu@ncu.edu.cn; Tel: +86-791-83969518
bCollege of Materials and Chemical Engineering, Pingxiang University, Pingxiang 337055, China
cJiangxi Province Key Laboratory of Modern Analytical Science, Nanchang University, Nanchang, 330031, China
First published on 19th January 2021
Abstract
In this study, a stable, cost-effective and environmentally friendly porous 2,5-bis(methylthio)terephthalaldehyde–chitosan–grafted graphene oxide (BMTTPA–CS–GO) nanocomposite was synthesized by covalently grafting BMTTPA–CS onto the surfaces of graphene oxide and used for removing heavy metal ions from polluted water. According to well-established Hg2+–thioether coordination chemistry, the newly designed covalently linked stable porous BMTTPA–CS–GO nanocomposite with thioether units on the pore walls greatly increases the adsorption capacity of Hg2+ and does not cause secondary pollution to the environment. The results of sorption experiments and inductively coupled plasma mass spectrometry measurements demonstrate that the maximum adsorption capacity of Hg2+ on BMTTPA–CS–GO at pH 7 is 306.8 mg g−1, indicating that BMTTPA–CS–GO has excellent adsorption performance for Hg2+. The experimental results show that this stable, environmentally friendly, cost-effective and excellent adsorption performance of BMTTPA–CS–GO makes it a potential nanocomposite for removing Hg2+ and other heavy metal ions from polluted water, and even drinking water. This study suggests that covalently linked crucial groups on the surface of carbon-based materials are essential for improving the adsorption capacity of adsorbents for heavy metal ions.
1. Introduction
Water resources issues around the world are increasingly raising widespread concern.1,2 Heavy metal ions are causing increasingly severe environmental pollution problems because of their release from different pollution sources including fuel combustion, fertilizers, plating, waste disposal, batteries and paints.3–5 Water pollution caused by toxic heavy metal ions is the main environmental issue because these toxic elements are prone to bioaccumulation and cause serious ecological damage.6,7 Many heavy metal elements such as Hg2+, Cd2+, Cu2+ and Pb2+ are non-biodegradable and highly toxic.8,9 For the protection of human health and ecological environments, these toxic elements must be removed from polluted water before it is released into the environment. Traditional techniques for removing these toxic elements include adsorption, precipitation, ion exchange, and membrane filtration.10,11 Among these techniques, adsorption technology has been widely used because it is simple, cost-effective and efficient. Several adsorbents have been investigated for the removal of toxic heavy metal elements, including inorganic materials, zeolites, resins, nanofibers and activated carbon.12–14 However, most of these adsorbents are characterized by long processing time or low adsorption efficiency, making them less likely to be actually used in wastewater treatment.15–17 Therefore, it is necessary to prepare efficient and low-cost adsorbents for the removal of heavy metal elements from polluted water.Graphene oxide (GO) as an excellent adsorbent for removal of toxic heavy metal elements has drawn increasing attention because of its good biocompatibility, simple preparation method and low cost.18–20 There are many different functional groups distributed on the GO surface such as carbonyl, hydroxyl and epoxide.21,22 These functional groups allow GO to be functionalized by non-covalent and covalent bonds, thus making it a cornerstone for multifunctional material synthesis.23,24 Recently, thiols and amines have been used to functionalize GO surfaces for environmental contaminant removal from polluted water.25,26 For example, polypyrrole–rGO, chitosan–rGO and SH–GO/Fe3O4 nanocomposite have been used as new heavy metal ion adsorbents.27–30 In particular, grafting a target polymer onto the surface of GO is an effective way to improve the performance of graphene.31 Chitosan (CS) is a non-toxic and biodegradable natural biopolymer with similar structural features to cellulose.32,33 CS exhibits excellent complexing ability toward heavy metal ions from various wastewaters because of its high content of amino and hydroxyl functional groups.34,35 Therefore, as a heavy metal ion adsorbent, CS has been paid much attention in recent years and has become a research hotspot.36 However, CS is a stimulus-responsive polymer whose solubility can be reversibly regulated by changing the pH value.37,38 In order to prevent its dissolution in acidic solutions and improve its heavy metal ion adsorption properties, CS is generally modified by means of grafting or crosslinking.39,43 Although a few groups have reported the preparation of CS-functionalized GO by covalent interactions,23,44,47 no studies have focused on the use of GO covalently modified with CS-functionalized derivatives to prepare nanocomposites for removing Hg2+ from aqueous solutions.
Herein, we report a covalently linked stable porous BMTTPA–CS–GO nanocomposite with thioether groups on the surface for the removal of Hg2+ from aqueous solutions based on the accepted Hg2+–thioether linkage chemistry.40–43 The preparation procedure of BMTTPA–CS–GO is shown in Scheme S1.† This simple design strategy involves the BMTTPA–CS–GO nanocomposite being prepared by covalently grafting BMTTPA–CS onto the surfaces of GO. The objective of this work is to prepare a novel porous BMTTPA–CS–GO nanocomposite for the removal of Hg2+, Cu2+, Pb2+ and Cd2+ from polluted water and to provide adsorption mechanism insights of the interaction between the BMTTPA–CS–GO nanocomposite and heavy metal ions.
2. Materials and methods
2.1 Materials
GO was synthesized using a modified Hummers method.3 CS (MW = 310![[thin space (1/6-em)]](https://www.rsc.org/images/entities/char_2009.gif) 000–375000, deacetylated >75%) was obtained from Sigma-Aldrich. 2,5-Bis(methylthio)terephthalaldehyde was synthesized based on the literature.43 All other chemicals used were of analytical grade unless otherwise indicated.
000–375000, deacetylated >75%) was obtained from Sigma-Aldrich. 2,5-Bis(methylthio)terephthalaldehyde was synthesized based on the literature.43 All other chemicals used were of analytical grade unless otherwise indicated.
2.2 Synthesis of BMTTPA–CS
CS (300 mg) was dispersed in 2 wt% acetic acid (30 mL), and then diluted with methanol (30 mL). The mixture was stirred vigorously to obtain a homogeneous CS solution. Then, 2,5-bis(methylthio)terephthalaldehyde (105 mg) was added batchwise into the CS solution. After vigorous stirring for 24 h, the resulting mixture was washed three times with methanol and then dried in a vacuum drying oven at 40 °C for 8 h. The resulting yellow material was the BMTTPA–CS composite.2.3 Preparation of BMTTPA–CS–GO
BMTTPA–CS–GO was synthesized by the amidation of GO with BMTTPA–CS in the presence of NHS and EDC. BMTTPA–CS (0.3 g) and GO (0.7 g) were first dispersed in 2% (w/w) acetic acid (80 mL) and sonicated for one hour to get a homogeneous suspension. Then, EDC (0.35 g) and NHS (0.11 g) were slowly added into the suspension and stirred at 25 °C for one day. Thereafter, the suspension was washed three times with a large volume of ultrapure water. The collected sample was redispersed in 80 mL ultrapure water by sonication for 15 min. The mixture was then cast in 24-well cell culture plates. The molds were placed at −20 °C and allowed to solidify for 5 h, followed by lyophilization of the mixture solution in a freeze dryer at −80 °C for 24 h.2.4 Removal of heavy metal ions
In order to remove Hg2+, Cu2+, Pb2+ and Cd2+ from sewage, 30 mg BMTTPA–CS–GO was added to 50 mL heavy metal ion solution (in a glass bottle) at 25 °C for adsorption experiments. The initial concentration range of Hg2+, Cu2+, Pb2+ and Cd2+ was 1 to 700 mg L−1. The pH of the Hg2+, Cu2+, Pb2+ and Cd2+ solution was adjusted to 7.0 with 0.01 M NaOH or HNO3. All adsorption experiments were performed using a ZWY-103B shaker (Zhicheng, Shanghai) with a shaker speed of 220 rpm until the system reached equilibrium. The Hg2+, Cu2+, Pb2+ and Cd2+ solution was filtered through a 0.22 μm microporous membrane, and the concentrations of the metal ions in the filtrate were measured with ICP-MS. The formulas for the removal rate and adsorption capacity of BMTTPA–CS–GO for Hg2+, Cu2+, Pb2+ and Cd2+ are as follows: removal (%) = (C0 − Ce)/C0 × 100% and qe = (C0 − Ce)/m × V, where C0 and Ce represent the initial and equilibrium concentrations of heavy metal ions (mg L−1), respectively; m is the amount of BMTTPA–CS–GO (g); V is the volume of heavy metal ion solution (L); and qe is the equilibrium adsorption capacity (mg g−1).3. Results and discussion
3.1 Characterization of BMTTPA–CS–GO
The microstructures of BMTTPA–CS–GO nanocomposite were observed using SEM. As shown in Fig. 1A, the BMTTPA–CS–GO nanocomposite has a three-dimensional porous structure, which would increase the amount of adsorption active sites on the surface of BMTTPA–CS–GO and help increase the removal efficiency of Hg2+, Cu2+, Pb2+ and Cd2+. By increasing the image magnification (Fig. 1B), it can be seen that the surface of BMTTPA–CS–GO is strongly wrinkled. These wrinkles could also increase the number of adsorption active sites and will benefit Hg2+, Cu2+, Pb2+ and Cd2+ removal from polluted water. Fig. S1† shows the AFM images of GO and BMTTPA–CS–GO. After the formation of BMTTPA–CS–GO, the thickness of BMTTPA–CS–GO is 4.45 nm (Fig. S1B†), which is thicker than the 1.91 nm of GO (Fig. S1A†). The S element was found in the energy dispersive X-ray spectrum of BMTTPA–CS–GO, indicating that BMTTPA–CS–GO contains S element (Fig. S2†). CHN analysis shows that C element content was 42.87% in BMTTPA–CS–GO, N element content was 6.84%, and H element content was 6.54%, which proves that BMTTPA–CS–GO is mainly a C-based material (Table S1†). These results indicate that BMTTPA–CS has been successfully compounded on GO.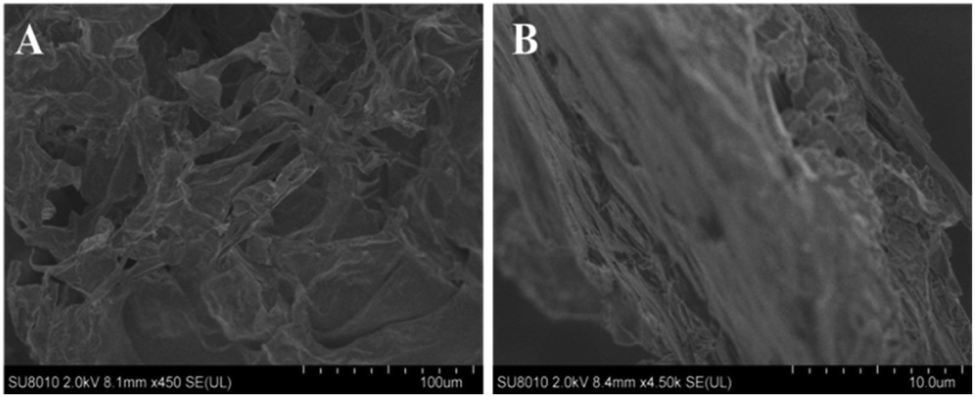 | ||
| Fig. 1 SEM image of BMTTPA–CS–GO nanocomposite (A) and high-resolution SEM image of BMTTPA–CS–GO nanocomposite (B). | ||
The IR spectra of BMTTPA–CS–GO, BMTTPA–CS, GO, BMTTPA and CS are shown in Fig. 2A. By comparing the IR spectra of BMTTPA, BMTTPA–CS and CS, several new absorption bands appear in the BMTTPA–CS spectrum. A typical characteristic peak of C![[double bond, length as m-dash]](https://www.rsc.org/images/entities/char_e001.gif) N appears at 1678 cm−1, a new broad band at 3434 cm−1 belongs to the O–H stretching vibration of –OH group or N–H stretching vibration of –NH2, and a new band at 1127 cm−1 is assigned to the stretching vibration of C–S.40–42 The above results indicate that BMTTPA–CS has been successfully prepared.45,46 In the IR spectrum of GO, the band at 1724 cm−1 can be assigned to the CO of –COOH.1 For BMTTPA–CS–GO, the band at 1724 cm−1 disappears, and a new absorption band at 1698 cm−1 appears, which indicates that the –NH2 of CS has grafted with GO forming amide bonds.32,48 The results confirm the successful grafting of BMTTPA–CS on the surfaces of GO. These O, N and S functional groups are necessary for removing metal ions from aqueous solutions.
N appears at 1678 cm−1, a new broad band at 3434 cm−1 belongs to the O–H stretching vibration of –OH group or N–H stretching vibration of –NH2, and a new band at 1127 cm−1 is assigned to the stretching vibration of C–S.40–42 The above results indicate that BMTTPA–CS has been successfully prepared.45,46 In the IR spectrum of GO, the band at 1724 cm−1 can be assigned to the CO of –COOH.1 For BMTTPA–CS–GO, the band at 1724 cm−1 disappears, and a new absorption band at 1698 cm−1 appears, which indicates that the –NH2 of CS has grafted with GO forming amide bonds.32,48 The results confirm the successful grafting of BMTTPA–CS on the surfaces of GO. These O, N and S functional groups are necessary for removing metal ions from aqueous solutions.
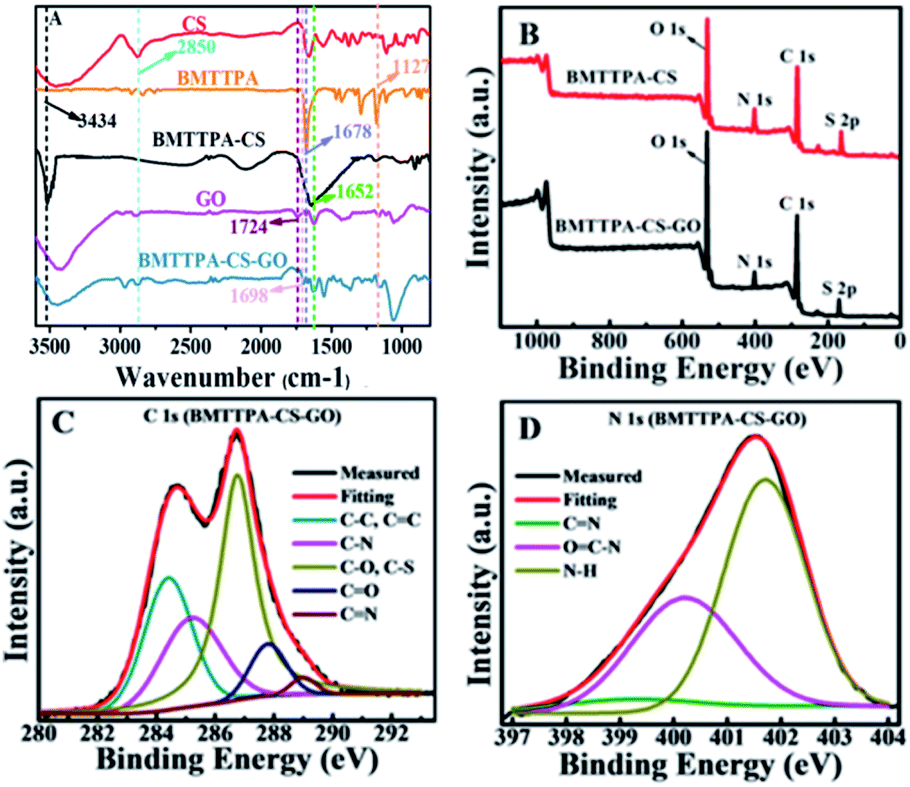 | ||
| Fig. 2 IR spectra of CS, BMTTPA, BMTTPA–CS, GO, and BMTTPA–CS–GO (A). XPS survey spectra of BMTTPA–CS and BMTTPA–CS–GO (B). XPS high-resolution spectra of C 1s of BMTTPA–CS–GO (C) and N 1s of BMTTPA–CS–GO (D). | ||
The successful grafting of BMTTPA–CS on the surfaces of GO can be also verified by XPS characterizations. Fig. 2B shows the XPS survey scans of BMTTPA–CS and BMTTPA–CS–GO. Two binding energy peaks at 163 and 402 eV can be attributed to S 2p and N 1s, respectively, which become significantly weak after grafting BMTTPA–CS onto the surfaces of GO. The decreasing intensities of these two peaks were mainly due to the covalent grafting of BMTTPA–CS onto the surfaces of GO. The deconvolution of the C 1s spectrum of BMTTPA–CS–GO (Fig. 2C) reveals five peaks, which can be assigned to non-oxygenated carbon (284.7 eV), CO bonds (287.9 eV), CN bonds (289.1 eV), C–N bonds (285.4 eV) and C–O or C–S bonds (286.2 eV).49,50 The C–S bonds (286.2 eV) also appear in BMTTPA–CS (Fig. S3†) to illustrate the grafting of BMTTPA–CS on the surface of GO. The deconvolution of the N 1s spectrum of BMTTPA–CS–GO (Fig. 2D) reveals three peaks, which can be assigned to CN bonds (399.2 eV), OC–N bonds (400.2 eV), and N–H bonds (401.7 eV).51,52 The presence of the amidoxime groups in BMTTPA–CS–GO is clearly confirmed by the peaks at 400.2 eV (N in C–N bond) and 287.9 eV (C in CN bond),1 but not in BMTTPA–CS (Fig. S3†). These results further confirm that BMTTPA–CS–GO has been successfully synthesized by covalently grafting BMTTPA–CS onto the surface of GO. The above results, especially the combination of the XPS and FT-IR spectra, provide sufficient evidence for the successful preparation of BMTTPA–CS–GO by chemical reaction, containing –NH2 of BMTTPA–CS and –COOH of GO.
The results of the exploration of BMTTPA–CS–GO thermal stability are shown in detail in Fig. S4.† The thermal properties of BMTTPA–CS–GO were investigated by thermogravimetric analysis (TGA). As can be seen from the BMTTPA–CS–GO TGA curve (Fig. S4A†), the first region shows a 6% loss of mass from 60 to 160 °C, which is perhaps the result of evaporation of water molecules. The second region shows a rapid 31% loss of mass from 180 to 280 °C, which can be attributed to the degradation of BMTTPA–CS–GO. At last, the remaining amount of compound is 43% at 800 °C, which can be ascribed to the combustion of the carbon skeleton of BMTTPA–CS–GO. The TGA curves of GO and BMTTPA–CS are similar to that of BMTTPA–CS–GO. Based on the TGA curves, the amount of BMTTPA–CS in the BMTTPA–CS–GO nanocomposite is estimated to be 30% as originally prepared. The DTG thermograms (Fig. S4B†) show that the thermal degradation temperatures of BMTTPA–CS, BMTTPA–CS–GO and GO are 290, 215 and 195 °C, respectively. The BMTTPA–CS–GO degradation temperature is 20 °C higher than that of GO. The thermal stability of BMTTPA–CS–GO is related to the strong interfacial interaction between GO and BMTTPA–CS. The DSC chart of BMTTPA–CS–GO confirms this conclusion again (Fig. S5†).
Fig. S6A† shows the BET surface area of BMTTPA–CS–GO and the pore size distribution curve shows that BMTTPA–CS–GO has a layered porous structure (Fig. S6B†). As shown in Fig. S6C,† the GO pattern has a strong and sharp diffraction peak of (001) at 2θ = 10.7°. According to the Bragg equation, 2dsinθ = nλ, the distance between layers is 0.811 nm. For BMTTPA–CS–GO, there is a peak at 2θ = 9.7° and its plane spacing is 0.921 nm. The change of peak position shows that BMTTPA–CS was successfully compounded with GO, while BMTTPA–CS–GO maintains a certain degree of crystallinity without destroying the structure of GO, ensuring its excellent adsorption performance. The layer spacing of BMTTPA–CS–GO is larger than that of GO, indicating that the BMTTPA–CS reacts with the oxygen-containing functional groups on GO, thereby expanding the gap between the GO intermediate layers. The Raman spectra of GO and BMTTPA–CS–GO show two characteristic peaks of D band and G band (Fig. S6D†). The D band of GO is related to the degree of structural disorder and the G band is related to the stretching vibration of the conjugated CC group of GO. The G band for BMTTPA–CS–GO has almost the same frequency as that for GO, at 1604 cm−1. The extent of the defects depends on the intensity ratio of the D band to the G band (ID/IG). After modification of GO with BMTTPA–CS, the ID/IG ratio increased from 0.92 of GO to 1.10 of BMTTPA–CS–GO, which indicated that the disorder and defect level of BMTTPA–CS–GO increased. In addition, a new Raman peak related to C–S stretching is observed in the BMTTPA–CS–GO spectrum at 506 cm−1, which strongly proved the successful synthesis of BMTTPA–CS–GO.
3.2 Environmental application of BMTTPA–CS–GO nanocomposite
The porous BMTTPA–CS–GO nanocomposite was used for the removal of Hg2+, Cu2+, Pb2+ and Cd2+ from polluted water. The effects of different factors including the aqueous solution pH and BMTTPA–CS–GO nanocomposite dosage on the process of Hg2+, Cu2+, Pb2+ and Cd2+ removal were investigated. As shown in Fig. 3A, the adsorption of Hg2+, Cu2+, Pb2+ and Cd2+ on the BMTTPA–CS–GO nanocomposite is obviously affected by pH value. In general, due to the competition between the metal ions and H+ for the adsorption active sites, the removal efficiency of heavy metal ions at pH values between 2 and 5 is significantly lower.53–55 With increasing pH, the removal efficiency is enhanced for all heavy metal ions until it reaches a maximum at pH 7. However, when the solution pH is higher than 7, the decrease in removal efficiency of heavy metal ions perhaps resulted from the hydrolysis of the heavy metal ions in alkaline solution. Therefore, further study of adsorption of Hg2+, Cu2+, Pb2+ and Cd2+ from aqueous solution was conducted at pH 7.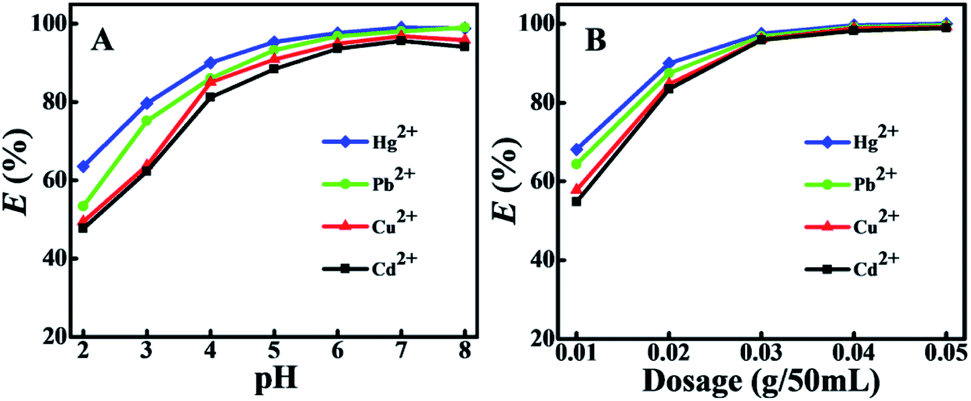 | ||
| Fig. 3 Dependence of the removal efficiency on (A) pH (C0 = 10 mg L−1, BMTTPA–CS–GO dosage = 0.03 g/50 mL, t = 90 min, T = 25 °C) and on (B) BMTTPA–CS–GO dosage (pH = 7, C0 = 10 mg L−1, t = 90 min, T = 25 °C). | ||
As shown in Fig. 3B, the removal of target heavy metal ions increases sharply when the adsorbent dosage is increased from 0.01 to 0.03 g/50 mL, which can be ascribed to the large quantity of adsorption active sites and increased surface area.56,57 When the dosage is continuously increased from 0.03 to 0.05 g/50 mL, the target heavy metal ion removal efficiency slightly increases. Therefore, the optimum dosage for subsequent studies was chosen to be 0.03 g/50 mL.
3.3 Adsorption capacity of heavy metals on BMTTPA–CS–GO
The adsorption capacities of BMTTPA–CS–GO for Hg2+, Cu2+, Pb2+ and Cd2+ are shown in Fig. 4A. Due to the large concentration gradient at the contact interface, the amount of Hg2+, Cu2+, Pb2+ and Cd2+ adsorbed on BMTTPA–CS–GO increases with initial concentrations, until it reaches equilibrium. Experimental results demonstrate that the maximum adsorption capacities for Cd2+, Cu2+, Pb2+ and Hg2+ on BMTTPA–CS–GO are 65.1, 78.0, 206.1, 306.8 mg g−1, respectively. These experimental results show the great potential of BMTTPA–CS–GO as a highly efficient adsorbent for the removal of heavy metal ions from polluted water. The removal efficiency of Hg2+ by BMTTPA–CS–GO is significantly higher than that of Pb2+, Cu2+ and Cd2+. The excellent removal efficiency of BMTTPA–CS–GO for Hg2+ is attributed to the well-established Hg2+–thioether ligation chemistry.43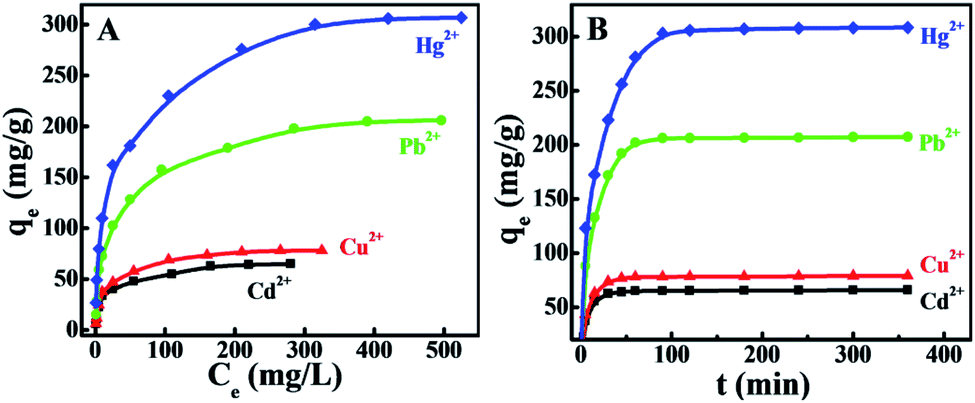 | ||
| Fig. 4 (A) Adsorption isotherms of Hg2+, Cu2+, Pb2+ and Cd2+ on BMTTPA–CS–GO (dosage = 0.03 g/50 mL, pH = 7, t = 90 min, T = 25 °C). (B) Adsorption kinetics of Hg2+, Cu2+, Pb2+ and Cd2+ on BMTTPA–CS–GO (dosage = 0.03 g/50 mL, pH = 7, T = 25 °C, initial concentrations of Cd2+, Cu2+, Pb2+ and Hg2+ were 312, 319, 619 and 709 mg L−1, respectively). | ||
Fig. 4B demonstrates the influence of mixing time on the adsorption of Hg2+, Cu2+, Pb2+ and Cd2+ by the BMTTPA–CS–GO nanocomposite. A sharp increase in Hg2+, Cu2+, Pb2+ and Cd2+ adsorption occurs within the first 30 min, followed by the adsorption capacity slowly increasing. After 90 min of mixing, equilibrium is achieved, and almost 99% of Hg2+ is removed by the BMTTPA–CS–GO nanocomposite. The maximum adsorption capacity for all the investigated heavy metal ions can be attained within 90 min mixing time. Even if the mixing time is up to 6 h, the heavy metal ion adsorption capacity remains unchanged. The adsorption rate of BMTTPA–CS–GO for Hg2+ is higher than that of Fe3O4–xGO (100 min),58,59 IT-PRGO (120 min),1 and thiol-functionalized MGO (500 min).59 The fast adsorption of Hg2+ by BMTTPA–CS–GO is owing to the porous structure and the numerous thioether units on the pore walls that can coordination with Hg2+.
Our experimental data were fitted using the Langmuir isotherm model. It can be represented as follows: qe = qmbCe/(1 + bCe), where b represents the Langmuir constant (L mg−1), Ce represents the equilibrium concentration of heavy metal ions (mg L−1), qm represents the monolayer adsorption capacity (mg g−1), and qe represents the equilibrium adsorption capacity (mg g−1).60 As shown in Fig. 5A, the experimental data of target heavy metal ions can fit well with the Langmuir adsorption model (R2 = 0.992–0.998), and the calculated isotherm parameters are listed in Table S2.†
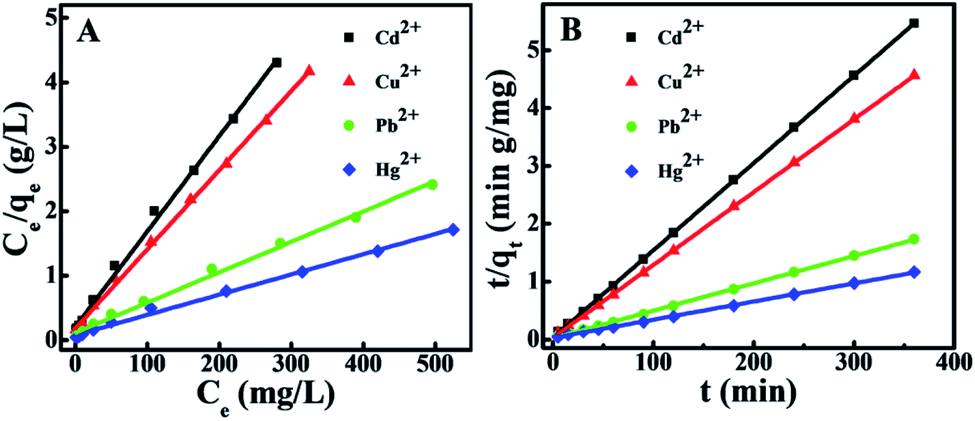 | ||
| Fig. 5 (A) Langmuir isotherm model for the adsorption of Hg2+, Cu2+, Pb2+ and Cd2+ on BMTTPA–CS–GO. (B) Pseudo-second-order kinetic model for the adsorption of Hg2+, Cu2+, Pb2+ and Cd2+ on BMTTPA–CS–GO. | ||
3.4 Adsorption kinetics
The adsorption mechanism is analyzed by the pseudo-second-order kinetic model is as follows: t/qt = 1/k2qe2 + t/qe, where qt and qe represent the adsorbed amount (mg g−1) at time t and at equilibrium time (min), respectively, and k2 represents the pseudo-second-order rate constant of adsorption (g mol−1 min−1). As shown in Fig. 5B, we calculate the values of qe and k2 from the slope and intercept of the graphs of t/qt versus t, and the calculated results are listed in Table S3.† The correlation coefficients (R2 ≫ 0.99) of the pseudo-second-order model for Hg2+, Cu2+, Pb2+ and Cd2+ are very high. Therefore, it can be inferred that the adsorption of Hg2+, Cu2+, Pb2+ and Cd2+ on the BMTTPA–CS–GO nanocomposite is mainly attributed to the chemical interaction between BMTTPA–CS–GO and heavy metal ions.613.5 Comparison of BMTTPA–CS–GO with other adsorbents
The values of qm for Hg2+ removal by BMTTPA–CS–GO and other adsorbents are compared in Table S4.† It is clear that BMTTPA–CS–GO can be used as a good adsorbent for removing Hg2+ from water. The high adsorption capacity of Hg2+ on BMTTPA–CS–GO is due to the large number of thioether units on the pore walls that have a strong affinity to Hg2+. Although the qm value of BMTTPA–CS–GO for removing Hg2+ is not the highest, the covalently linked BMTTPA–CS–GO nanocomposite is a stable, low-cost, efficient and environmentally friendly adsorbent that can be mass-produced. Therefore, BMTTPA–CS–GO is a highly practical material for contaminated water or drinking water treatment applications.3.6 Regeneration and recycling of BMTTPA–CS–GO
Adsorption–desorption experiments show that 0.1 M nitric acid has a high elution efficiency (>86.5%) even after six cycles (Fig. S7†). In addition, elution of Hg2+ with nitric acid did not affect the adsorption performance of BMTTPA–CS–GO, and it maintained a high adsorption capacity even after six cycles. These results prove that BMTTPA–CS–GO has good reusability.3.7 Adsorption mechanism of Hg2+ by BMTTPA–CS–GO
The XPS spectra of BMTTPA–CS–GO before and after adsorption of heavy metal ions were analyzed to understand the adsorption mechanism of heavy metal ions on BMTTPA–CS–GO (Fig. 6). A new binding energy peak is found at 102 eV after Hg2+ adsorption, which can be attributed to Hg 4f photoelectron, indicating that Hg2+ is adsorbed on BMTTPA–CS–GO.61,62 The spectra of Hg 4f5/2 and Hg 4f7/2 photoelectrons measured after adsorption of Hg2+ by BMTTPA–CS–GO show clear binding energy shifts compared to Hg2+ (Fig. 6B), indicating that Hg2+ combined with N and S atoms in BMTTPA–CS–GO to form a new complex.29,63 This can be verified by the observed changes in the S 2p spectrum of BMTTPA–CS–GO before and after Hg2+ adsorption. Deconvoluted peaks of the S 2p spectrum at 168.0 and 169.2 eV shown in Fig. 6C can be attributed to S 2p photoelectron in C–SOx groups.64–66 After the adsorption of Hg2+, the peaks are obviously lower in intensity and new deconvolution peaks at 164.0 and 162.8 eV appear in the spectrum (Fig. 6D), which could be assigned to the formation C–S⋯Hg complexes. The element mapping spectra of BMTTPA–CS–GO show that the H and S elements are highly overlapping, which proves that BMTTPA–CS is the key factor of adsorption (Fig. S8†). The N 1s spectra of BMTTPA–CS–GO before and after Hg2+ adsorption are shown in Fig. 6E and F, respectively. The N 1s spectrum of BMTTPA–CS–GO before Hg2+ adsorption includes three peaks that can be assigned to CN (399.2 eV), C–N (400.2 eV), and N–H (401.7 eV), respectively.67 After Hg2+ adsorption, the three binding energy peaks are markedly decreased. Such decreases are primarily due to the fact that the N atoms in the amino and amide groups share their spare electrons with Hg causing a decrease in electron density. These results show that amide and amino are also the primary groups that contribute to the excellent adsorption capacity of BMTTPA–CS–GO.68 Comparison of the XPS spectra of BMTTPA–CS–GO before and after Hg2+ adsorption shows that Hg2+ has a strong chelation interaction with N and S atoms in BMTTPA–CS–GO. These results indicate that the strong adsorption behavior is mainly due to the chelation between Hg2+ and BMTTPA–CS–GO (Scheme 1).
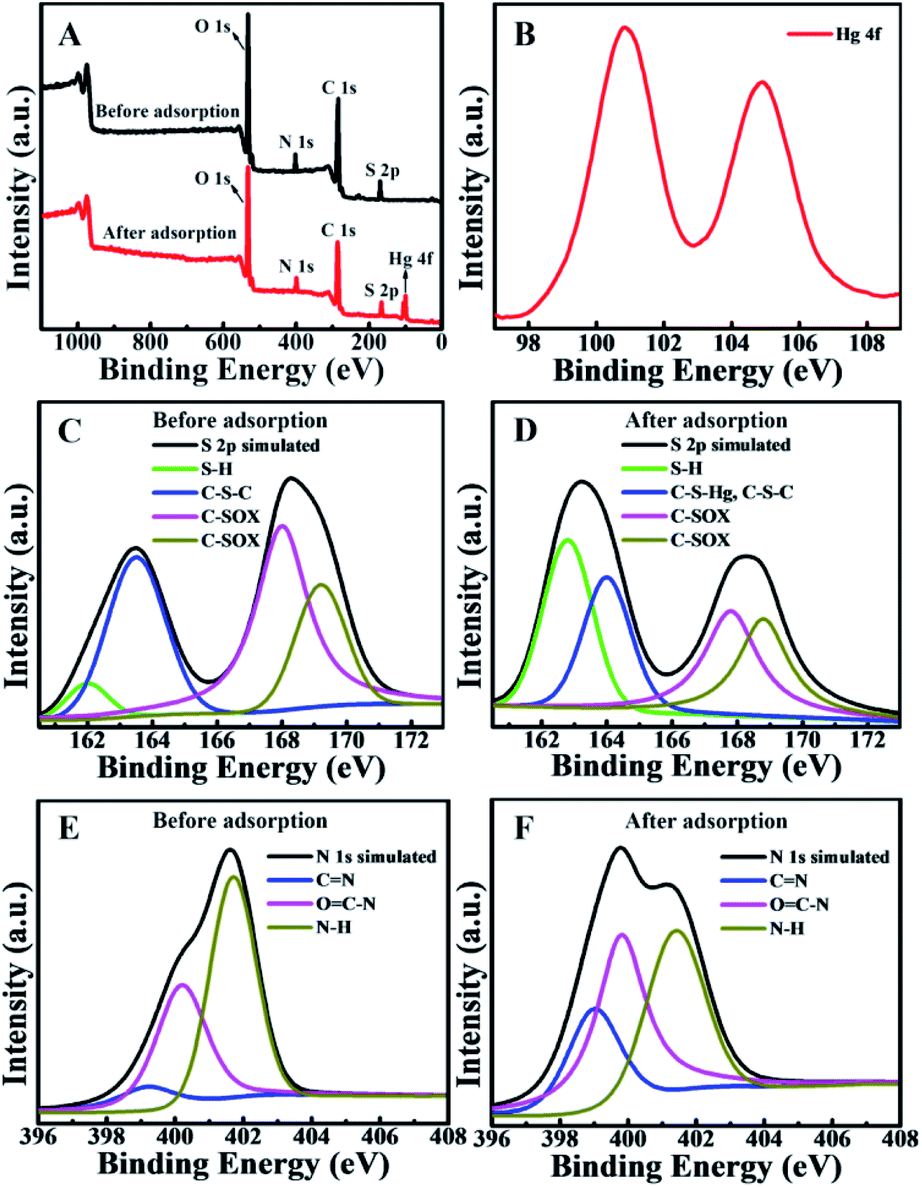 | ||
| Fig. 6 XPS spectra of BMTTPA–CS–GO before and after Hg2+ adsorption. (A) XPS survey spectra. (B) High-resolution spectrum of Hg 4f electron after Hg2+ adsorption. The S 2p spectra before (C) and after (D) Hg2+ adsorption. The N 1s spectra before (E) and after (F) Hg2+ adsorption. | ||
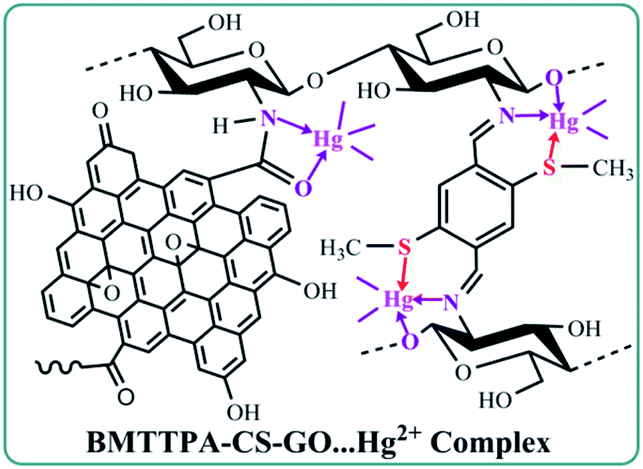 | ||
| Scheme 1 The proposed chelating compound structure of Hg2+ and BMTTPA–CS–GO. | ||
4. Conclusion
In conclusion, a novel porous BMTTPA–CS–GO nanocomposite was prepared by covalently grafting BMTTPA–CS onto GO surface, and used for the removal of heavy metal ions from polluted water. The adsorption performance of BMTTPA–CS–GO is better than that of most reported adsorbents used for the removal of heavy metal ions from contaminated water. Importantly, the stable, environmentally friendly, cost-effective and excellent adsorption performance of BMTTPA–CS–GO make it a promising nanocomposite for the removal of Hg2+ and other heavy metal ions from polluted water, and even drinking water. This study suggests that covalently linked crucial functional groups on the surface of carbon-based material are essential for the development of adsorbents with excellent performance for heavy metal ion adsorption.Data availability statement
The data that support the findings of this study are available within the article and its ESI† material.Conflicts of interest
There are no conflicts to declare.Acknowledgements
We gratefully acknowledge the support from the National Natural Science Foundation of China (21675078, 21976077 and 22036003), the Natural Science Foundation of Jiangxi Province (2018ACB21008) and the Science and Technology Innovation Platform Project of Jiangxi Province (20192BCD40001).References
- F. S. Awad, K. M. AbouZeid, W. M. A. El-Maaty, A. M. El-Wakiland and M. S. El-Shall, ACS Appl. Mater. Interfaces, 2017, 9, 34230–34242 CrossRef CAS.
- Z. Fu, W. Guo, Z. Dang, Q. Hu, F. Wu, C. Feng, X. Zhao, W. Meng, B. Xing and J. P. Giesy, Environ. Sci. Technol., 2017, 51, 3117–3118 CrossRef CAS.
- S. Pourbeyram, Ind. Eng. Chem. Res., 2016, 55, 5608–5617 CrossRef CAS.
- F. Fu and Q. Wang, Removal of heavy metal ions from wastewaters: a review, J. Environ. Manage., 2011, 92, 407–418 CrossRef CAS.
- Y. Shen, Q. Fang and B. Chen, Environ. Sci. Technol., 2015, 49, 67–84 CrossRef CAS.
- Z. Li, D. Xiao, Y. Ge and S. Koehler, ACS Appl. Mater. Interfaces, 2015, 7, 15000–15009 CrossRef CAS.
- J. Gong, T. Liu, X. Wang, X. Hu and L. Zhang, Environ. Sci. Technol., 2011, 45, 6181–6187 CrossRef CAS.
- D. P. Krabbenhoft and E. M. Sunderland, Science, 2013, 341, 1457–1458 CrossRef CAS.
- R. P. Schwarzenbach, B. I. Escher, K. Fenner, T. B. Hofstetter, C. A. Johnson, U. von Gunten and B. Wehrli, Science, 2006, 313, 1072–1077 CrossRef CAS.
- G. Zhao, J. Li, X. Ren, C. Chen and X. Wang, Environ. Sci. Technol., 2011, 45, 10454–10462 CrossRef CAS.
- S. Yang, J. Hu, C. Chen, D. Shao and X. Wang, Environ. Sci. Technol., 2011, 45, 3621–3627 CrossRef CAS.
- C. J. Madadrang, H. Y. Kim, G. Gao, N. Wang, J. Zhu, H. Feng, M. Gorring, M. L. Kasner and S. Hou, ACS Appl. Mater. Interfaces, 2012, 4, 1186–1193 CrossRef CAS.
- G.-B. Cai, G.-X. Zhao, X.-K. Wang and S.-H. Yu, J. Phys. Chem. C, 2010, 114, 12948–12954 CrossRef CAS.
- S. Ahmadian-Fard-Fini, D. Ghanbari, O. Amiri and M. Salavati-Niasari, Carbohydr. Polym., 2020, 229, 115428 CrossRef CAS.
- T. Sangvanich, V. Sukwarotwat, R. J. Wiacek, R. M. Grudzien, G. E. Fryxell, R. S. Addleman, C. Timchalk and W. Yantasee, J. Hazard. Mater., 2010, 182, 225–231 CrossRef CAS.
- Y. L. F. Musico, C. M. Santos, M. L. P. Dalida and D. F. Rodrigues, J. Mater. Chem. A, 2013, 1, 3789–3796 RSC.
- P. Miretzky and A. F. Cirelli, J. Hazard. Mater., 2010, 180, 1–19 CrossRef CAS.
- Y.-C. Shih, C.-Y. Ke, C.-J. Yu, C.-Y. Lu and W.-L. Tseng, ACS Appl. Mater. Interfaces, 2014, 6, 17437–17445 CrossRef CAS.
- Y. Guo, J. Deng, J. Zhu, X. Zhou and R. Bai, RSC Adv., 2016, 6, 82523–82536 RSC.
- M. D. Stoller, S. Park, Y. Zhu, J. An and R. S. Ruoff, Nano Lett., 2008, 8, 3498–3502 CrossRef CAS.
- H. M. A. Hassan, V. Abdelsayed, A. E. R. S. Khder, K. M. AbouZeid, J. Terner, M. S. El-Shall, S. I. Al-Resayes and A. A. El-Azhary, J. Mater. Chem., 2009, 19, 3832–3837 RSC.
- W. Gao, M. Majumder, L. B. Alemany, T. N. Narayanan, M. A. Ibarra, B. K. Pradhan and P. M. Ajayan, ACS Appl. Mater. Interfaces, 2011, 3, 1821–1826 CrossRef CAS.
- H. Bao, Y. Pan, Y. Ping, N. G. Sahoo, T. Wu, L. Li, J. Li and L. H. Gan, Small, 2011, 7, 1569–1578 CrossRef CAS.
- D. R. Dreyer, S. Park, C. W. Bielawski and R. S. Ruoff, Chem. Soc. Rev., 2010, 39, 228–240 RSC.
- A. Tadjarodi, S. Moazen Ferdowsi, R. Zare-Dorabei and A. Barzin, Ultrason. Sonochem., 2016, 33, 118–128 CrossRef CAS.
- L. Huang, M. He, B. Chen, Q. Cheng and B. Hu, ACS Appl. Mater. Interfaces, 2017, 9, 2550–2559 CrossRef CAS.
- J. Bao, Y. Fu and Z. Bao, Nanoscale Res. Lett., 2013, 8, 486 CrossRef.
- V. Chandra, J. Park, Y. Chun, J. W. Lee, I.-C. Hwang and K. S. Kim, ACS Nano, 2010, 4, 3979–3986 CrossRef CAS.
- V. Chandra and K. S. Kim, Chem. Commun., 2011, 47, 3942–3944 RSC.
- Y. Chen, L. Chen, H. Bai and L. Li, J. Mater. Chem. A, 2013, 1, 1992–2001 RSC.
- L. M. Veca, F. Lu, M. J. Meziani, L. Cao, P. Zhang, G. Qi, L. Qu, M. Shrestha and Y.-P. Sun, Chem. Commun., 2009, 2565–2567 RSC.
- B. Dai, M. Cao, G. Fang, B. Liu, X. Dong, M. Pan and S. Wang, J. Hazard. Mater., 2012, 219, 103–110 CrossRef.
- Z. Wu, W. Feng, Y. Feng, Q. Liu, X. Xu, T. Sekino, A. Fujii and M. Ozaki, Carbon, 2007, 45, 1212–1218 CrossRef CAS.
- M. A. Salam and M. S. I. Makki, J. Alloys Compd., 2011, 509, 2582–2587 CrossRef CAS.
- K. Z. Elwakeel, Desalination, 2010, 250, 105–112 CrossRef CAS.
- H. N. Abdelhamid, Y. C. Lin and H.-F. Wu, Microchim. Acta, 2017, 184, 1517–1527 CrossRef CAS.
- H. Bao, J. Hu, L. H. Gan and L. Li, J. Polym. Sci., Part A: Polym. Chem., 2009, 47, 6682–6692 CrossRef CAS.
- H. Bao, L. Li, L. H. Gan, Y. Ping, J. Li and P. Ravi, Int. J. Biol. Macromol., 2010, 43, 5679–5687 CrossRef CAS.
- R. Qu, C. Sun, F. Ma, Y. Zhang, C. Ji, Q. Xu, C. Wang and H. Chen, J. Hazard. Mater., 2009, 167, 717–727 CrossRef CAS.
- M. Salavati-Niasari, J. Hasanalian and H. Najafian, J. Mol. Catal. A: Chem., 2004, 209, 209–214 CrossRef CAS.
- M. Salavati-Niasari and S. H. Banitaba, J. Mol. Catal. A: Chem., 2003, 201, 43–54 CrossRef CAS.
- M. Salavati-Niasari, Inorg. Chem. Commun., 2005, 8, 174–177 CrossRef CAS.
- N. Huang, L. Zhai, H. Xu and D. Jiang, J. Am. Chem. Soc., 2017, 139, 2428–2434 CrossRef CAS.
- L. Fan, C. Luo, X. Li, F. Lu, H. Qiu and M. Sun, J. Hazard. Mater., 2012, 215–216, 272–279 CrossRef CAS.
- M. Salavati-Niasari, M. Shakouri-Arani and F. Davar, Microporous Mesoporous Mater., 2008, 116, 77–85 CrossRef CAS.
- S. Ahmadian-Fard-Fini, D. Ghanbari and M. Salavati-Niasari, Composites, Part B, 2019, 161, 564–577 CrossRef CAS.
- F. Mohandes and M. Salavati-Niasari, RSC Adv., 2014, 4, 25993–26001 RSC.
- M. Sahin, N. Kocak, G. Arslan and H. I. Ucan, J. Inorg. Organomet. Polym., 2011, 21, 69–80 CrossRef CAS.
- Z. Yang, Y. Dai, S. Wang, H. Cheng and J. Yu, RSC Adv., 2015, 5, 78017–78025 RSC.
- H. Huang, Y. C. Lu, A.-J. Wang, J. H. Liu, J. R. Chen and J. J. Feng, RSC Adv., 2014, 4, 11872–11875 RSC.
- E. Esmaeili, M. Salavati-Niasari, F. Mohandes, F. Davar and H. Seyghalkar, Chem. Eng. J., 2011, 170, 278–285 CrossRef CAS.
- S. S. Park, S. W. Chu, C. Xue, D. Zhao and C. S. Ha, J. Mater. Chem., 2011, 21, 10801–10807 RSC.
- L. Li, Y. Huang, Y. Wang and W. Wang, Anal. Chim. Acta, 2009, 631, 182–188 CrossRef CAS.
- R. Sitko, E. Turek, B. Zawisza, E. Malicka, E. Talik, J. Heimann, A. Gagor, B. Feist and R. Wrzalik, Dalton Trans., 2013, 42, 5682–5689 RSC.
- V. C. Taty-Costodes, H. Fauduet, C. Porte and A. Delacroix, J. Hazard. Mater., 2003, 105, 121–142 CrossRef CAS.
- M. Bansal, D. Singh and V. K. Garg, J. Hazard. Mater., 2009, 171, 83–92 CrossRef CAS.
- Z. Li, Y. Kong and Y. Ge, Chem. Eng. J., 2015, 270, 229–234 CrossRef CAS.
- L. Cui, X. Guo, Q. Wei, Y. Wang, L. Gao, L. Yan, T. Yan and B. Du, J. Colloid Interface Sci., 2015, 439, 112–120 CrossRef CAS.
- C. Zhang, J. Sui, J. Li, Y. Tang and W. Cai, Chem. Eng. J., 2012, 210, 45–52 CrossRef CAS.
- C. Xiong, Q. Jia, X. Chen, G. Wang and C. Yao, Ind. Eng. Chem. Res., 2013, 52, 4978–4986 CrossRef CAS.
- Q. Zhang, S. Dan and K. Du, Ind. Eng. Chem. Res., 2017, 56, 8705–8712 CrossRef CAS.
- A. S. K. Kumar and S. J. Jiang, RSC Adv., 2015, 5, 6294–6304 RSC.
- L. Dupont and E. Guillon, Environ. Sci. Technol., 2003, 37, 4235–4241 CrossRef CAS.
- M. Salavati-Niasari, F. Davar and M. Mazaheri, J. Alloys Compd., 2009, 470, 502–506 CrossRef CAS.
- A. Rostami-Vartooni, M. Nasrollahzadeh, M. Salavati-Niasari and M. Atarod, J. Alloys Compd., 2016, 689, 15–20 CrossRef CAS.
- M. Salavati-Niasari, F. Davar and Z. Fereshteh, Chem. Eng. J., 2009, 146, 498–502 CrossRef CAS.
- Y. Shen and B. Chen, Environ. Sci. Technol., 2015, 49, 7364–7372 CrossRef CAS.
- L. L. Ling, W. J. Liu, S. Zhang and H. Jiang, Environ. Sci. Technol., 2017, 51, 10081–10089 CrossRef CAS.
Footnotes |
| † Electronic supplementary information (ESI) available: Characterization of the nanocomposite, synthetic procedures, Scheme S1: preparation of BMTTPA–CS–GO, Fig. S1: AFM of BMTTPA–CS–GO, Fig. S2: EDX of BMTTPA–CS–GO, Fig. S3: XPS of BMTTPA–CS, Fig. S4: TGA and DTC of BMTTPA–CS–GO, Fig. S5: DSC of BMTTPA–CS–GO, Fig. S6: BET, BJH, XRD and Raman spectrum of BMTTPA–CS–GO, Fig. S7: reusability of BMTTPA–CS–GO, Fig. S8: MAP of BMTTPA–CS–GO, Table S1: CHN of BMTTPA–CS–GO, Table S2: Langmuir isotherms parameters for the adsorption of heavy metal ions, Table S3: kinetic parameters for the adsorption of heavy metal ions, Table S4: comparison of Hg2+ adsorption. See DOI: 10.1039/d0ra07836k |
| ‡ These authors contributed equally to this work. |
| This journal is © The Royal Society of Chemistry 2021 |