
 Open Access Article
 This Open Access Article is licensed under a Creative Commons Attribution-Non Commercial 3.0 Unported Licence
Slow kinetic evolution of nanohelices based on gemini surfactant self-assemblies with various enantiomeric excess; chiral segregation towards a racemic mixture†
Jie
Gao
 a,
Yutaka
Okazaki
ab,
Emilie
Pouget
a,
Sylvain
Nlate
a,
Brice
Kauffmann
c,
Franck
Artzner
d,
Thierry
Buffeteau
*e and
Reiko
Oda
*a
a,
Yutaka
Okazaki
ab,
Emilie
Pouget
a,
Sylvain
Nlate
a,
Brice
Kauffmann
c,
Franck
Artzner
d,
Thierry
Buffeteau
*e and
Reiko
Oda
*a
aInstitute of Chemistry & Biology of Membranes & Nanoobjects (UMR5248 CBMN), CNRS - Université de Bordeaux – Bordeaux INP, 2 rue Robert Escarpit, 33607 Pessac, France. E-mail: reiko.oda@u-bordeaux.fr
bGraduate School of Energy Science, Kyoto University, Yoshida-Honmachi, Sakyo-ku, Kyoto 606-8501, Japan
cInstitut Européen de Chimie et Biologie (UMS 3033), Université de Bordeaux-CNRS-INSERM, 2 rue Robert Escarpit, 33607 Pessac, France
dUniv Rennes, CNRS, IPR (Institut de Physique de Rennes) – UMR 6251, F-35000 Rennes, France
eInstitut des Sciences Moléculaires (UMR5255 ISM), CNRS – Université de Bordeaux, 351 Cours de la Libération, 33405 Talence, France. E-mail: thierry.buffeteau@u-bordeaux.fr
First published on 2nd February 2021
Abstract
Very slow kinetic evolution (days) of chiral nanoribbons based on amphiphilic molecular assemblies is investigated for various enantiomeric excess. In the early stage of ribbon formation, those formed for low enantiomeric excess (0 ≤ ee ≤ 0.5) show chiral segregation, and are made with a mixture of short-pitched right-handed and left-handed twisted ribbons. With time, these nano-ribbons merge to form ribbons with larger pitch and single-handedness, which is determined by the majority enantiomer.
Introduction
Chirality, the property of an object non-superposable on its mirror image, is a geometric property generally described for molecules by the presence of chiral centers, or for helical structures as observed in supra- or macromolecules such as helical polymers or helicenes, but also for much larger objects such as hands, tree trunks or snail shells. A concept which is of particular interest is the transmission/transfer or amplification of chirality information which can be observed at intra- or inter-molecular levels and hierarchical construction from a molecule to nanometric or micrometric self-assembly (amplification of chiral signals). A variety of macromolecular and supramolecular helical systems are reported in which a small chiral bias introduced in the monomeric units or components through covalent or noncovalent bond formation is significantly amplified with high cooperativity, resulting in a large helical sense excess of the entire polymer chains and helical assemblies.1 The asymmetry information of each building block or each molecule is transmitted to its neighbors to propagate chirality as the asymmetric interactions between different units can allow the recognition and the amplification of the chirality in order to create chiral 2D or 3D superstructures. It is important to note that not all chiral molecules show amplification of chiral signals when assembled. A highly delicate balance of inter–intra-molecular interactions is required and fine tuning/design of molecules or building blocks capable of expressing the chirality at higher dimensions is crucial. An important class of structures showing chiral morphology based on molecular assembly is fibrillar structures, in other words, helices, which have been extensively covered in the literature since the very first examples reported in the 40s–60s.2–4 The mechanisms of their formation were more thoroughly investigated in the 80s.5–9 Since then, the number of reports on these chiral fibrillary systems has increased exponentially, resulting in a number of very comprehensive reviews.1,10–13 Beyond the fundamental aspect with a number of elegant molecular designs for chiral supramolecular structures which showed remarkable development in the last decades, kinetic aspects on the formation of such intricate structures are also extremely important in order to understand how and why such structures form. The use of techniques such as nuclear magnetic resonance (NMR), electronic circular dichroism (ECD), vibrational circular dichroism (VCD), infrared (IR), and X-ray diffraction (XRD) spectroscopy has given powerful information on the mechanics and kinetics of molecular helix formation, which can vary from minutes to days.However, understanding how molecules self-assemble while the molecular chirality gets reflected in higher order chirality remains challenging. Indeed, chiral self-assembly is evidenced by multi-step structure formation through assembly formation and amplification of chiral signals with an ensemble of directional or non-directional interactions such as hydrophobic effects, ion–ion interactions, hydrogen bonds, π–π stacking or hindrance effects, for which each step may have different kinetics.14 Such arrangements will then evolve with time to give higher order mesoscopic supramolecular structures. Depending on the information (molecular, supramolecular, or mesoscopic level) obtained by each technique, the kinetics of organization observed may not be the same.
We have previously reported that achiral cationic gemini surfactants having the formula C2H4-1,2-((CH3)2N+C16H33)2, denoted as 16-2-16, self-assemble in water in the presence of chiral tartrate counterions to form nanometer-scale twisted or helical ribbons as well as tubules (Fig. 1).15
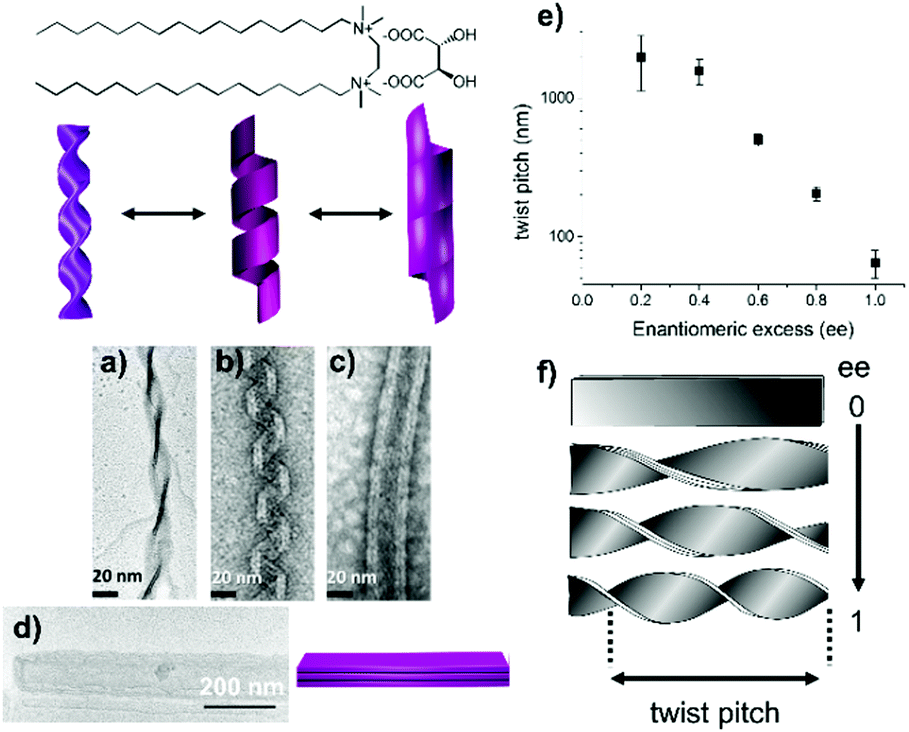 | ||
| Fig. 1 Chemical structure of 16-2-16 L-tartrate. Transmission electron microscopy (TEM) images and schematic representation of twisted ribbons (a), helical ribbons (b), and tubules (c) of 16-2-16 L-tartrate; and TEM image and schematic representation of flat ribbons of racemic 16-2-16 tartrate (d). The morphologies of the multilayer ribbons depend on the ee of the tartrate counterion. For a pure enantiomer, twisted ribbons form first and transform into helical ribbons and tubules with time. From ref. 15. | ||
The handedness of the ribbons depends on the L- or D-chiral configuration of tartrate (right- or left-handed ribbons are formed, respectively). Their twist pitch and their width decrease continuously upon increasing the enantiomeric excess (ee) (Fig. 1e and f), from flat multilayer membranes for the racemate (infinite pitch) (Fig. 1d) to highly twisted (Fig. 1a) or helical ribbons (Fig. 1b) and tubes (Fig. 1c) of the pure enantiomer (the pitch is about 100 nm for twisted ribbons and 65 nm for helical ribbons, Fig. S1, ESI†).16 We also showed that the counterions can be exchanged in situ by washing the fiber network with the tartaric acid solution from the opposite enantiomer, which led to slow handedness switching, which takes from hours to days.17
Such unprecedented easy tuning of chiral supramolecular structures is very intriguing and is clearly related to the original feature that the induction of chirality is solely due to the counterions, which are much more mobile than if the chiral center is in the body of amphiphiles. In this paper, we demonstrate a detailed study, using VCD, ECD and transmission and scanning electron microscopy (TEM and SEM), of the kinetic evolution of these chiral ribbons in the whole range of ee. We observed very slow (days) kinetics of the morphology evolution which can be closely related to the VCD properties.
Results and discussion
Kinetic evolution of 16-2-16 tartrate assemblies with various enantiomeric excess studied by TEM
As mentioned above, our previous report showed that when 16-2-16 with various ee is solubilized in water at ∼60 °C, and then cooled down to room temperature, it forms nanometer-scale twisted or helical ribbons, the pitch and the width of which increase with decreasing enantiomeric excess, enantiomeric excess. The pitch becomes infinite for the case of ee = 0 (flat ribbons).15–17In the present work, we performed a more detailed examination of how the shape of these ribbons evolves with time as observed with TEM images in Fig. 2 (1 mM samples with ee = 0, 0.25 and 1 for 2 or 8 hours (a–c), 2 days (d–f) and 4 days (g–i) aging). Surprisingly, until about 2 days aging, mixtures of right-handed and left-handed helices are observed for ee = 0 and 0.25. After 4 days (Fig. 2g–i), the pitches are much larger, and only single handed helices are observed (the handedness being determined by the majority enantiomer). This tendency was generally observed for all the samples with ee < 0.8 (Fig. S2, ESI†). For ee > 0.8, the evolution is quite different. First, only twisted ribbons are observed at around 1 hour, which then start to transform to helical ribbons after 2 hours. This evolution was in agreement with our previous data.16
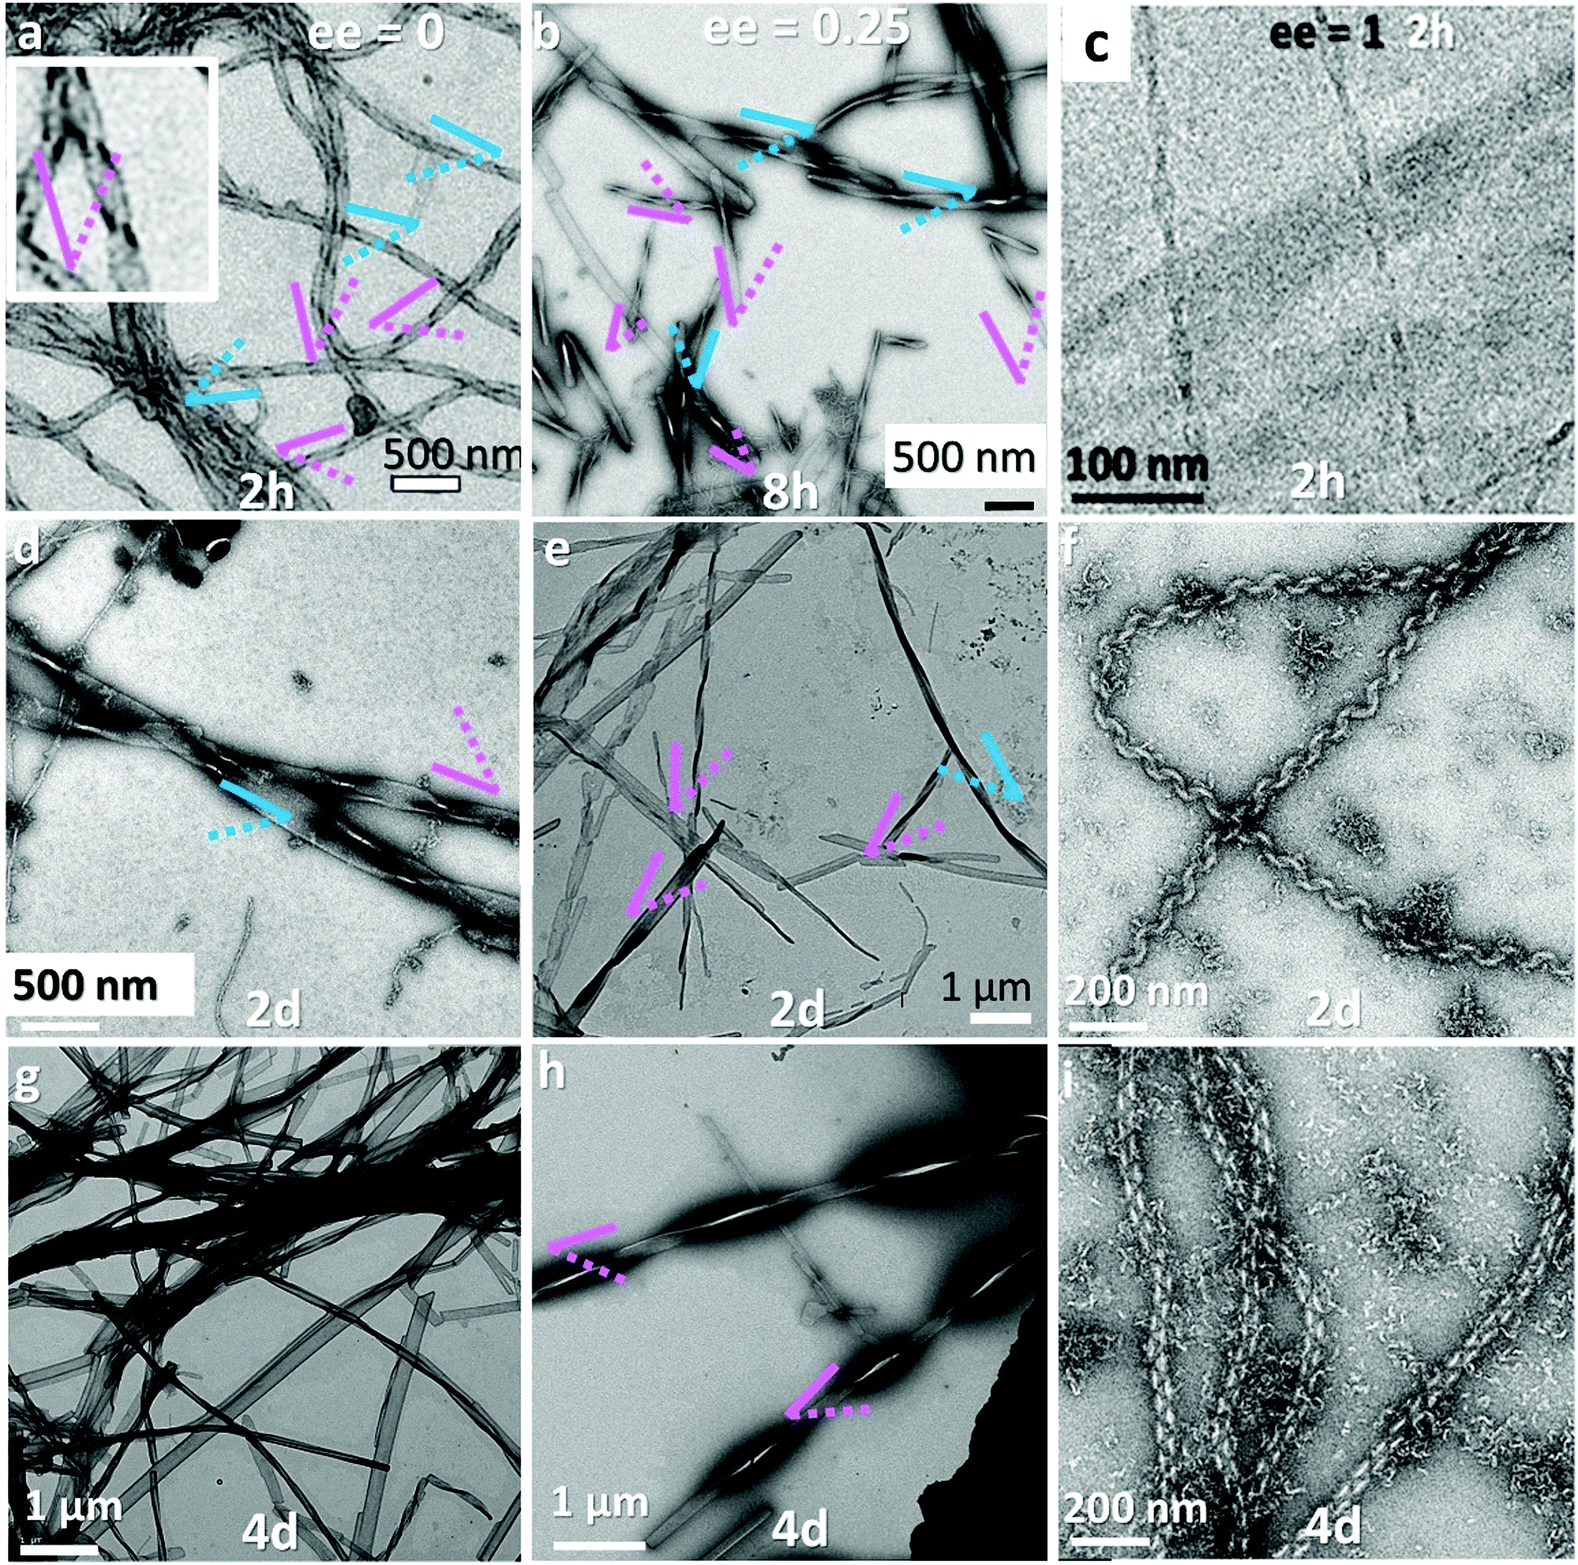 | ||
| Fig. 2 TEM observation of 16-2-16 tartrate with ee = 0 (a, d and g), 0.25 (b, e and h) and 1 (c, f and i) at different aging times (2 or 8 hours, 2 days and 4 days). The handedness of the helices is colored with pink (right) and blue (left). For ee = 0 and 0.25, until 2 days, twisted ribbons with opposite handedness coexist, which transform to form one-handed large ribbons after 4 days. For ee = 1, up to 2 hours, twisted ribbons are observed; after 2 days, only helical ribbons are observed. Except for (c) (cryo TEM image), all others are negative stained images which show the handedness of the ribbons (shown more clearly in the inset in (a)). | ||
The detailed examination of how the pitches, widths and morphologies evolve with time as a function of ee is shown in Fig. 3. If TEM is suitable to measure the pitch and the width of the helices, the transmission mode usually does not allow us to observe the handedness of helices. However, using the negative staining mode, one can observe how the helices turn due to how the dye accumulates around the helices in contact with the carbon film. Statistical analysis could then be performed on these TEM images. It was clearly revealed that both the pitch and width increase with time for ee < 0.8 (Fig. 3a). Fig. 3b shows that the increase in width is faster for the higher concentration with ee = 0.25, but the final value at equilibrium is the same for all the concentrations.
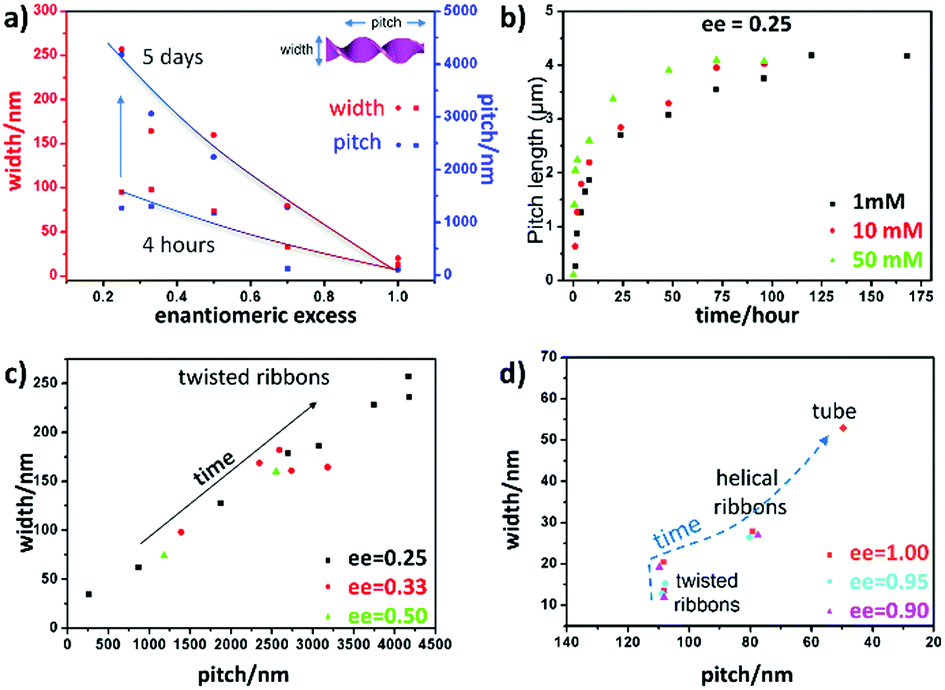 | ||
| Fig. 3 (a) Width and pitch of the ribbons plotted as a function of enantiomeric excess, comparing aging times of 4 hours and 5 days; (b) the increase of the ribbon's width as a function of time for different concentrations, 1, 10, 50 mM; and (c) and (d) the ribbon's width as a function of pitch for (c) ee = 0.25, 0.33, and 0.5 and (d) ee = 0.9, 0.95, and 1.0. | ||
In Fig. 3c, the ribbons’ width is plotted as a function of pitch for ee = 0.25, 0.33 and 0.5 after different aging times. There is a strong correlation between the pitch and the width of the ribbons, and they all fall in a line regardless of the ee and the age of the ribbons. Interestingly, the trend is different for the ribbons with ee > 0.8; the twist pitch does not vary at the beginning, and only the width of the ribbons increases with time (Fig. 3d): twisted ribbons with around 108 nm pitch and 20 nm width are formed at around 1–2 hours. These twisted ribbons get wider with time, and transform to helical ribbons when their width reaches around 28 nm (1.5 days for ee = 1 and 3, and 4 days for ee = 0.8) (Fig. S3 and Table S1, ESI†).
In parallel, the kinetic evolution of the 16-2-16 tartrate assemblies with various ee was followed by ECD and VCD. However, it was observed that for ee < 0.8, the ECD spectra in the 190–250 nm wavelength range after 24 hours deviated strongly to negative (positive) for 16-2-16 L- (D-)tartrate (Fig. S4, ESI†), which is likely due to the scattering from the large objects (Fig. S5, ESI†). Therefore, for the kinetic study, we focused on the VCD bisignate band for the νaCO2− mode at 1615 cm−1(Fig. 4a).
The detailed study on how the VCD signals evolve with time revealed a very interesting trend as shown in Fig. 4. Right after the samples are heated to the micellar phase (60 °C) and cooled down to room temperature (i.e. after around 1 hour), the g-factor is the highest for ee = 1, and decreases with decreasing ee as expected (Fig. 4a and b, blue dashed line). However, with time, the VCD g-factor continued to increase for the samples with ee < 0.8 (Fig. 4b and c). Surprisingly, the final equilibrium g-factor value (after 5 days) was much more pronounced for lower ee (Fig. 4c). On the other hand, the VCD signals of the samples for ee > 0.8 showed a different evolution trend. It increased for the first hour, and then decreased during the following few hours (Fig. 4d). The signal decreased more slowly for lower concentration (Fig. 4d inset). The final value at equilibrium is independent of the concentration, and is around 0.0004.
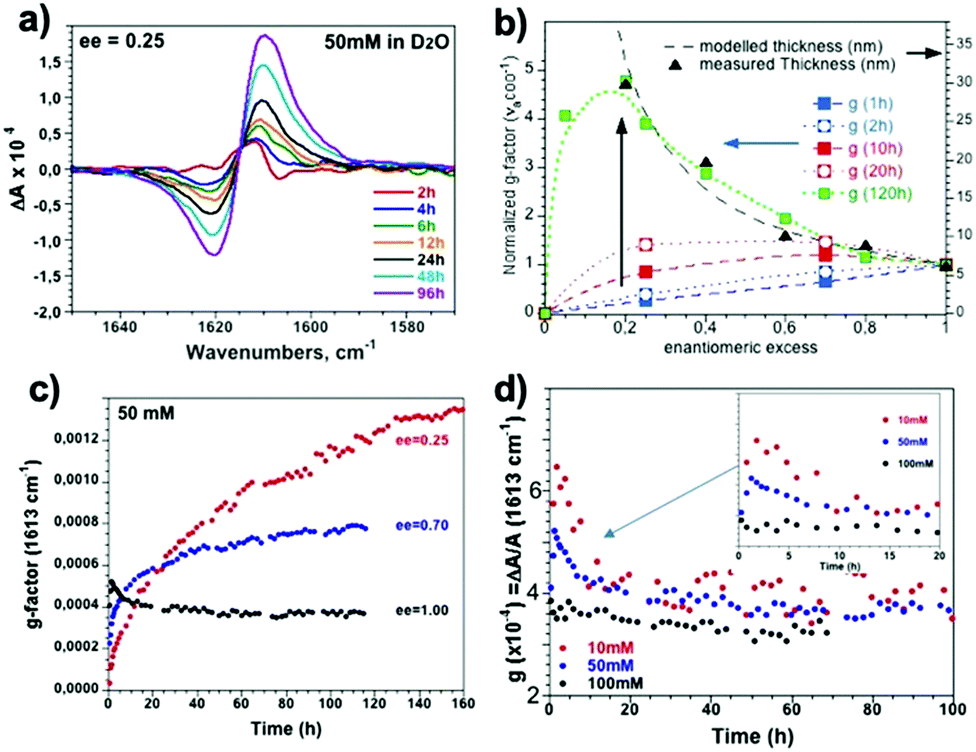 | ||
| Fig. 4 (a) VCD spectra of 16-2-16 L-tartrate (50 mM, ee = 0.25) as a function of aging time. (b) Normalized g-factor (with respect to ee = 1) of the νaCO2− band ((ΔA1620–ΔA1610)/A1615) obtained from 16-2-16 L-tartrate (50 mM) as a function of ee between 1 hour and 5 days aging. (c) g-Factors of the νaCO2− band for ee = 0.25, 0.7 and 1 (50 mM) as a function of time. (d) g-Factors of the νaCO2− band for ee = 1 for 10, 50, and 100 mM as a function of time until they reached the equilibrium values. | ||
These observations explain how the surprising ee dependence of the VCD signals that we have previously reported occurs, namely the g-factor goes through a maximum between ee = 0.05 and 0.2 for the samples aged for more than 2 days. The study we report here demonstrates that the presence of the maximum is the result of the increase with time of the g-factor for the low ee samples, at the final equilibrium state.
We have previously reported with small- and wide-angle X-ray scattering (SAXS and WAXS, respectively) studies associated with molecular modeling where the chiral ribbons formed with 16-2-16 tartrate follow well defined molecular organization.16,17 They are made of stacked heterochiral bilayers comprised of homochiral monolayers, and this organization is conserved through large morphology transitions from racemic flat multilayers to helical ribbons or tubules from pure enantiomers. The chirality of mono/bilayers is defined by the combination of the molecular chirality of (D- or L-) tartrate and the propagation of hydrogen bonds between tartrates and crystalline water molecules, and also by the gemini dications, which are intrinsically achiral but their headgroups N+–C–C–N+ adopt two mirror-image conformations, Z or  , through the formation of a strong ion pair with dianion tartrate (Fig. S6, ESI†). The number of bilayers decreases with ee and can be determined by 2/ee. This stacking of bilayers model suggests that while the molecular organization is crystal-like at the inner surfaces of the bilayers, those of the outer surfaces and at the ribbons edges are much more loosely organized, reminiscent of micellar surfaces.
However, this previous study was performed with aged (2–3 days) samples. Here, by following the time evolution of the helices, we observed that the VCD g-factors for small ee (ee = 0.25 for example) are lower than those with ee = 1 (Fig. 4) at the early stage of ribbon formation (1 h). The TEM images of the samples for ee = 0.25 revealed that they contained a mixture of small right and left handed ribbons (Fig. 2) co-existing separately (Fig. 5). In such systems, the VCD signals from both handed helices should cancel the signals of each other, and therefore the VCD signals should vary linearly with ee, which is indeed observed with the ribbons aged for 1 hour, e.g. g-factoree=0.25(1h) ∼ 0.25 × g-factoree=1(1h). With time, the increase of the width, thickness and pitch of the ribbons (ee = 0.25) is observed through merging of small opposite handed ribbons, creating thicker, larger and only one-handed twist ribbons (Fig. 5), accompanied by the increasing proportion of organized vs. disorganized molecules (Fig. S6, ESI†). At this stage (5 days), the single-handed large helices lead to cooperative enhancement of the VCD signals, g-factoree=0.25(5days) > g-factoree=1(5days). It is interesting to note that the proportion of g-factoree=0.25(5days)/g-factoree=1(5days) is very close to the proportion of the thickness of the ribbons for ee = 0.25(5 days)/ee = 1(5 days) = 4 (Fig. 4b).
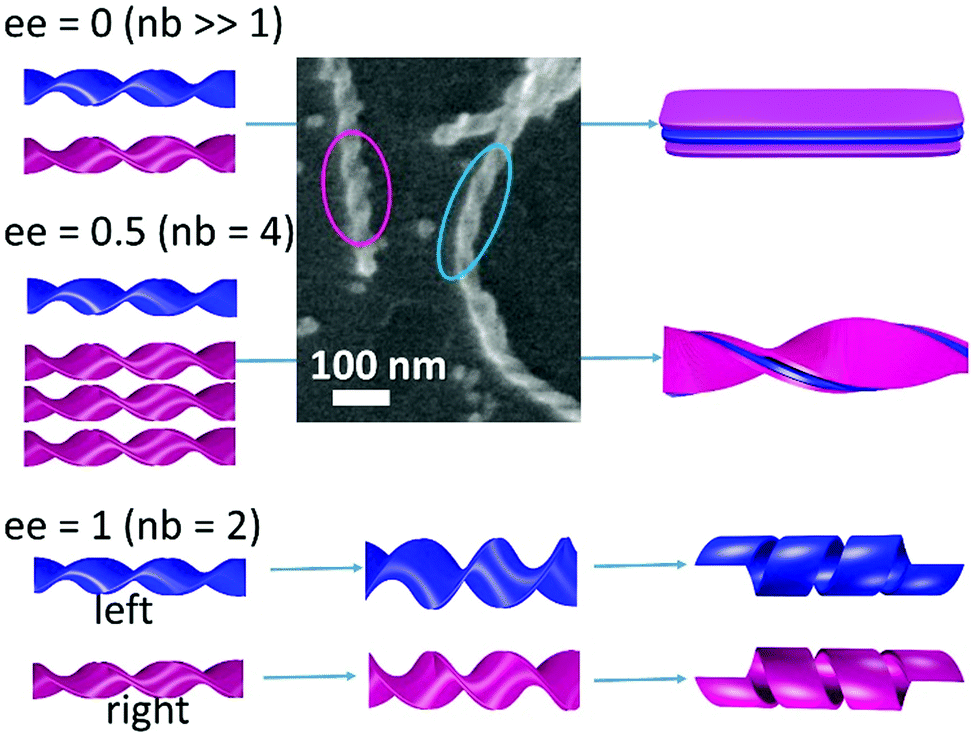 | ||
| Fig. 5 Two types of morphology evolution of 16-2-16 tartrate for ee = 0, 0.5 and 1. For the first two cases, at the early stage of self-assembly, opposite handed twisted ribbons co-exist, which merge with time to wider and thicker flat ribbons (ee = 0, nb = number of bilayers) or with only one handedness (ee = 0.5), which is determined by the enantiomeric excess. The SEM image is taken from the ee = 0 sample which was stabilized by a silica coating (sol–gel transcription) after 2 h aging at 20 °C in order to clearly see the handedness of the nanohelices (blue and pink circles for left and right-handed twisted ribbons, respectively). For ee = 1, at the early stage of the self-assembly formation, twisted ribbons are observed, the width of which increases with time until they transform to helical ribbons. | ||
The ensemble of observations confirms that the increase of the ratio between well-organized and disorganized molecules is closely related to the increase of the size of the chiral ribbons and the resulting enhancement of the VCD signal as observed with time for the ee = 0.25 systems. Indeed, all chiral or pro-chiral molecules, regardless of their D- or L-absolute configuration, are involved in ribbons that overall possess the same macroscopic handedness (dictated by the enantiomer in excess).
An interesting case in the extension of this observation is shown for the racemic mixture as shown in Fig. 5, which we reported previously as forming flat multilayered ribbons, but our present study shows that, at the very early stage, it forms a mixture of right and left handed small twist ribbons (Fig. 5 SEM image), which then merge to form larger and thicker ribbons with increasing pitch, until they form flat ribbons. This new finding suggests that the formation of these chiral ribbons is first entropy driven conglomeration, leading to the formation of metastable individual chiral ribbons. With time, the stacking of the bilayers and their growth in width occur, which can be considered as enthalpy driven due to the crystalline molecular organization following slow kinetics (∼10 hours to days). In contrast, for the ee = 1 system, they remain double bilayer systems, and no increase in the VCD signals is observed with time.
A closer look at the VCD signals along with the nanometric morphologies for ee > 0.8 showed that they are also closely related. Indeed, the increase of the g-factor in the first hours corresponds to twisted ribbon formation. The transformation from twisted to helical ribbons occurs when the ratio pitch/width (p/w) decreases and reaches ∼3 (ee = 0.9, p/w 2.9, ee = 0.95, p/w 3.0, ee = 1, p/w 2.9) (Table S1, ESI†). What is interesting is that this transformation is accompanied by a decrease of the VCD signals of about 30%. Once helical ribbons were formed, they eventually evolve to closed tubules (after ∼10 days for 1 mM and 5 days for 10 mM).17 This helix to tube transformation is accompanied both by the increase of the ribbon width and a pitch decrease18 (Table S1, ESI†). No notable change is observed in the ECD or VCD signals of the gemini moieties for this transformation.
The investigation on how the molecular organization and the interactions between chiral tartrates and gemini head groups can evolve during the modification/growth of the twisted ribbons observed for ee = 0 and 0.25 by SAXS and WAXS is very informative. Two possible behaviors can be expected during the self-assembly of a racemic mixture.19 Generally, molecular conformations found during self-assembly or crystallization of a racemic mixture hold an inversion center or mirror plane symmetry, and thus exhibit no chiral morphologies. Less frequently, chiral segregation occurs between L and D molecules (or salts),8 and their self-assembly morphologies are chiral, i.e. twisted or helical ribbons or nanotubes.20 If the molecular organization at the earlier stage of formation had been composed of a tartrate racemic mixture, twisted structures would not have been observed. This indicates that the system follows the latter case with a chiral segregation mechanism.
The SAXS patterns (Fig. S7, ESI†) are identical for both the intermediate (mixture of right- and left-handed small twisted ribbons) and final phases (large ribbons which are either flat (ee = 0) or twisted with only one handedness (e.g. ee = 0.25)),21 except for the decreasing FWHMs of the peaks, which decrease about 30% within 2–3 hours, indicating the preservation of a lamellar structure with chain interdigitation within the membrane. In the WAXS q-range, on the other hand, the intermediate phase exhibits distinct packing and a first order transition (coexistence) towards the stable phase. Indeed, in the intermediate phase, we observe a peak at 1.7 Å−1 in the ee = 25% sample (Fig. S7(a), ESI†) which is the signature of perpendicular chain orthorhombic packing.22 This peak disappears during the aging and the final chain packing is parallel.21 It is important to note that the shape of the cavities made by achiral gemini headgroups alone at the surface of bilayers should be statistically achiral in agreement with the mirror symmetry of the orthorhombic lattice (green packing of Fig. 6). However, the insertion of a tartrate enantiomer in the cavities requires the deformation of the head-group lattice. Such deformation of the cavities can propagate the chiral shape to the neighboring cavities in the plane of the membrane with the same chirality (blue and pink packing of Fig. 6). This mechanism thus propagates the homochirality along the head-group plane. Our system at the beginning of formation must also comply with the face-to-face homochirality propagation mechanism. Interestingly, the orthorhombic chain packing (peak at 1.7 Å−1) exhibits a two-fold axis symmetry (C2) parallel to the membrane plane and perpendicular to the ribbon axis (green, pink and blue ribbons of Fig. 6).22 This symmetry requires that both faces of the ribbons are identical, this condition does not satisfy the helical deformations but is suited with twisted ribbons.20,21 These homochirality propagation mechanisms are at the origin of the planar ribbon deformation into chiral twisted ribbons (Fig. 6).
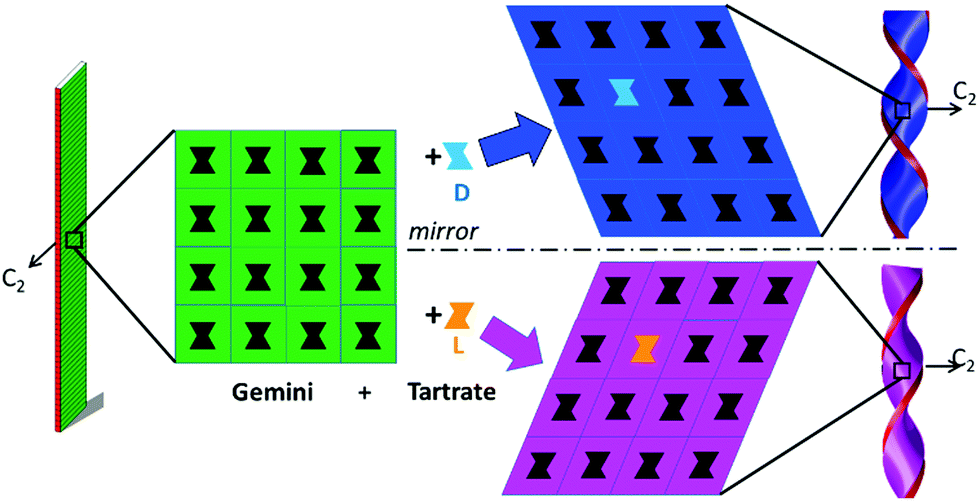 | ||
| Fig. 6 Mechanism of chirality segregation of achiral gemini ribbons (green) by insertion of chiral tartrates (L or D). The first insertion requires a deformation of the 2D lattice generating the same chirality for neighboring cavities. The two-fold axis is conserved and both faces of the twisted ribbons are identical. | ||
Based on these observations, we can propose the following crystallization mechanism (Fig. 6), which could explain the morphology evolution which is observed for the samples with ee < 0.8. Upon heating to dissolve the molecules, and then cooling, first, interdigitated bilayers with the aliphatic chain crystallized in orthorhombic perpendicular packing are formed as often observed in the most metastable (or transitory) phases.23 The symmetry between both faces imposes a twisted ribbon microscopic shape. But this packing is not the most stable, and, by a simple 90° rotation of the aliphatic chains within the membrane, the more stable packing,21 parallel packing, is obtained, which is compatible with achiral morphologies (flat membranes) or helical ribbons in the case of ee > 0.8.
Conclusions
In conclusion, we have observed the kinetic evolution of chiral molecular assemblies of tartrate counterions with non-chiral gemini surfactants for various enantiomeric excess in which the molecular chirality is amplified and leads to the chiral assemblies expressing the chirality at the mesoscopic level. We followed how such a network can evolve with time, and demonstrated the existence of slow (days) morphological evolution along with the spectral VCD evolution. For ee < 0.8, at the early stage of the self-assembly, mixtures of short-pitched twisted ribbons with opposite handedness are observed, which then merged to single-handed larger ribbons with larger pitches, accompanied by the increase of the VCD signal and by the modification of the symmetry of the molecular packing (perpendicular towards parallel) along with the increase of the global crystallinity of the molecules (enthalpy driven) as observed by WAXS. Such conglomerate formation was also observed for ee = 0, which started with equal numbers of right- and left-handed small twisted ribbons, which merge with time to form flat membranes. For ee > 0.8, twisted ribbons are first formed which increased in width with time until they transformed to helical ribbons. During this transition, the decrease of the VCD signal was observed. This feature may indicate a relaxation of the chiral packing due to the symmetry breaking occurring during the twisted (the two sides of the ribbons are identical) to helical (the inner- and outer-surface are different) transformation. The understanding of the hierarchical growth of such complex self-assembly is closely related to the understanding of the mechanism of chiral fibrillar systems found in nature such as protein aggregates or amyloids.Experimental section
Materials
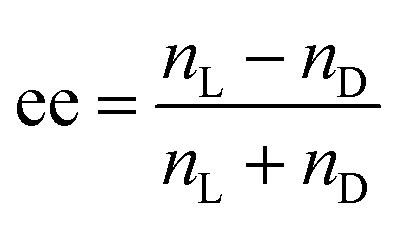
The synthesis of 16-2-16 tartrate has been described in our previous publications.16,17where nL and nD are the moles of L- and D-gemini tartrate, respectively. To make sure the two enantiomers are mixed homogenously in water during the self-assembly process, an organic solvent is used to dissolve the gemini tartrate at first. Take the ee = 0.25 gemini tartrate as an example: 6.75 mg of L-gemini tartrate and 3.25 mg of D-gemini tartrate were dissolved in 1–2 mL methanol. Then the mixture was kept under a vacuum to remove the methanol, and a white powder was present on the bottom of the container. At this time, a certain amount of ultrapure water was added according to the desired concentration and the solution was heated up to 60 °C to dissolve the gemini tartrate. After 15 min, the gemini tartrate could be totally dissolved in water and the solution was transferred into a cabinet with a controlled temperature of exactly 20 °C. The aging time started to be counted when the sample was placed at 20 °C.
The kinetic evolution of the 16-2-16 tartrate assemblies was investigated over several days. Baseline corrections of the VCD spectra were performed by subtracting the raw VCD spectra of a D2O solvent. The photoelastic modulator was adjusted for maximum efficiency in the mid-IR region at 1400 cm−1. Calculations were performed via the standard ThermoNicolet software, using Happ and Genzel apodization, de-Haseth phase-correction and a zero-filling factor of one.
![[thin space (1/6-em)]](https://www.rsc.org/images/entities/char_2009.gif) sinθ) by radial integration of the two-dimensional patterns. Gel samples were kept in sealed capillaries during data collection.
sinθ) by radial integration of the two-dimensional patterns. Gel samples were kept in sealed capillaries during data collection.
Conflicts of interest
There are no conflicts to declare.Acknowledgements
This work was supported by the France-Japan International Associated Laboratory, Chiral Nanostructures for Photonic Applications (LIA-CNPA), as well as the Centre National de la Recherche Scientifique and Université de Bordeaux. Y. O. acknowledges the JSPS Overseas Research Fellowship and SPIRITS 2020 of Kyoto University, and J. G. thanks Chinese Scholarship Council Fellowship and the LabEx AMADEus (ANR-10-LABX-42) in the framework of IdEx Bordeaux (ANR-10-IDEX-03-02). This work has benefited from the facilities and expertise of UMS3033/US001, http://www.iecb.u-bordeaux.fr/index.php/fr/plateformestechnologiques, and we thank A. Bezault for his help with cryo-TEM experiments F.A. acknowledges Rennes Metropoles for financial support.Notes and references
- E. Yashima, N. Ousaka, D. Taura, K. Shimomura, T. Ikai and K. Maeda, Supramolecular Helical Systems: Helical Assemblies of Small Molecules, Foldamers, and Polymers with Chiral Amplification and Their Functions, Chem. Rev., 2016, 116, 13752–13990 CrossRef CAS.
- A. W. Weitkamp, The Acidic Constituents of Degras. A New Method of Structure Elucidation, J. Am. Chem. Soc., 1945, 67(3), 447–454 CrossRef CAS.
- B. W. Hotten and D. H. Birdsall, Fine Structure and Rheological Properties of Lithium Soap–oil Dispersions, J. Colloid Sci., 1952, 7(3), 284–294 CrossRef CAS.
- T. Tachibana and H. Kambara, Enantiomorphism in the Helical Aggregate of Lithium 12-Hydroxystearate, J. Am. Chem. Soc., 1965, 87(13), 3015–3016 CrossRef CAS.
- N. Nakashima, S. Asakuma, J. M. Kim and T. Kunitake, Helical Superstructures are Formed from Chiral Ammonium Bilayers, Chem. Lett., 1984, 1709–1712 CrossRef CAS.
- P. Yager and P. E. Schoen, Mol. Formation of Tubules by a Polymerizable Surfactant, Mol. Cryst. Liq. Cryst., 1984, 106(3–4), 371–381 CrossRef CAS.
- K. Yamada, H. Ihara, T. Ide, T. Fukumoto and C. Hirayama, Formation of Helical Super Structure from Single-walled Bilayers by Amphiphiles with Oligo-L-Glutamic Acid-head Group, Chem. Lett., 1984, 1713–1716 CrossRef CAS.
- A. Singh, T. G. Burke, J. M. Calvert, J. H. Georger, B. Herendeen, R. R. Price, P. E. Schoen and P. Yager, Lateral Phase Separation Based on Chirality in a Polymerizable Lipid and Its Influence on Formation of Tubular Microstructures, Chem. Phys. Lipids, 1988, 47(2), 135–148 CrossRef CAS.
- J. H. Georger, A. Singh, R. R. Price, J. M. Schnur, P. Yager and P. E. Schoen, Helical and Tubular Microstructures Formed by Polymerizable Phosphatidylcholines, J. Am. Chem. Soc., 1987, 109(20), 6169–6175 CrossRef CAS.
- L. Zhang, T. Wang and Z. Shen, Chiral Nanoarchitectonics: Towards the Design, Self-assembly, and Function of Nanoscale Chiral Twists and Helices, Adv. Mater., 2016, 28(6), 1044–1059 CrossRef CAS.
- Y. Wang, J. Xu, Y. Wang and H. Chen, Emerging Chirality in Nanoscience, Chem. Soc. Rev., 2013, 42, 2930–2962 RSC.
- C. Li, K. Deng, Z. Tang and L. Liang, Twisted Metal-Amino Acid Nanobelts: Chirality Transcription from Molecules to Frameworks, J. Am. Chem. Soc., 2010, 132(23), 8202–8209 Search PubMed.
- M. Liu, L. Zhang and T. Wang, Supramolecular Chirality in Self-assembled Systems, Chem. Rev., 2015, 115(15), 7304–7397 CrossRef CAS.
- A. C. Mendes, E. T. Baran, R. L. Reis and H. S. Azevedo, Self-assembly in Nature: Using the Principles of Nature to Create Complex Nanobiomaterials, Wiley Interdiscip. Rev.: Nanomed. Nanobiotechnol., 2013, 5, 582–612 CAS.
- R. Oda, I. Huc, M. Schmutz, S. J. Candau and F. C. Mackintosh, Tuning bilayer twist using chiral counterions, Nature, 1999, 399, 566–569 CrossRef CAS.
- A. Brizard, C. Aime, T. Labrot, I. Huc, D. Berthier, F. Artzner, B. Desbat and R. Oda, Counterion, Temperature, and Time Modulation of Nanometric Chiral Ribbons from Gemini-Tartrate Amphiphiles, J. Am. Chem. Soc., 2007, 129, 3754–3762 CrossRef CAS.
- A. Brizard, D. Berthier, C. Aimer, T. Buffeteau, D. Cavagnat, L. Ducasse, I. Huc and R. Oda, Molecular and Supramolecular Chirality in Gemini-Tartrate Amphiphiles Studied by Electronic and Vibrational Circular Dichroisms, Chirality, 2009, 21(1E), E153–E162 CrossRef CAS.
- T. Shimizu, M. Masuda and H. Minamikawa, Supramolecular Nanotube Architectures Based on Amphiphilic Molecules, Chem. Rev., 2005, 105(4), 1401–1444 CrossRef CAS.
- J. Jacques, A. Collet and S. H. Wilen, Enantiomers, Racemates, and Resolutions, 1st edn, 1981 Search PubMed.
- C. Valery, F. Artzner and M. Paternostre, Peptide nanotubes: Molecular Organisations, Self-assembly Mechanisms and Applications, Soft Matter, 2011, 7, 9583 RSC.
- R. Oda, F. Artzner, M. Laguerre and I. Huc, Molecular Structure of Self-Assembled Chiral Nanoribbons and Nanotubules Revealed in the Hydrated State, J. Am. Chem. Soc., 2008, 130, 14705–14712 CrossRef CAS.
- S. Abrahamsson, B. Dahlen, H. Lofgren and I. Pascher, Lateral Packing of Hydrocarbon Chains, Prog. Chem. Fats other Lipids, 1978, 16, 125–143 CrossRef CAS.
- C. Allais, G. Keller, P. Lesieur, M. Ollivon and F. Artzner, X-ray Diffraction/Calorimetry Coupling, J. Therm. Anal. Calorim., 2003, 74(3), 723–728 CrossRef CAS.
Footnote |
| † Electronic supplementary information (ESI) available. See DOI: 10.1039/d0qm00989j |
| This journal is © the Partner Organisations 2021 |