DOI:
10.1039/D1QI00297J
(Research Article)
Inorg. Chem. Front., 2021,
8, 3037-3048
Effect of dz2 orbital electron-distribution of La-based inorganic perovskites on surface kinetics of a model reaction†
Received
7th March 2021
, Accepted 22nd April 2021
First published on 23rd April 2021
Abstract
Lanthanum-based perovskites, LaMO3 (M = Co, Fe, Mn, Ni, Cr, Cu, Zn) were synthesized using sol–gel method and characterised using both physical and chemical techniques. Despite the prominence of inorganic perovskites in catalysis, catalyst-specific descriptors that enable design of reaction- or substrate-specific catalysts are not clearly defined. In this work, we put more emphasis on HOMO electron distributions in the degenerate eg orbital of first row transition metals in the B-site of La-based inorganic perovskites. Herein, preliminary findings obtained using density functional theory calculations indicate that the oxidation of morin is dependent on the occupation of the dz2 orbital rather than the entire eg orbital. Regions of low and high dz2 orbital occupation result in high catalytic activity compared to half-filled occupation. Furthermore, the LaCrO3 perovskite with a lowest surface area, 2.7 m2 g−1 gave the highest activity, 7.16 × 10⁻² s−1 suggesting that the surface area cannot be used as the sole descriptor for catalytic activity.
1. Introduction
Inorganic perovskites are the most studied mixed-metal oxides because of their interesting chemical and physical properties. These materials are characterized by the general formula of ABO3 where the A-site is often occupied by a lanthanide, alkali, or alkali-earth metal cation, while the B-site is often occupied by a transition metal cation, and O denotes the oxygen atoms bonded to both A and B cations.1 A notable feature about these materials is the possibility of changing the composition by partial substitution of cations at either A- or B-site in order to enhance the catalytic activity and related chemical and structural properties of the perovskite.2,3 Despite promising features, the presence of BO6 coordination environment in the ABO3 system makes transition metal-containing perovskites susceptible to Jahn–Teller distortion due to degeneracy in the eg orbital set of the B site.4
In catalysis, there is limited literature that correlates the distortions in heterogeneous systems with their catalytic activity.5 A recent study on similar systems indicated that the electron distribution around the transition metal can be used as an activity descriptor.6 Occupation of the eg orbital was found to give a volcano curve which aids in selecting combinations that give the highest activity for perovskites applied as enzyme mimics, known as nanozymes.7 However, we believe that this analysis holds true for perfectly cubic systems. This is because the degenerate set of orbitals (dz2 and dx2−y2) in the eg level rarely have the same energy. In reality, transition metals’ orbital arrangements in a BO6 coordination are severely affected by distortions resulting in splitting of the eg level into two sub-orbitals.8 It is this phenomenon that prompted us to investigate the effect in catalysis of the exact sub-orbital occupancy in highest occupied orbital set of the transition metal of the ABO3 perovskites.
Crystal field theory is used as a good model to conceptualize the orientation of d-orbitals in a transition metal and the basis behind the observed energy differences. Previous studies have demonstrated that the activity of perovskites is governed by their eg orbital occupancy.6,7 This is demonstrated through metal–oxygen bonds which facilitate the alteration of the eg orbital electron distribution to control the catalytic activity. Thus, by looking in-depth into the eg orbital with its dz2 and dx2−y2 orbitals, further split such that the dz2 becomes higher or lower in energy than dx2−y2 orbital depending on distortion of a certain perovskite is inevitable.9
Perovskites have found many applications in catalysis. Their applications include photocatalysis, electrocatalysis, to mention a few.10 One notable drive for their use in catalysis is the formation of oxygen vacancies in structural arrangements of various inorganic perovskites of the ABO3 form. Oxygen mobility in perovskites plays an intrinsic role in catalytic processes. It has been noted that substitution of metal cations with those of lower valences at either A or B sites can induce the formation of oxygen vacancies.11,12 This facilitate oxygen transfer and increase the oxygen mobility, thus enhancing various catalytic transformations. Ngamou et al. studied the effect of oxygen transportation on trivalent cobalt cations and surface reactivity.13 From their study, the oxygen was found to be the driving force of reactivity on the surface of the investigated materials. This may lead to oxygen species being adsorbed and desorbed during the catalytic process. Royer et al. used XPS analysis to demonstrate that transition metal sites can be viewed as weakly-bounded if the oxygen species are considered as O− and O2−. Moreover, perovskites with an eg orbital filling and a number of oxygen vacancies can be used as oxygen evolution reduction (OER) catalysts.3,14
There are a number of synthetic methods which can be used to synthesize perovskites including micro-emulsion,15 soft template,16 freeze-drying,12 nanocasting (hard template),17 and hydrothermal synthesis.18 Perovskites synthesized by sol–gel method provide materials that are crystalline and with high purity when compared to other methods. This method is also considered a simple and time saving technique. Its drawbacks are associated with higher calcination temperature requirement which leads to low surface area and highly agglomerated particles.19,20 Despite the drawbacks, the sol–gel method works quite well if the electronic structure is to be used as a leading descriptor for catalytic activity rather than only putting more emphasis on surface area. Surface areas of many metal oxides have been used to define trends for reduction and oxidation of model reactions such as 4-nitrophenol21 and morin,22 respectively. However, for reactions such as hydrogenation of cinnamaldehyde, we reported that the surface area is not the main descriptor for catalytic activity of inorganic perovskites.23 Herein, we opted to use a model reaction, oxidation of morin, to study the electronic effects as descriptors for activity due to ease of execution of this reaction and formation of one product at the initial stages of the reaction.
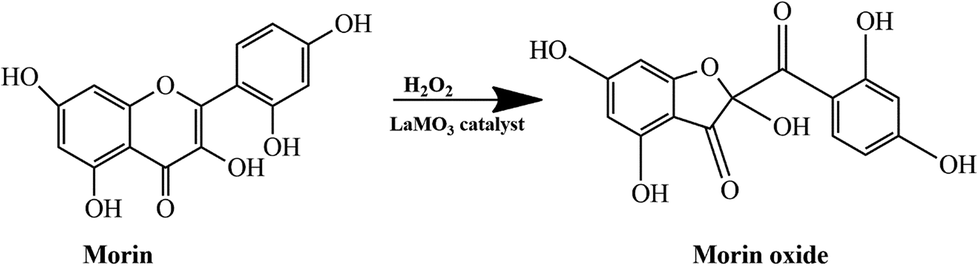
Morin, a flavonoid is a phenolic compound present in vegetables and other plants. It is used as herbal medicine and exhibits various biological activities such as antioxidant,24 cytoprotection,24 anti-inflammatory,25 antidiabetic26 and anticancer properties.27 Oxidation of morin can be easily monitored using spectroscopic techniques. Moreover, this reaction is a model reaction forming one product, thus making it easy to study surface kinetics.28 Oxidation of morin to morin oxide by hydrogen peroxide is given in Scheme 1. Hydrogen peroxide is the widely utilized oxidizing agent in oxidation reactions involving model reactions.28,29 The ABO3 perovskites has been reported to catalyse oxidation reactions due to their unique properties such as flexibility of crystal structure and tuneable electronic properties.30 These include use as supports for active metal species, substitution of either the A or B site of the ABO3 perovskites. The La-based inorganic perovskites are inexpensive and readily available. Catalysed morin oxidation over ABO3 is a surface reaction and at the surface of the catalyst the metal–oxygen (B–O) bond serves as a point of alteration of the electronic structure which control the surface binding energetics.10 Theoretically, the nature of ABO3 perovskites can be explained by making use of density functional theory (DFT) calculations and this would lead to further exploration of the electronic structural properties.31
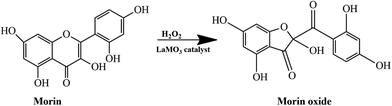 |
| | Scheme 1 Oxidation of morin to morin oxide by H2O2 over LaMO3 (M = Co, Cr, Fe, Ni, Mn, Cu, Zn) perovskites. | |
In this work, we present a kinetic analysis of morin oxidation in the presence of perovskites containing transition metal cations. We aim at developing an understanding of the effect of electron-density distribution on a transition metal in the BO6 coordination environment of the ABO3 perovskite on reaction kinetics using density functional theory (DFT) calculations. This is an effort to investigate the relationship between electronic properties of perovskites and the catalytic activity.
2. Experimental
2.1 Reagents used
Lanthanum(III) nitrate hexahydrate [La(NO3)3·6H2O (99.99%)], cobalt(II) nitrate hexahydrate [Co(NO3)2·6H2O (99%)], iron(III) nitrate nonahydrate [Fe(NO3)3·9H2O (98%)], manganese(II) nitrate tetrahydrate [MnN2O6·4H2O (98%)], morin hydrate (99.9%), aqueous hydrogen peroxide (50%), ethylene glycol (99.9%) were purchased from Sigma-Aldrich. Citric acid monohydrate (C6H8O7·H2O) (99.5%), chromium(III) nitrate nonahydrate [Cr(NO3)3·9H2O] (98%) and nickel(II) nitrate hexahydrate [Ni(NO3)2·6H2O] (99%) were purchased from SAARCHEM (PTY) Ltd. Sodium hydrogen carbonate (NaHCO3) (99.86%), anhydrous sodium carbonate (Na2CO3) (99.5%) were purchased from Associated Chemical Enterprise (PTY) Ltd. All chemicals were of analytical grade and used as received. All experiments were performed using deionized water from an in-house Milli-Q system (18 MΩ cm).
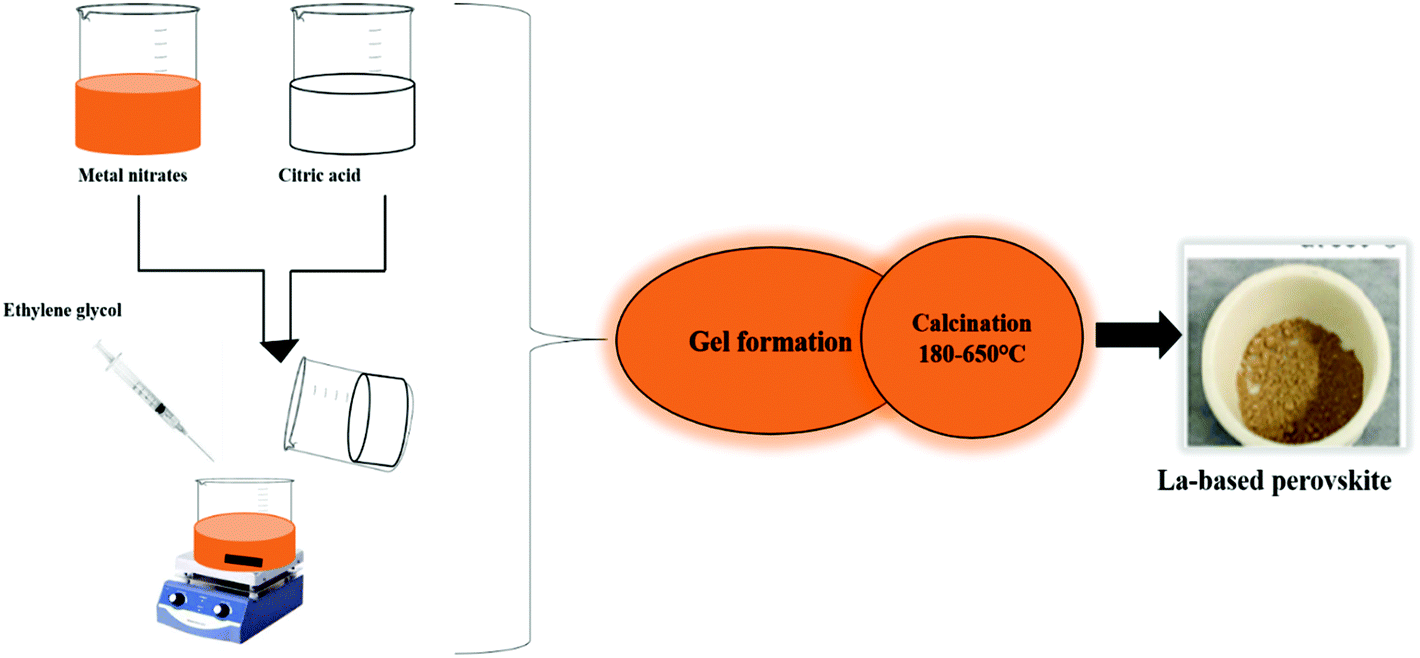
2.2 Synthesis of LaMO3 (M = Co, Fe, Ni, Cr, Mn, Cu, Zn) perovskites
LaMO3 perovskites were synthesized as per Xiaoyu Wang and co-workers.7 In 100 mL deionised water, 12 mmol of the metal nitrates were used as precursors and 6 mmol citric acid was used as a chelating agent. This was followed by the addition of 1.5 mL ethylene glycol to the solution. The resultant solution was heated to about 120 °C under continuous stirring to condense the solution into a gel. The obtained gel was calcined at different temperatures from 180 to 650 °C to obtain the final lanthanum-based perovskite type oxides (Scheme 2).
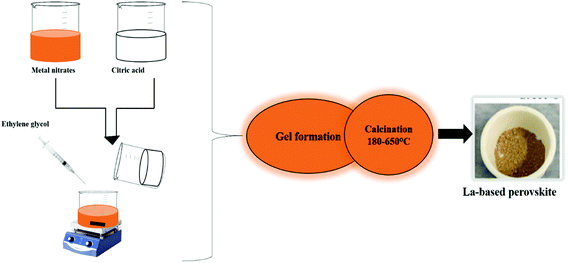 |
| | Scheme 2 Schematic diagram illustrating sol–gel synthesis of La-based perovskites. | |
2.3 Catalyst characterization
The surface areas of the synthesized perovskites were measured by the BET technique. About 0.25 g of all prepared catalytic samples were initially degassed at 90 °C for 12 hours under nitrogen gas, then cooled to room temperature and analysed using Micrometrics ASAP 2460 surface and porosity analyzer to remove adsorbed species.
For power-XRD analysis, all samples were pulverized to fine powder and analysed by Philips X'Pert Pro purchased from PANalytical using the def_sa5 m method. The samples were analysed using Cu Kα1 radiation at λ = 1.54060 nm with working conditions of 40 mA and 40 kV. The measurements were carried out in the wide-angle diffraction range (10 to 90°). Furthermore, the High Score Performance (HPF) software was used to match the crystalline phase of the prepared materials and the lattice parameters were also calculated.
To determine the reducibility of the as-synthesized perovskites, the hydrogen temperature-programmed reduction (H2-TPR) was used. About 0.04 g of each sample was analysed using Micrometrics model Autochem II 2920 chemisorption analyser. The catalytic samples were temperature ramped from 25 to 700 °C at ramping rate of 10 °C min−1. A mixture of hydrogen and argon gases with a ratio of 1![[thin space (1/6-em)]](https://www.rsc.org/images/entities/char_2009.gif) :9 was used as the analysis gas.
:9 was used as the analysis gas.
For thermal stability, all samples were analysed using thermogravimetric analysis (TGA) on a PerkinElmer STA 600 model. The samples were temperature ramped from 25 to 1000 °C at ramping rate of 10 °C min−1 in air flow.
The morphological studies of the prepared materials were also undertaken. The samples were first dispersed in ethanol and sonicated for 30 minutes then placed on carbon-coated Cu-grids and analysed using high resolution Joel-Jem 2100F transmission electron microscope (HRTEM) operating at a voltage of 200 kV. Samples were carbon-coated using carbon sputter from an Agar Turbo Carbon Coater and analysed using TESCAN scanning electron microscope (SEM) with Vega TC software. The software was operated at 20 kV with working distance (WD) of 15 mm. The elemental mapping was done using energy dispersive spectroscopy (SEM-EDS) to confirm expected components of the perovskites.
X-ray photoemission spectroscopy (XPS) spectra were measured at room temperature using a SPECS PHOIBOS 150 hemispherical electron energy analyser and a SPECS XR 50 M monochromatised X-ray source (Al Kα anode, hν = 1486.71 eV). The base pressure of the analysis chamber was <3 × 10⁻¹⁰ mbar during measurements. In order to compensate for the charging of the sample surface, a low-energy electron flood gun was used and operated as per the following settings: electron energy = 2 eV, electron flux = 20 μA. The overall energy resolution of the XPS spectra was set to 0.8 eV for the survey scans, and to 0.55 eV for all the other spectra shown in this work. All XPS spectra reported in this work have been normalised either to the background or to the height of the most intense peak for better visual comparison of the spectra.
2.4 Catalytic evaluation: oxidation of morin
The oxidation of morin was evaluated using the as-synthesised perovskites as catalysts. A stock solution of morin was prepared using 0.1 M carbonate buffer solution. All catalytic runs were performed in a 24 well-plate. Approximately 0.03 g of perovskites were dispersed in 10 mL of de-ionised water and mixed with (200 μM) morin, hydrogen peroxide (100 μM) and catalytic reactions were carried out in a batch mode of duplicates using BioTek PowerWave XS2 Plate Reader at λ = 410 nm to obtain the kinetics data.
2.5 Density functional theory calculations
Starting unit cells of the perovskite crystal structures were downloaded from the Material project database. The 2 × 2 × 2 supercells of each ABO3 perovskites were built from these unit cells. Supercell structures were optimized using the CASTEP module in Materials Studio with 3 × 3 × 3 Monkhorst–Pack k-points. Perdew–Burke–Ernzerhof (PBE).32 DFT functional was used for all geometry optimization using a planewave basis set with an energy cut-off of 571.40 eV. In addition, the Hubbard U correction, where U is defined as Ueff, was applied for B metals of perovskites to treat the strong on-site Coulomb interaction of their localized d-electrons.33 The space group symmetry of each crystal structure was used to constrain their symmetries during optimization. The resulting crystal structures generated from this method are shown in Fig. 7a and S9.†
2.6 Adsorption energy calculations
The adsorption energy locator and Forcite modules of Materials Studio (Version 8.0, Accelrys Ltd, San Diego) was used to investigate the various adsorption configurations of the adsorbate on the surface of ABO3 perovskite. The adsorption locator module is designed to use the Monte Carlo (MC) method of statistical mechanics to search for binding sites of organic molecules on the surfaces of metals, their oxides or nanoparticles.34 It has been used successfully to identify low energy adsorption sites of adsorbates loaded on either periodic or non-periodic substrates. It can also analyse the preferential adsorption sites of mixtures of adsorbate elements. Furthermore, the adsorption energy was calculated using Forcite module, an advanced implementation of the Molecular Mechanics (MM) method. Forcite gives quick energy calculations and reliable optimized geometry of molecules as well as systems. The geometry optimization and energy calculation in Forcite was carried out with the universal force field, current changes and an atom-based summation method. It essential to note that the same energy and minimization settings were maintained in the two modules-Adsorption locator and Forcite in all the configuration search as well as adsorption energy calculations.
3. Results and discussion
3.1 Characterization
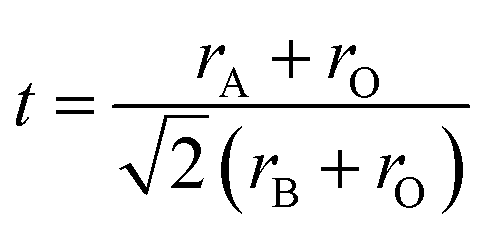
The geometrical arrangement of the lattice structure of the ABO3 perovskites is one factor that needs careful consideration when defining the electronic effects in catalysis. Expected distortions of the ABO3 systems with various combinations of metal cations are predicted by means of the Goldschmidt's tolerance factor. For values of tolerance factor outside the range of 0.75 to 1, the structures are unstable and lack cohesion. The Goldschmidt's tolerance factor is given by eqn (1):| |  | (1) |
where rA, rB and rO are the atomic radii of A and B site cations and of O (oxygen), respectively. The calculated tolerance factors, shown in Table S1 in ESI† are all between 0.75 to 1, predicting stable perovskites.35
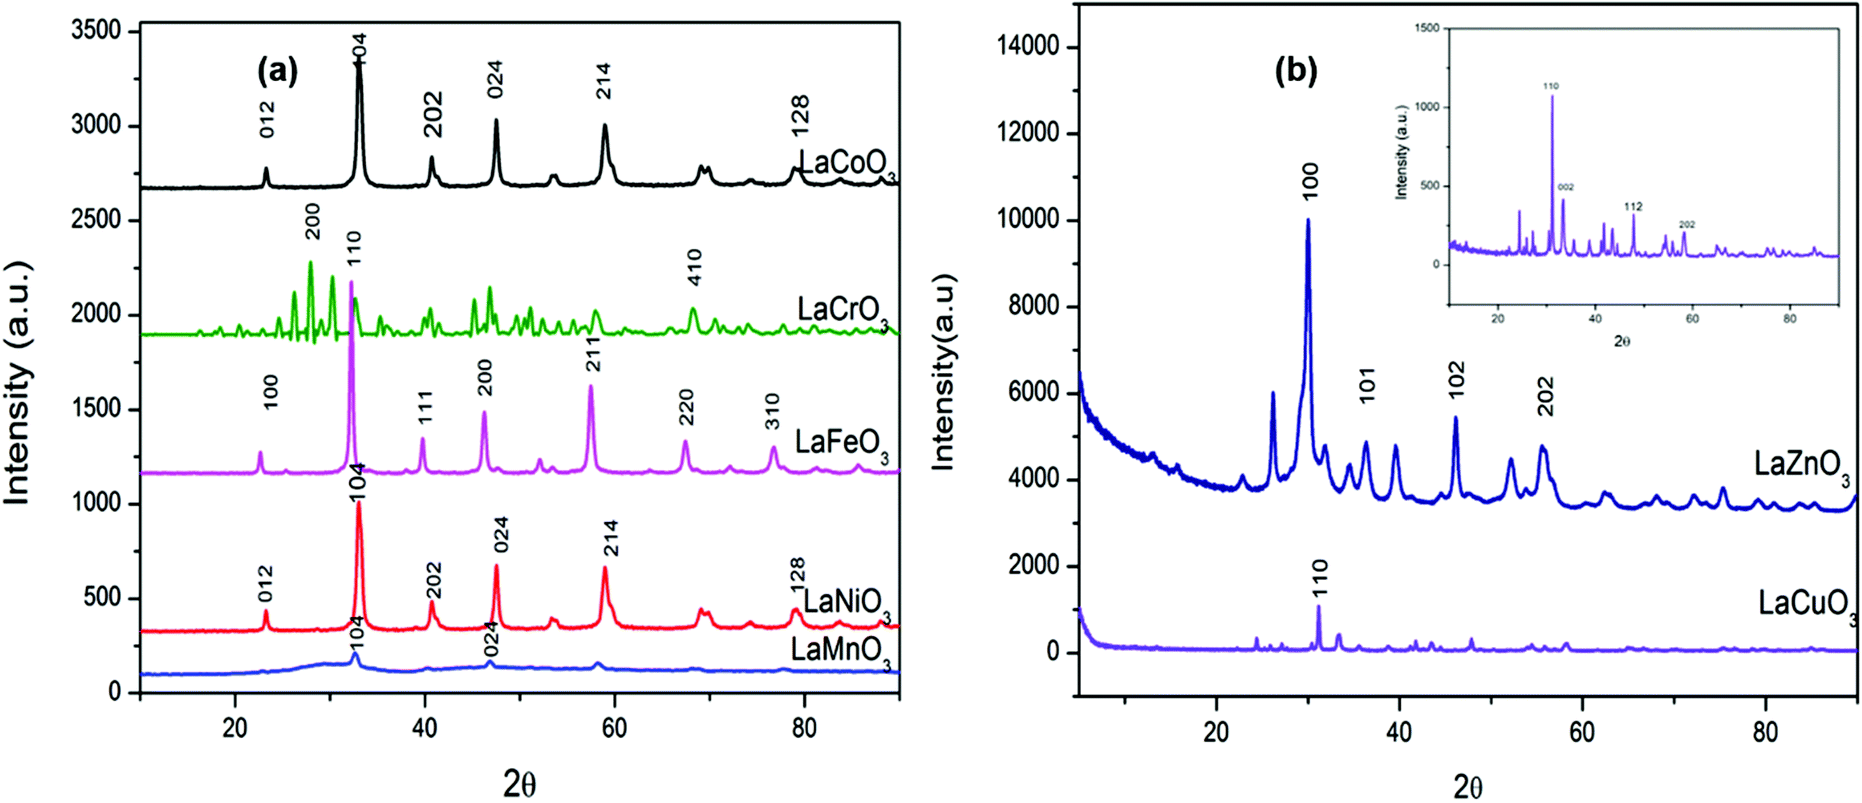
The X-ray diffraction patterns of synthesized materials are shown in Fig. 1(a and b). The LaMO3 perovskites are defined by a well resolved sharp and intense single peak found at 32.5°. Furthermore, the as-synthesized materials were indexed and found to match perovskites with ABO3 structures using High Score Plus (HPF) software. Structurally, the rhombohedral LaCoO3 (JCPDS 04-007-8070), LaMnO3 (JCPDS 04-014-5546) and LaNiO3 (JCPDS 04-007-9503) had R![[3 with combining macron]](https://www.rsc.org/images/entities/char_0033_0304.gif) c space groups while the LaFeO3 (JCPDS 04-006-4328) was found to be cubic with Pmm space group. Furthermore, the LaCrO3 (JCPDS 01-080-3126) was found to be orthorhombic with Pnma space group. Lastly, LaCuO3 (JCPDS 01-085-7520) was found to be monoclinic and LaZnO3 (JCPDS 04-020-9313) (also see Table 1).
c space groups while the LaFeO3 (JCPDS 04-006-4328) was found to be cubic with Pmm space group. Furthermore, the LaCrO3 (JCPDS 01-080-3126) was found to be orthorhombic with Pnma space group. Lastly, LaCuO3 (JCPDS 01-085-7520) was found to be monoclinic and LaZnO3 (JCPDS 04-020-9313) (also see Table 1).
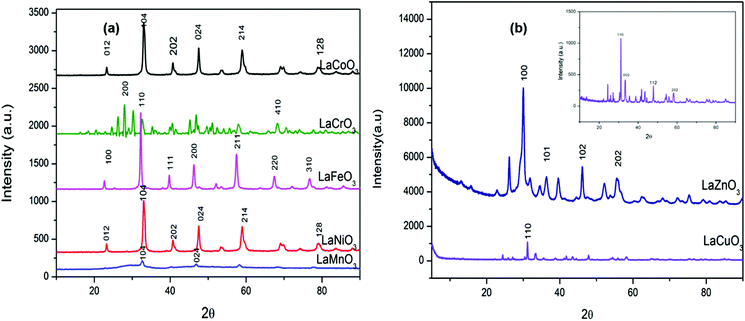 |
| | Fig. 1 Wide angle powder X-ray diffraction patterns for (a, b) LaMO3 (M = Co, Cr, Fe, Ni, Mn, Cu, Zn) perovskites. | |
Table 1 Crystallographic parameters for La-based perovskites
| Entry |
Perovskite |
Space group |
Crystal system |
| 1. |
LaCrO3 |
Pnma
|
Orthorhombic |
| 2. |
LaMnO3 |
Rc |
Rhombohedral |
| 3. |
LaFeO3 |
Pmm |
Cubic |
| 4. |
LaCoO3 |
Rc |
Rhombohedral |
| 5. |
LaNiO3 |
Rc |
Rhombohedral |
| 6. |
LaCuO3 |
C2/c |
Monoclinic |
| 7. |
LaZnO3 |
P63mc |
Hexagonal |
To complement the p-xrd results, the X-ray photoelectron spectroscopy suggests the ABO3 systems. The La 3d electrons suggest the La3+ state and the oxygen 1s points the existence of the normal O2− states. In all the synthesized perovskites, the characteristic La 3d3/2 appear in the binding energy region between 845 and 860 eV. While the La 3d5/2 electron appear between 827 and 841 eV. The as-synthesized perovskites are characterized by the presence of oxygen vacancies with LaZnO3 being an exception. The appearance of a peak in the O 1s spectrum in the binding energy region between 530 and 533 eV is an indication of abundant oxygen vacancies, while there appears the stoichiometric O2− lower binding energies (527–530 eV) of the O 1s spectrum. Fig. 2 shows the xps spectra of La 3d and O 1s.
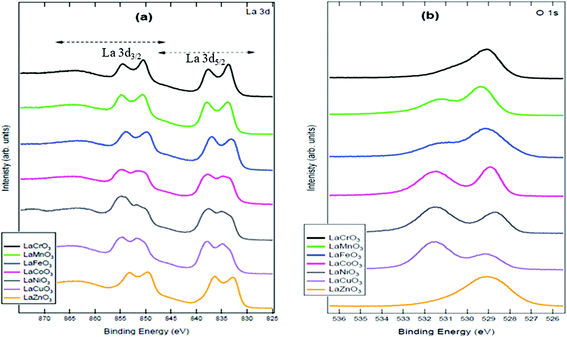 |
| | Fig. 2 The La 3d and O 1s X-ray photoelectron spectra showing the atomic states of the components of perovskites. | |
The determination of redox properties of the inorganic perovskites was performed to ascertain the structural stability in different conditions. In reducing conditions, H2-TPR analysis, the perovskites show two deoxygenation steps forming a water molecule. These reduction steps are associated with the reduction from 3+ to 2+ and subsequent reduction to zerovalent metal.9,35 Reduction takes place exclusively on the B-site of the ABO3 perovskite. The steps involved are given in eqn (2(a)) and (2(b)). Fig. 3(a and b) shows the reduction profiles of the LaCoO3 and LaMnO3 perovskites. The TPR profiles for other synthesized perovskites are shown in Fig. S1† and TGA profile are shown in Fig. S2 in ESI.†
| | | LaM3+O3 + 0.5H2 → LaM2+O2.5 + 0.5H2O2(a) | (2a) |
| | | LaM2+O2.5 + H2 → LaMO1.5 + H2O2(b) | (2b) |
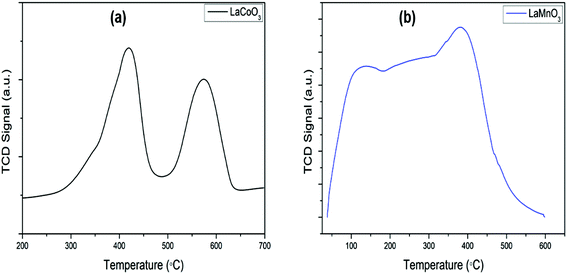 |
| | Fig. 3 TPR profiles for LaCoO3 and LaMnO3 perovskites. | |
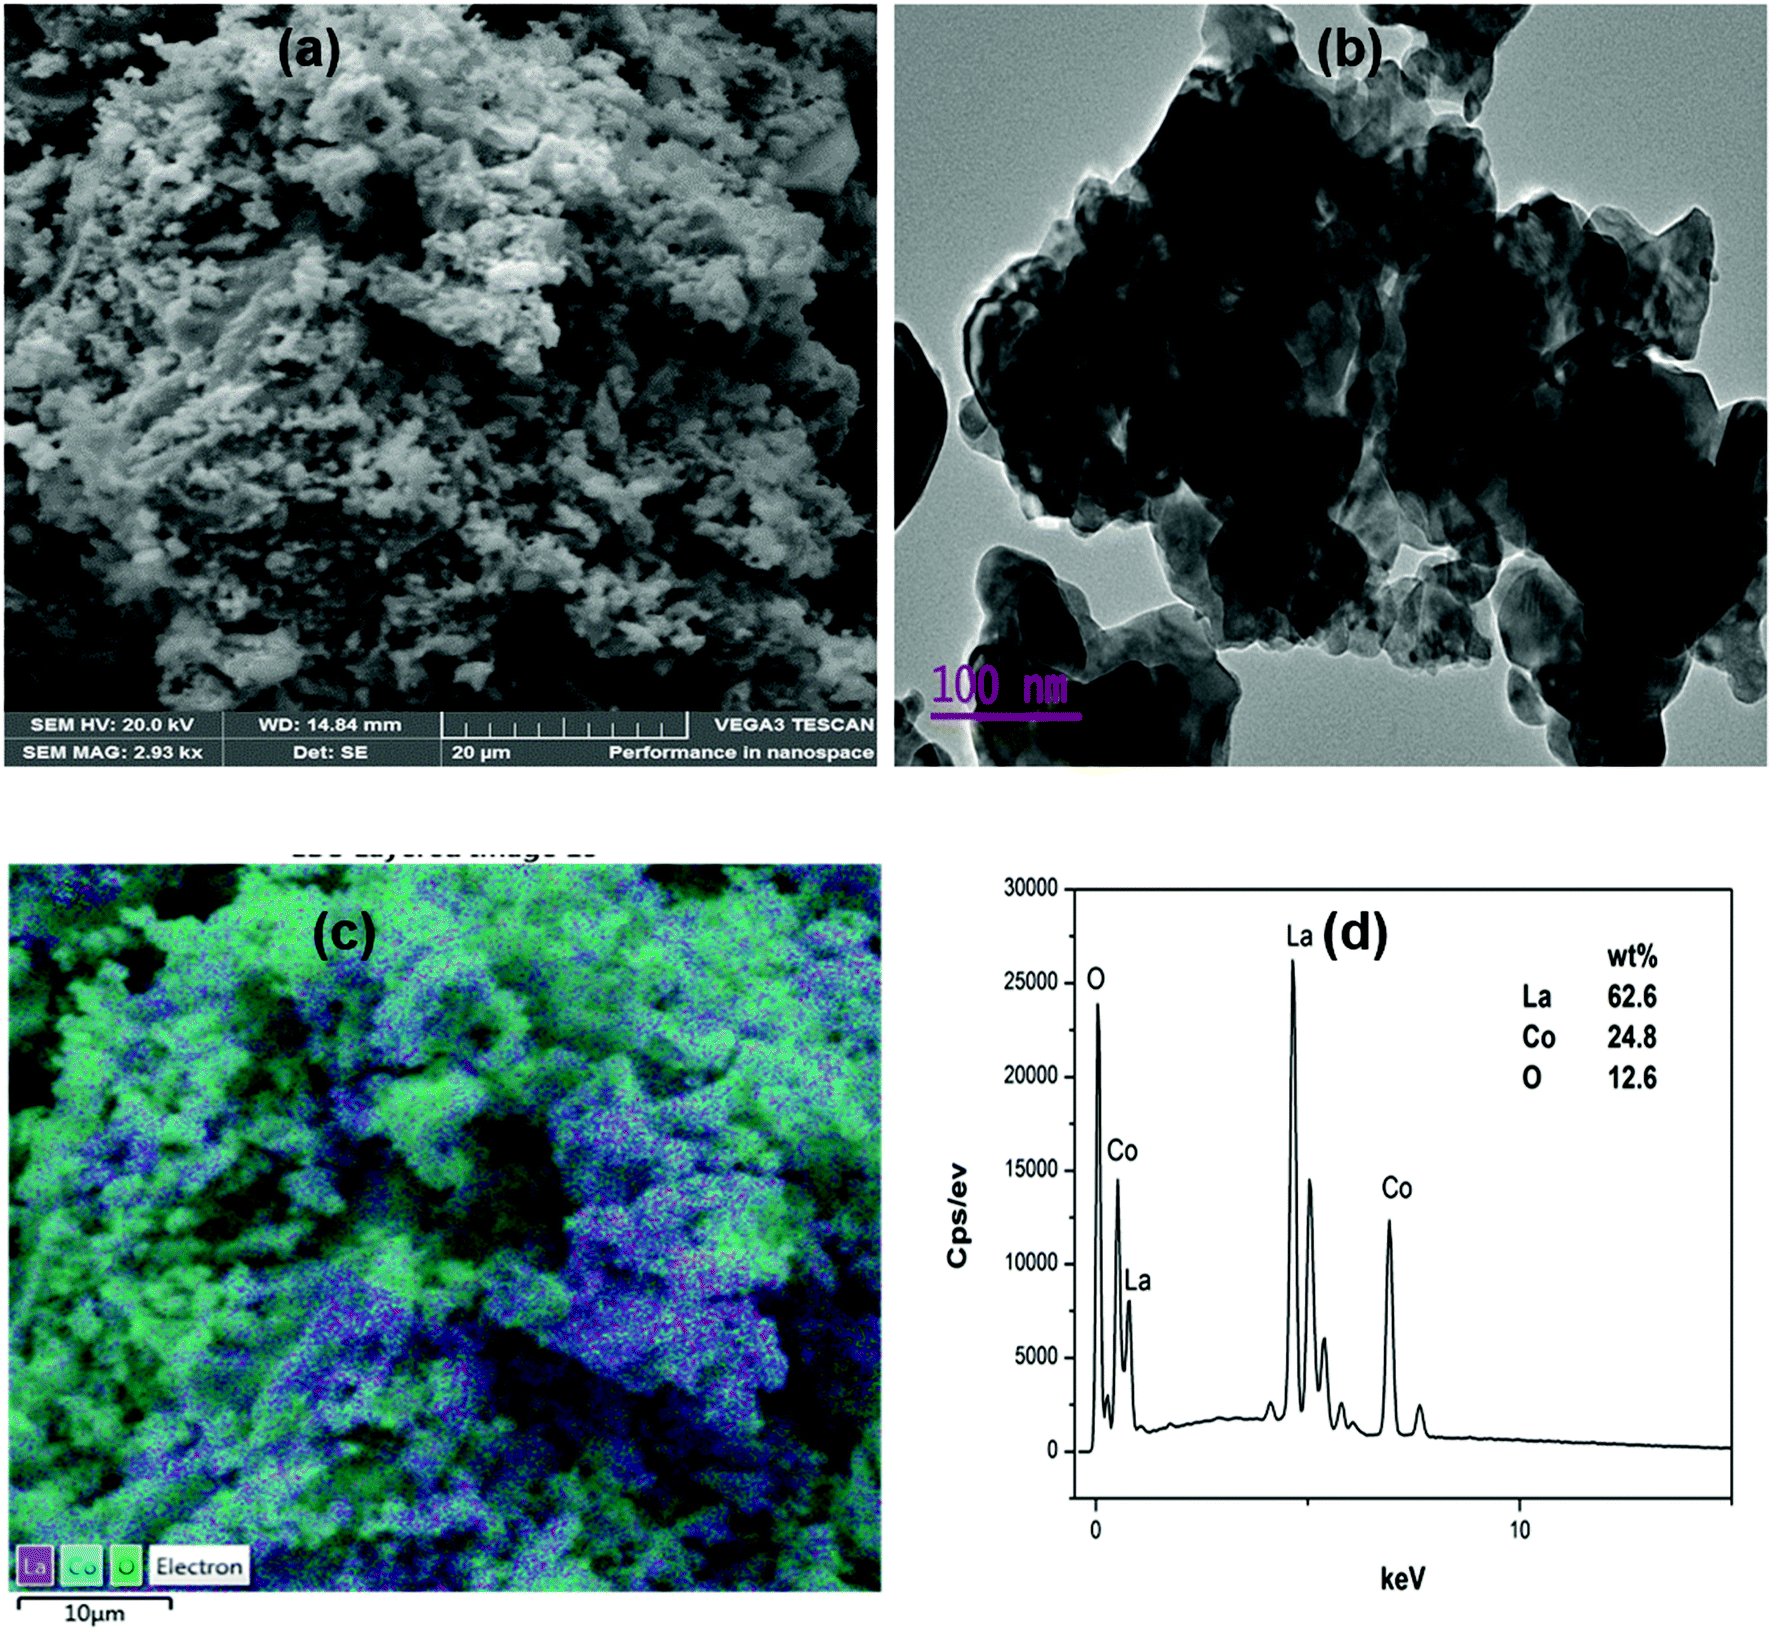
The scanning- and transmission-electron microscopes images of LaCoO3 perovskite are shown in Fig. 4(a and b), respectively. SEM analysis showed a rough surface suitable for catalysis and porosity was observed. While TEM showed clusters of porous materials. The EDS in Fig. 4(d) confirmed the elements present in LaCoO3 material with their corresponding elemental percentage compositions. SEM and TEM images for other perovskites are shown in ESI (Fig. S3–S5†).
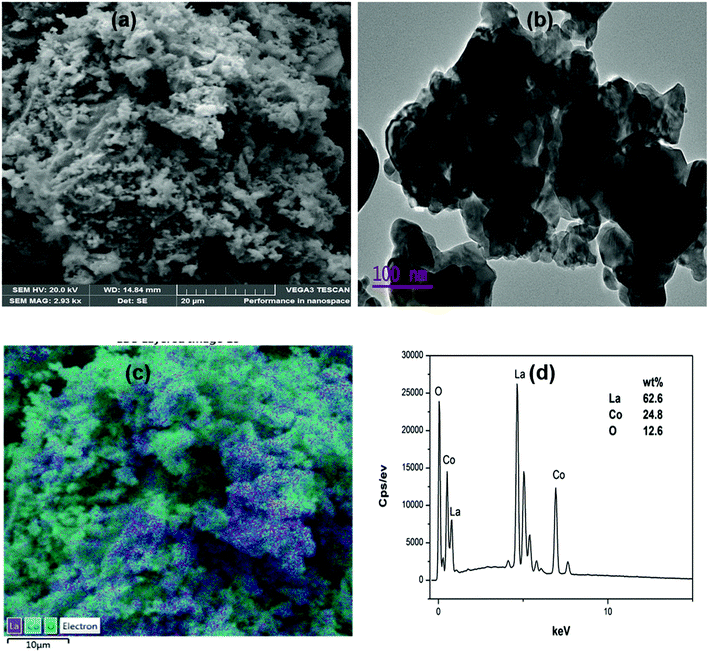 |
| | Fig. 4 (a) SEM image for LaCoO3, (b) TEM image for LaCoO3, (c) elemental mapping for LaCoO3 and (d) EDS spectrum for LaCoO3. | |
The BET results showed relatively low surface areas. This may be due to high calcination temperatures required when preparing these materials using sol–gel method. Obtained BET surface areas of the transition metal containing perovskites were found to be less than 10 m2 g−1, except for LaMnO3, 28 m2 g−1, see Table 2. Fig. 5 shows type IV hysteresis loops indicative of mesoporous nature of the materials and also the cumulative plots for pore size distribution are shown in Fig. 5. It is important to note that higher surface areas are desired for materials that are to be applied in catalysis because surface area has a pronounced effect on observed rates of surface reactions. However, we recently reported that surface area cannot always be used as the only determining factor of catalyst activity.23 There are other factors that influence catalytic activity. Recent studies have reported electronic parameters (eg orbital occupancy) of inorganic perovskites as the descriptor for catalytic activity in catalytic reactions.7,14 The low surface areas obtained herein will not be used as sole descriptor for catalytic activity, but electronic indicators will form the basis of activity studies.
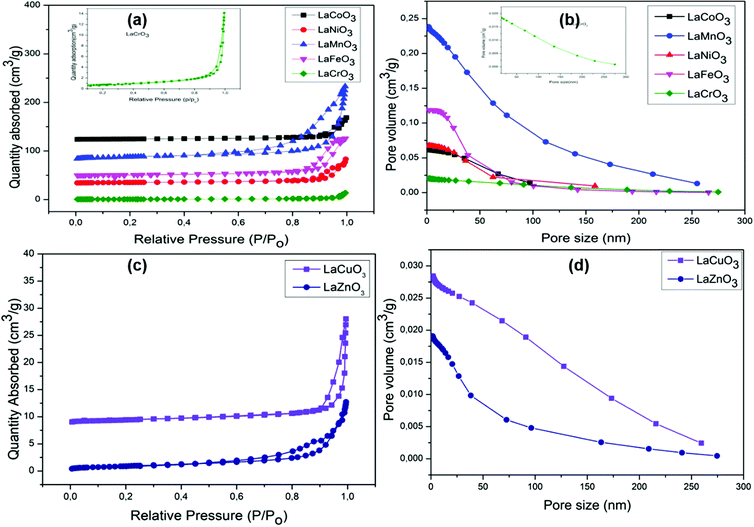 |
| | Fig. 5 Plots of (a) nitrogen adsorption–desorption isotherm curves (b) pore volume versus pore size for LaMO3 (M = Co, Ni, Mn, Fe, Cr) (c) nitrogen-desorption isotherm curves and (d) pore volume versus pore size for LaMO3 (M = Cu, Zn,). | |
Table 2 Summarized BET results for as-synthesized La-based perovskites and comparison with literature
| Entry |
Catalyst |
S
BET (m2 g−1) |
Pore volume (cm3 g−1) |
Pore size (nm) |
Ref. |
| 1. |
LaCrO3 |
2.7 |
0.0205 |
29.884 |
This work |
| 2. |
LaMnO3 |
28.5 |
0.2383 |
29.395 |
| 3. |
LaFeO3 |
8.4 |
0.1186 |
30.968 |
| 4. |
LaCoO3 |
5.8 |
0.0632 |
34.986 |
| 5. |
LaNiO3 |
7.8 |
0.0677 |
31.826 |
| 6. |
LaCuO3 |
2.9 |
0.0284 |
35.817 |
| 7. |
LaZnO3 |
3.4 |
0.0191 |
20.132 |
| |
| 8. |
LaCoO3 |
12.063 |
0.0514 |
17.047 |
36
|
| 9. |
LaCeCoO3 |
2.18 |
— |
— |
2
|
| 10. |
LaCeMnO3 |
20.32 |
— |
— |
2
|
| 11. |
LaNiO3 |
12.10 |
0.038 |
12.632 |
36
|
3.2 Kinetics studies
Catalyst comparison.
Kinetic studies were carried out to determine the suitable catalyst which was then used in all other investigations such as concentration variation studies of morin and hydrogen peroxide (see ESI for detailed methods, Fig. S6†). The best catalyst was chosen based on higher catalytic activity obtained using eqn (3) and (4).| |  | (3) |
| |  | (4) |
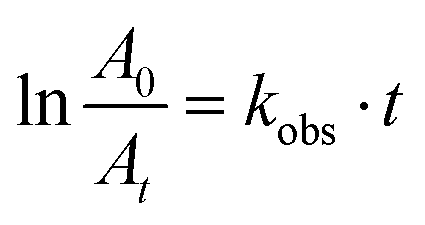
where A0 and At represents absorbance of morin at the beginning of the reaction and at time t, respectively, and kobs is the reaction rate constant.
From the results shown in Table 3 the best catalyst was found to be LaCrO3 2.6 × 10⁻² g s−1 m−2. Kinetic plots of all the catalysts are shown in Fig. 6(a) indicating decrease in absorbance over time. The reaction order as determined by the slope derived from eqn (4) was found to be of the pseudo first-order kinetics due to the linearity of the slope, Fig. 6(b). We have also observed through variations of both the substrate and oxidant concentration that the reaction is a surface reaction with competitive adsorption between the substrate and the oxidant. At higher concentrations of the substrate the catalyst active sites become saturated, starving the oxidant of adsorption sites leading to lower observed rate constants. While the increase in oxidant concentration increases the rate constant to a point of saturation at higher concentrations of the oxidant.
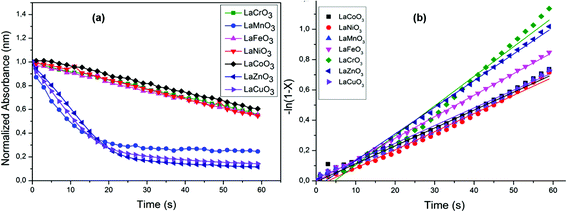 |
| | Fig. 6 Plots of (a) time versus normalized absorbance for determination of observed rates and (b) linearized plots for determination of reaction order. | |
Table 3 Kinetics studies showing the observed rates, kobs and the surface area normalized rates (Activity) for all the synthesized perovskites
| Entry |
Catalyst |
Surface area (m2 g−1) |
k
obs (s−1) |
Activitya (g s−1 m−2) |
Ref. |
|
Activity is defined as the BET surface area normalized observed rates: kobs/SA.
|
| 1. |
LaCrO3 |
2.693 |
7.16 × 10⁻² |
2.66 × 10⁻² |
This work |
| 2. |
LaMnO3 |
28.480 |
3.42 × 10⁻² |
1.20 × 10⁻³ |
| 3. |
LaFeO3 |
8.359 |
7.13 × 10⁻² |
8.53 × 10⁻³ |
| 4. |
LaCoO3 |
5.774 |
7.05 × 10⁻² |
1.22 × 10⁻² |
| 5. |
LaNiO3 |
7.803 |
5.89 × 10⁻² |
7.55 × 10⁻³ |
| 6. |
LaCuO3 |
2.922 |
6.75 × 10⁻² |
2.31 × 10⁻² |
| 7. |
LaZnO3 |
3.356 |
5.85 × 10⁻² |
1.74 × 10⁻² |
| |
| 8. |
MnO2 |
— |
9.0 × 10⁻² |
— |
22
|
| 9. |
Au147-DENs |
— |
5.9 × 10⁻⁶ |
— |
22
|
| 10. |
Co3O4 |
35.62 |
8.04 × 10⁻⁶ |
— |
37
|
| 11. |
Au147-DENs |
— |
6.5 × 10⁻⁴ |
— |
38
|
3.3 Computational studies
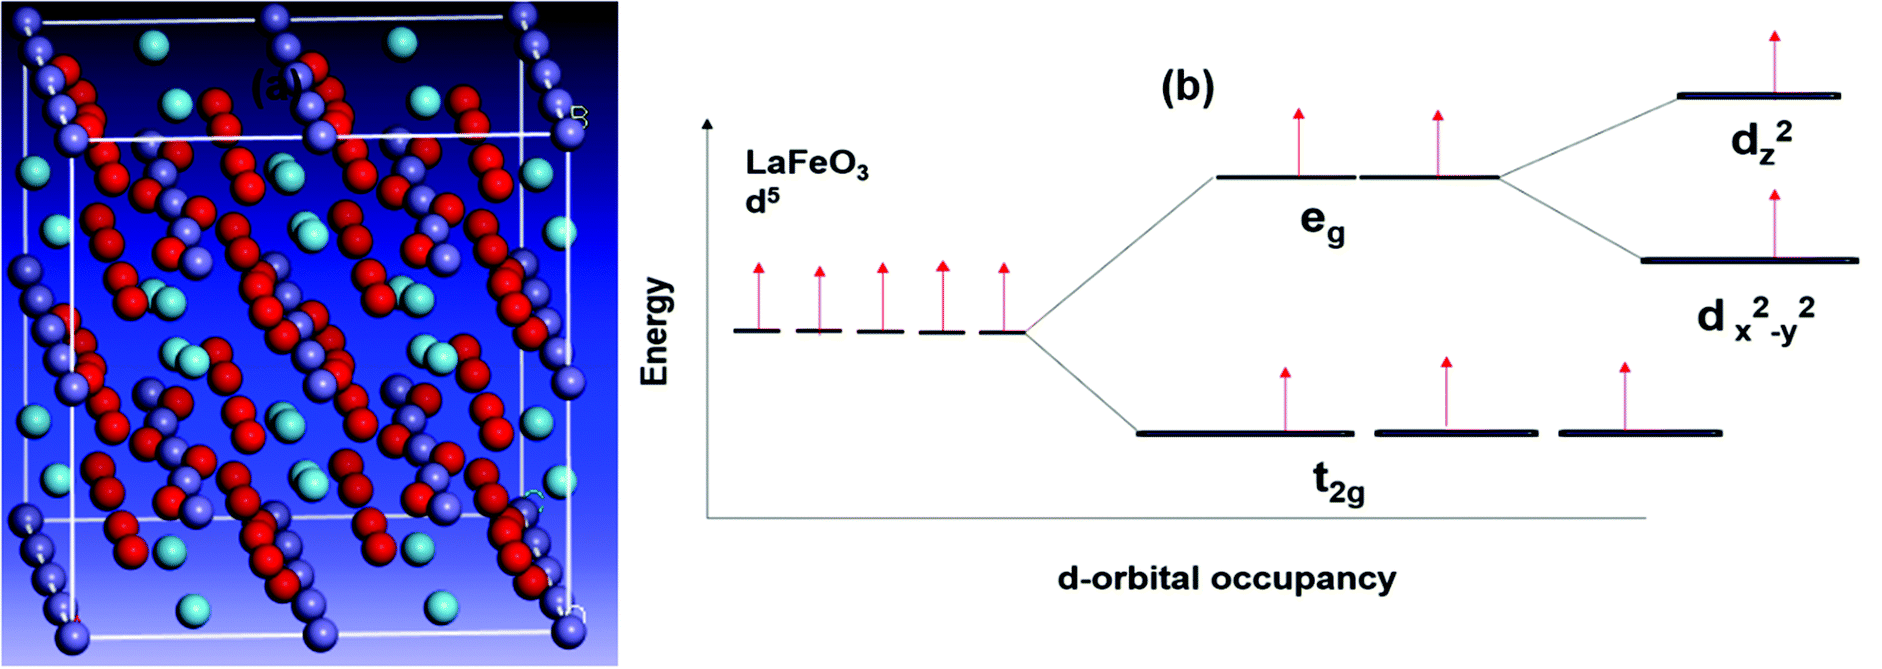
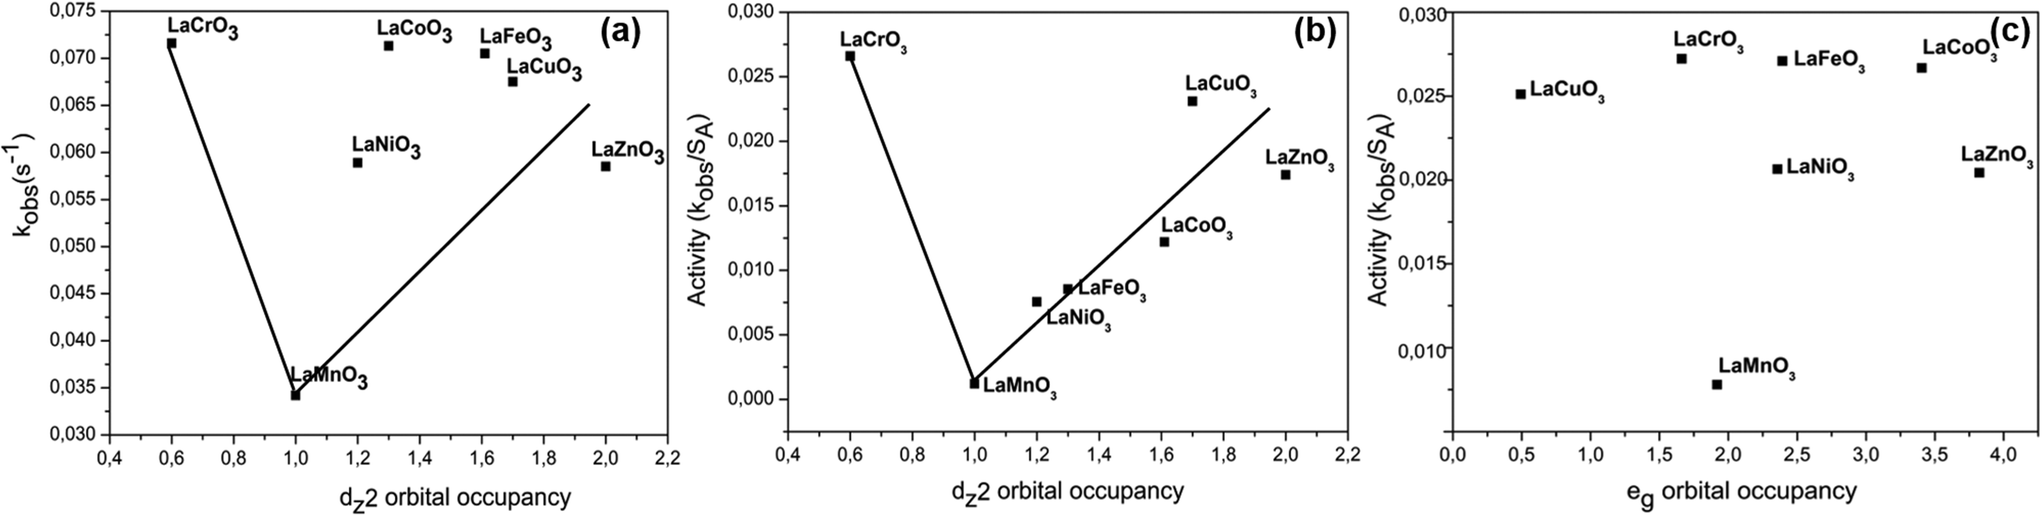
The conventional way of deriving catalytic trends from surface area values appears to fall short in this study. This is not the first time this phenomenon is reported. The use of computational methods provides a better platform for identifying other parameters that can be used to establish catalytic trends. Using DFT calculations, Table 4, there is no specific trend which clearly shows how the catalytic activity relates to the overall eg orbital electron population (see Fig. 8c). However, upon splitting of the two sub-orbitals of the eg level in a manner similar to Fig. 7(b), which is expected for lattice systems far from perfect cubic systems and due to Jahn–Teller affected cations in the B-site, we found that the dz2 orbital occupancy is the main descriptor of catalytic activity in morin oxidation. From Fig. 8(a and b) two regions of interest were found, (i) regions of higher catalytic activity, that is, low and high dz2 orbital filling and the (ii) region of lower catalytic activity with half-filled dz2 orbital. These results are in total contrast to the work of Wang et al. which reported a volcano plot with nickel containing perovskite as the best catalyst based on the half-filled eg level occupancy.7
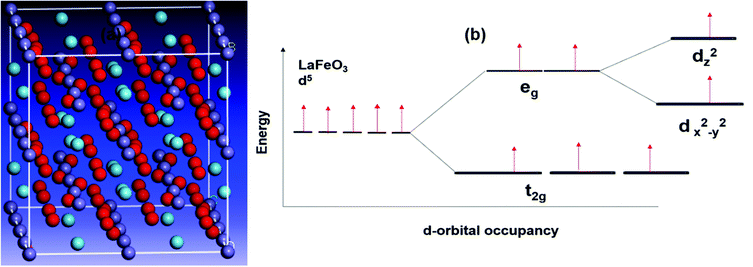 |
| | Fig. 7 (a) Optimized structure obtained from material studio and (b) orbital splitting diagram for LaFeO3 perovskite. | |
 |
| | Fig. 8 Plots of (a) reaction rate constant versus dz2 orbital occupancy, (b) catalytic activity versus dz2 orbital occupancy with surface area normalised observed rates and (c) catalytic activity versus eg orbital occupancy. | |
Table 4 DFT calculations showing electron distribution in the two orbitals of the eg level of the BO6 coordination environment
| Entry |
Catalyst |
Orbital |
Spin up electrons (↑) |
Spin down electrons (↓) |
Total sub-orbital occupancy |
Activity (g s−1 m−2) |
eg electron population |
| All electrons Zn are paired leading to no spin up and down populations. |
| 1 |
LaCrO3 |
dz2 |
0.389 |
0.208 |
0.597 |
2.66 × 10⁻² |
1.662 |
| dx2−y2 |
0.982 |
0.083 |
1.065 |
| 2 |
LaFeO3 |
dz2 |
0.988 |
0.273 |
1.271 |
8.53 × 10⁻³ |
2.393 |
| dx2−y2 |
1.001 |
0.121 |
1.122 |
| 3 |
LaMnO3 |
dz2 |
0.768 |
0.192 |
0.960 |
1.20 × 10⁻³ |
1.920 |
| dx2−y2 |
0.768 |
0.192 |
0.960 |
| 4 |
LaNiO3 |
dz2 |
0.792 |
0.387 |
1.179 |
7.55 × 10⁻³ |
2.358 |
| dx2−y2 |
0.792 |
0.37 |
1.179 |
| 5 |
LaCoO3 |
dz2 |
0.950 |
0.658 |
1.608 |
1.22 × 10⁻² |
3.405 |
| dx2−y2 |
0.981 |
0.817 |
1.798 |
| 6 |
LaCuO3 |
dz2 |
0.829 |
0.829 |
1.658 |
2.31 × 10⁻² |
3.316 |
| dx2−y2 |
0.829 |
0.829 |
1.658 |
| 7 |
LaZnO3 |
dz2 |
n/a |
n/a |
1.912 |
1.74 × 10⁻² |
3.824 |
| dx2−y2 |
n/a |
n/a |
1.912 |
Catalytic recyclability and reusability studies.
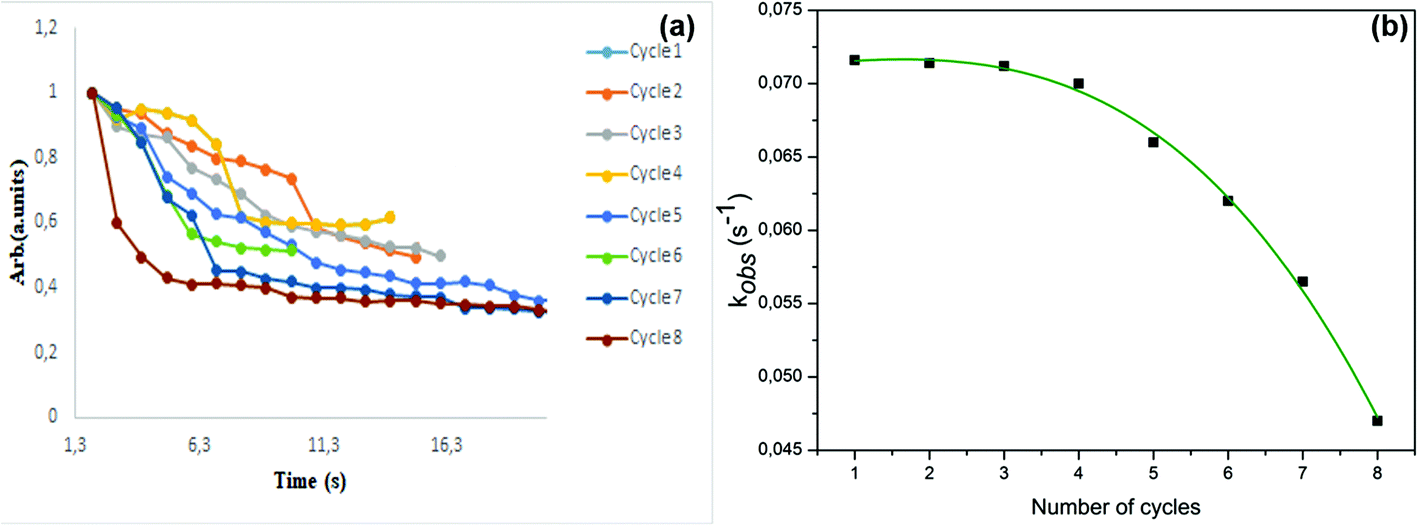
Catalytic recyclability studies have been reported as one of the most important aspect in heterogeneous catalysis. Kinetic studies, shown in Fig. 9a, become an integral part of the successful determination of potential catalyst deactivation. This is because the mere comparison of substrate conversion after each cycle does not give the necessary information about catalyst deactivation.39 Herein, we report comparable observed rate constants, kobs for the first three catalytic cycles indicating stability with minimal deactivation of the catalyst. From the fourth catalytic cycle, we observed catalytic deactivation as the observed rate constants decreased to a significant extent, Fig. 9b.
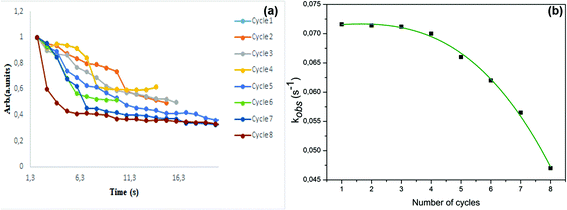 |
| | Fig. 9 (a) Absorbance versus time and (b) kobsversus number of cycles over LaCrO3 perovskite. | |
4. Discussions
It has been a norm to use catalytic descriptors for kinetic studies that later aid in development of effective catalysts. Herein, we proved that LaCrO3 with low surface area (2.69 m2 g−1) compared to LaNiO3 (7.8 m2 g−1) gives better observed rates. This is a clear indication that there are many factors at play and several catalytic descriptors need to be identified for design of better catalytic materials. Recently, a communication successfully defined the eg orbital occupancy as an important descriptor for the catalytic activity of lanthanum-based inorganic perovskites as enzyme mimics.7 This interesting study found LaNiO3 as the best catalyst based on the surface area normalized rates and the DFT calculated eg orbital occupancy. Interestingly, we found this catalyst the least active catalyst in the oxidation of morin. The electron distribution in the highest occupied orbital of the transition metal is a descriptor for catalytic activity. This analogue holds true for perfect cubic lattice systems. In an ideal cubic system, the two orbitals, dz2 and dx2−y2 of the eg level are degenerate, however, a new descriptor other than the entire eg level arises when the lattice systems deviate from perfect cubic systems to systems such as orthorhombic and others. The distorted cubic systems are a result of severe Jahn–Teller effect or distortions that result from octahedral tilting which influences the orbital ordering of perovskite structure with cubic symmetry leading to orthorhombic or rhombohedral. Thus, leading to the split of the eg level. This is a case for our materials, where our perovskites are not perfect cubic systems. For any distorted octahedral system, the splitting of orbitals in a certain energy level is expected. We observed that, unlike the reported communication, that further splitting of the eg level is possible since lattice systems that are not perfect cubic where obtained from the p-XRD analysis, except for LaFeO3. There was no relationship between the occupation of the entire eg level and catalytic activity of the perovskites in morin oxidation (Fig. 8c). Indications are that the dz2 orbital occupancy is the main descriptor for catalytic activity of the perovskites.
4.1 Adsorption studies
DFT calculations were used to predict the adsorption energies for morin oxidation at the surface of metal d-orbitals. The interaction between the adsorbate (morin) and metal d-orbitals plays a significant role. We consider that an adsorbate interacts with the catalyst surface of the metals in the same geometry, but the environment may vary due to straining of the surface (distortions or Jahn Teller distortions) where possible.40 The lowest adsorption energies were found on the compressed electronic structures such as LaCrO3 with orthorhombic space group with lowest dz2 orbital occupation. Furthermore, LaCrO3 showed higher catalytic activity at lowest dz2 orbital occupation (ESI Fig. S8†). While the highest adsorption energies were found on the electronic structures with highest dz2 orbital occupation. Higher adsorption energies may result in nearly chemisorbed species difficult to desorb from the surface. Table 5 shows the DFT calculated adsorption energies on different surfaces of the perovskites.
Table 5 Calculated adsorption energies of as-synthesized perovskites
| Entry |
Perovskite |
Adsorption energy (kcal mol−1) |
Rigid adsorption energy (kcal mol−1) |
Deformation energy (kcal mol−1) |
| 1. |
LaCrO3 |
−189.7338 |
−44.8144 |
−144.9194 |
| 2. |
LaFeO3 |
−188.5534 |
−47.6201 |
−140.9333 |
| 3. |
LaMnO3 |
−168.8007 |
−25.6994 |
−143.1013 |
| 4. |
LaNiO3 |
−173.8798 |
−29.1400 |
−144.7398 |
| 5. |
LaCuO3 |
−166.3725 |
−23.9227 |
−142.4498 |
| 6. |
LaZnO3 |
−169.3077 |
−25.9558 |
−143.3519 |
5. Conclusions
The use of electronic properties as activity descriptors is showing promise in design and application solid metal oxides such as perovskites in heterogeneous catalysts. The actual distribution of electrons around the active B-site metal in perovskites is earmarked as the basis of application of electron descriptors in perovskites catalysts. Herein, we successfully demonstrated that the eg orbital cannot be used entirely as the descriptor, but the sub energy levels are the main driving force of catalytic activity. In conclusion, inexpensive perovskites catalysts are good catalysts for degradation of morin and the design to obtain combinations for the best mixed metal oxide catalysts can be derived from the arrangement of electrons around the most active metal in the system.
Conflicts of interest
Authors declare no conflict of interest.
Acknowledgements
We thank the University of Johannesburg (UJ) for studying opportunity and National Research Foundation (Grants UID 117997, 90698, 93205, 119314) for financial support. We thank metacatalysis group and Prof. Meijboom for working in a well-equipped lab. The authors acknowledge the Centre for High Performance Computing (CHPC), South Africa for providing computational resources to this research project. We also acknowledge financial support by the Faculty of Science Research Council and the University Research Council of the University of Johannesburg.
References
- R. S. Roth, Classification of Perovskite and Other ABO3-Type Compounds, J. Res. Natl. Bur. Stand., 1957, 58(2), 75, DOI:10.6028/jres.058.010.
- N. Erdenee, U. Enkhnaran, S. Galsan and A. Pagvajav, Lanthanum-Based Perovskite-Type Oxides La1-XCexBO3 (B = Mn and Co) as Catalysts: Synthesis and Characterization, J. Nanomater., 2017, 1–8, DOI:10.1155/2017/9120586.
- S. Royer, D. Duprez, F. Can, X. Courtois, C. Batiot-Dupeyrat, S. Laassiri and H. Alamdari, Perovskites as Substitutes of Noble Metals for Heterogeneous Catalysis: Dream or Reality, Chem. Rev., 2014, 114(20), 10292–10368, DOI:10.1021/cr500032a.
- Y. Tokura and N. Nagaosa, Orbital Physics in Transition-Metal Oxides, Science, 2000, 288, 462–468 CrossRef CAS PubMed.
- E. F. Ioannidis, Automated Structure Generation for First-Principles Transition-Metal Catalysis, Massachusettes Institute of Technology, 2018, 1–186 Search PubMed.
- D. Pesquera, G. Herranz, A. Barla, E. Pellegrin, F. Bondino, E. Magnano, F. Sánchez and J. Fontcuberta, Surface Symmetry-Breaking and Strain Effects on Orbital Occupancy in Transition Metal Perovskite Epitaxial Films, Nat. Commun., 2012, 3, 1–7, DOI:10.1038/ncomms2189.
- X. Wang, X. J. Gao, L. Qin, C. Wang, L. Song, Y. N. Zhou, G. Zhu, W. Cao, S. Lin and L. Zhou,
et al., E G Occupancy As an Effective Descriptor for the Catalytic Activity of Perovskite Oxide-Based Peroxidase Mimics, Nat. Commun., 2019, 10(1), 1–8, DOI:10.1038/s41467-019-08657-5.
- G. O. Jones and P. A. Thomas, Investigation of the Structure and Phase Transitions in the Novel A-Site Substituted Distorted Perovskite Compound Na0.5Bi0.5TiO3, Acta Crystallogr., Sect. B: Struct. Sci., 2002, 58(2), 168–178, DOI:10.1107/S0108768101020845.
- R. R. Kondakindi, Effect of Glycine Concentration on the Properties of LaCoO 3 Perovskite Prepared by the Glycine-Nitrate Process, Indian J. Chem., Sect. A: Inorg., Bio-inorg., Phys., Theor. Anal. Chem., 2012, 51(7), 931–936 Search PubMed.
- J. Hwang, R. R. Rao, L. Giordano, Y. Katayama, Y. Yu and Y. Shao-Horn, Perovskites in Catalysis and Electrocatalysis, Science, 2017, 358(6364), 751–756, DOI:10.1126/science.aam7092.
- M. M. Natile, E. Ugel, C. Maccato and A. Glisenti, LaCoO3: Effect of Synthesis Conditions on Properties and Reactivity, Appl. Catal., B, 2007, 72(3–4), 351–362, DOI:10.1016/j.apcatb.2006.11.011.
- D. Berger, N. Van Landschoot, C. Ionica, F. Papa and V. Fruth, Synthesis of Pure and Doped Lanthanum Cobaltite by the Combustion Method, J. Optoelectron. Adv. Mater., 2003, 5(3), 719–724 CAS.
- P. H. T. Ngamou and N. Bahlawane, Influence of the Arrangement of the Octahedrally Coordinated Trivalent Cobalt Cations on the Electrical Charge Transport and Surface Reactivity, Chem. Mater., 2010, 22(14), 4158–4165, DOI:10.1021/cm1004642.
- J. Simböck, M. Ghiasi, S. Schönebaum, U. Simon, F. M. F. de Groot and R. Palkovits, Electronic Parameters in Cobalt-Based Perovskite-Type Oxides as Descriptors for Chemocatalytic Reactions, Nat. Commun., 2020, 11(1), 1–10, DOI:10.1038/s41467-020-14305-0.
- M. A. Malik, M. Y. Wani and M. A. Hashim, Microemulsion Method: A Novel Route to Synthesize Organic and Inorganic Nanomaterials. 1st Nano Update, Arabian J. Chem., 2012, 5(4), 397–417, DOI:10.1016/j.arabjc.2010.09.027.
-
K. Sveinbjörnsson, Preparation and Characterization of Lead Halide Perovskites Towards Sustainable, Cost-Effective and Upscalable Solar Cell Manufacture, 1628 Search PubMed.
- K.-L. Wang, R. Wang, Z.-K. Wang, M. Li, Y. Zhang, H. Ma, L.-S. Liao and Y. Yang, Tailored Phase Transformation of CsPbI 2 Br Films by Copper(II) Bromide for High-Performance All-Inorganic Perovskite Solar Cells, Nano Lett., 2019, 19(8), 5176–5184, DOI:10.1021/acs.nanolett.9b01553.
- J. C. Védrine, Heterogeneous Catalysis on Metal Oxides, Catalysts, 2017, 7(341), 1–25, DOI:10.3390/catal7110341.
- S. Sakka, Formation of Particles in Sol-Gel Process, KONA Powder Part. J., 1989, 7(7), 106–118, DOI:10.14356/kona.1989017.
- C. N. Chervin, B. J. Clapsaddle, H. W. Chiu, A. E. Gash, J. H. Satcher and S. M. Kauzlarich, A Non-Alkoxide Sol-Gel Method for the Preparation of Homogeneous Nanocrystalline Powders of La 0.85Sr 0.15MnO3, Chem. Mater., 2006, 18(7), 1928–1937, DOI:10.1021/cm052301j.
- N. Bingwa, R. Patala, J.-H. Noh, M. J. Ndolomingo, S. Tetyana, S. Bewana and R. Meijboom, Synergistic Effects of Gold–Palladium Nanoalloys and Reducible Supports on the Catalytic Reduction of 4-Nitrophenol, Langmuir, 2017, 33(28), 7086–7095 CrossRef CAS PubMed.
- N. Bingwa, S. Bewana, M. Haumann and R. Meijboom, Revisiting Kinetics of Morin Oxidation: Surface Kinetics Analysis, Appl. Surf. Sci., 2017, 426, 497–503, DOI:10.1016/j.apsusc.2017.07.184.
- S. Bewana, M. J. Ndolomingo, E. Carleschi, B. P. Doyle, R. Meijboom and N. Bingwa, Inorganic Perovskite-Induced Synergy on Highly Selective Pd-Catalyzed Hydrogenation of Cinnamaldehyde, ACS Appl. Mater. Interfaces, 2019, 11(36), 32994–33005, DOI:10.1021/acsami.9b10820.
- S. Subash and P. Subramanian, Effect of Morin on the Levels of Circulatory Liver Markers and Redox Status in Experimental Chronic Hyperammonaemic Rats, Singapore Med. J., 2008, 49(8), 650–655 CAS.
- S.-H. Fang, Y.-C. Hou, W.-C. Chang, S.-L. Hsiu, P.-D. L. Chao and B.-L. Chiang, Morin Sulfates/Glucuronides Exert Anti-Inflammatory Activity on Activated Macrophages and Decreased the Incidence of Septic Shock, Life Sci., 2003, 74(6), 743–756 CrossRef CAS PubMed.
- V. Sivaramakrishnan, P. N. M. Shilpa, V. R. P. Kumar and S. N. Devaraj, Attenuation of N-Nitrosodiethylamine-Induced Hepatocellular Carcinogenesis by a Novel Flavonol—Morin, Chem.-Biol. Interact., 2008, 171(1), 79–88 CrossRef CAS PubMed.
- S. Sarkar, A. Sengupta, A. Mukhrjee, A. Guru, A. Patil, A. D. Kandhare and S. L. Bodhankar, Antiulcer Potential of Morin in Acetic Acid-Induced Gastric Ulcer via Modulation of Endogenous Biomarkers in Laboratory Animals, Pharmacologia, 2015, 6(7), 273–281, DOI:10.5567/pharmacologia.2015.273.281.
- O. A. Alimi, C. A. Akinnawo, O. R. Onisuru and R. Meijboom, 3-D Printed Microreactor for Continuous Flow Oxidation of a Flavonoid, J. Flow Chem., 2020, 10(3), 517–531, DOI:10.1007/s41981-020-00089-3.
- B. I. Meena, D. Lakk-Bogáth, S. Keszei and J. Kaizer, Bleach Catalysis in Aqueous Medium by Iron(III)-Isoindoline Complexes and Hydrogen Peroxide, SRRN, 2021, 1–15 CAS
https://ssrn.com/abstract=3785629
.
- H. Chang, E. Bjørgum, O. Mihai, J. Yang, H. L. Lein, T. Grande, S. Raaen, Y.-A. Zhu, A. Holmen and D. Chen, Effects of Oxygen Mobility in La–Fe-Based Perovskites on the Catalytic Activity and Selectivity of Methane Oxidation, ACS Catal., 2020, 10(6), 3707–3719 CrossRef CAS.
- X. Liu, N. Zhang, B. Tang, M. Li, Y. W. Zhang, Z. G. Yu and H. Gong, Highly Stable New Organic-Inorganic Hybrid 3D Perovskite CH3NH3PdI3 and 2D Perovskite (CH3NH3)3Pd2I7: DFT Analysis, Synthesis, Structure, Transition Behavior, and Physical Properties, J. Phys. Chem. Lett., 2018, 9(19), 5862–5872, DOI:10.1021/acs.jpclett.8b02524.
- M. W. Lufaso and P. M. Woodward, Jahn-Teller Distortions, Cation Ordering and Octahedral Tilting in Perovskites, Acta Crystallogr., Sect. B: Struct. Sci., 2004, 60(1), 10–20, DOI:10.1107/S0108768103026661.
- J. Varignon, N. C. Bristowe and P. Ghosez, Electric Field Control of Jahn-Teller Distortions in Bulk Perovskites, Phys. Rev. Lett., 2016, 116(5), 1–5, DOI:10.1103/PhysRevLett.116.057602.
-
P. Taylor, R. L. C. Akkermans, N. A. Spenley and S. H. Robertson, Monte Carlo Methods in Materials Studio, in Molecular Simulation, Taylor & Francis, 2013, pp. 1153–1164. DOI:10.1080/08927022.2013.843775.
- F. Patel and S. Patel, Emission Control from Auto-Exhaust, Procedia Eng., 2013, 51(NUiCONE 2012), 324–329, DOI:10.1016/j.proeng.2013.01.044.
- S. K. Chawla, M. George, F. Patel and S. Patel, Production of Synthesis Gas by Carbon Dioxide Reforming of Methane over Nickel Based and Perovskite Catalysts, Procedia Eng., 2013, 51(NUiCONE 2012), 461–466, DOI:10.1016/j.proeng.2013.01.065.
- M. S. Xaba and R. Meijboom, Kinetic and Catalytic Analysis of Mesoporous Co 3 O 4 on the Oxidation of Morin, Appl. Surf. Sci., 2017, 423, 53–62, DOI:10.1016/j.apsusc.2017.06.105.
- M. Nemanashi and R. Meijboom, Catalytic Behavior of Different Sizes of Dendrimer-Encapsulated Aun Nanoparticles in the Oxidative Degradation of Morin with H2O2, Langmuir, 2015, 31(33), 9041–9053, DOI:10.1021/acs.langmuir.5b02020.
- S. Bewana, M. Joe Ndolomingo, R. Meijboom and N. Bingwa, Cobalt Oxide Promoted Tin Oxide Catalysts for Highly Selective Glycerol Acetalization Reaction, Inorg. Chem. Commun., 2021, 128(February), 108578, DOI:10.1016/j.inoche.2021.108578.
-
R. Kinetics and G. F. Froment, Catalysis from First Principles, 1999 Search PubMed.
Footnote |
| † Electronic supplementary information (ESI) available. See DOI: 10.1039/d1qi00297j |
|
| This journal is © the Partner Organisations 2021 |
Click here to see how this site uses Cookies. View our privacy policy here. 
 Open Access Article
 This Open Access Article is licensed under a Creative Commons Attribution-Non Commercial 3.0 Unported Licence
 a,
Emanuela
Carleschi
b,
Bryan P.
Doyle
b and
Ndzondelelo
Bingwa
a,
Emanuela
Carleschi
b,
Bryan P.
Doyle
b and
Ndzondelelo
Bingwa