
 Open Access Article
 This Open Access Article is licensed under a
 Creative Commons Attribution 3.0 Unported Licence
Investigating the adsorption of anisotropic diblock copolymer worms onto planar silica and nanocellulose surfaces using a quartz crystal microbalance†
Joakim
Engström‡
 a,
Michael S.
Reid
b,
Emma E.
Brotherton
c,
Eva
Malmström
a,
Steven P.
Armes
c and
Fiona L.
Hatton§
*c
a,
Michael S.
Reid
b,
Emma E.
Brotherton
c,
Eva
Malmström
a,
Steven P.
Armes
c and
Fiona L.
Hatton§
*c
aDivision of Coating Technology and Wallenberg Wood Science Center, School of Engineering Sciences in Chemistry, Biotechnology and Health, Department of Fibre and Polymer Technology, KTH Royal Institute of Technology, SE-100 44 Stockholm, Sweden
bDivision of Fibre Technology, School of Engineering Sciences in Chemistry, Biotechnology and Health, Department of Fibre and Polymer Technology, KTH Royal Institute of Technology, SE-100 44 Stockholm, Sweden
cDainton Building, Department of Chemistry, University of Sheffield, Brook Hill, Sheffield, South Yorkshire S3 7HF, UK. E-mail: f.hatton@lboro.ac.uk
First published on 6th September 2021
Abstract
Electrostatic adsorption of cationic polyelectrolytes onto anionic cellulosic substrates is an attractive route for facile surface modification of biorenewable materials. Recently, attention has focused on adsorbing cationic spherical diblock copolymer nanoparticles onto model cellulose and/or nanocellulosic substrates. Herein, we investigate physical adsorption of highly anisotropic copolymer worms bearing either anionic or cationic charge onto planar silica, cellulose nanocrystal (CNC) or cellulose nanofibril (CNF) surfaces using quartz crystal microbalance with dissipation monitoring. Electrostatic interactions dominate in the case of anionic silica and CNC surfaces because the adsorbed mass of cationic worms was greater than that of anionic worms. However, either anionic or cationic worms could be adsorbed onto in situ generated CNF substrates, suggesting that additional interactions were involved: hydrogen bonding, van der Waals forces, and possibly covalent bond formation. Scanning electron and atomic force microscopy studies of the dried planar substrates after adsorption experiments confirmed the presence of adsorbed copolymer worms. Finally, composite worm/CNF films exhibited restricted swelling behavior when immersed in water compared to reference CNF films, suggesting that the worms reinforce CNF films by acting as a physical crosslinker. This study is the first investigation of the physical adsorption of highly anisotropic diblock copolymer worms onto cellulosic surfaces.
Introduction
Cellulose has become widely recognized as an important sustainable biorenewable material owing to its abundance and excellent mechanical properties.1–3 The isolation of nanocelluloses, such as cellulose nanocrystals (CNCs), cellulose nanofibrils (CNFs) and bacterial nanocellulose (BNC) has enabled the development of cellulosic materials for value-added applications,2,4–6 such as energy-related devices,7 biomedical applications8 and nanocomposites.9,10 However, unmodified cellulosic nanomaterials are hydrophilic in nature, undergo aggregation on drying, and are poorly compatible with hydrophobic components and matrices. Thus, judicious surface modification of nanocellulose using either small molecules or macromolecules is often required to impart or enhance desirable properties (i.e. colloidal stability, surface wettability, sufficiently hydrophobic character) for specific applications.11–15CNFs are attractive nanocellulosic materials for the construction of free-standing films owing to their high aspect ratio, with mean lengths of the order of microns and diameters of around 5–20 nm, depending on the original source and production method.2,16 This anisotropy also leads to interesting aqueous dispersion properties: physical gels can be obtained at relatively low concentration (<2% w/w) under mildly acidic conditions (pH < 3–4) and aggregation can be tuned by adding salt.17–20 Typically, CNFs are produced via TEMPO-mediated oxidation21,22 or carboxymethylation23 of cellulose fibres, followed by mechanical extraction of nanofibrils from within the cell wall.2,16,24,25 During TEMPO-mediated oxidation, primary alcohols on the cellulose backbone (C6) are oxidized to form mainly anionic carboxylate groups and also a few aldehyde groups, which leads to charge-stabilized CNFs with sodium counter-ions.22,26 CNCs are also anisotropic, rod-like nanoparticles, albeit with lower aspect ratios. Typically, they exhibit mean lengths of around 100–200 nm and diameters of approximately 5–20 nm.6 CNCs have interesting optical properties and can form a liquid crystalline phase above a certain critical concentration, but do not form gels as readily as CNFs.6,27 CNCs are most commonly prepared by sulfuric acid degradation of the amorphous regions of cellulose fibres to liberate the nanocrystals located within the interior.6,28 This results in the formation of sulfate half-esters at the CNC surface leading to charge-stabilized anionic particles.6,28
Typically, nanocellulose modification is achieved by either physical adsorption of suitable ionic or non-ionic species, or by covalent grafting.11,13 The former approach is particularly attractive owing to its simplicity, use of mild conditions and cost-effectiveness. For example, block copolymers can be used to confer hydrophobic character or stimulus-responsive behavior.15 This is typically achieved using a diblock copolymer in which one block is designed to interact with the cellulose surface and the other block confers the desired property. Amphiphilic block copolymers are well-known for their propensity to self-assemble in aqueous solution.29 For example, cationic diblock copolymer micelles have been used to modify anionic cellulosic nanoparticles.30,31
Recently, polymerization-induced self-assembly (PISA) has gained widespread recognition as a robust and potentially scalable technique for the preparation of diblock copolymer nanoparticles at relatively high concentration (up to 50% w/w).32,33 PISA involves chain extension of a soluble precursor block using a monomer that forms an insoluble second block in the reaction medium, thus driving in situ self-assembly to produce sterically-stabilized nanoparticles.32 PISA syntheses are most commonly conducted via reversible addition–fragmentation chain transfer (RAFT) polymerization.33 This approach has been utilized to prepare diblock copolymer nanoparticles for the surface modification of cellulose via either ionic31,34–36 or non-ionic37 interactions. For example, Carlsson et al. reported the preparation of cationic spherical nanoparticles (NPs) by RAFT-mediated emulsion polymerization of methyl methacrylate (MMA) for the modification of cellulose.34 The electrostatic adsorption of cationic NPs onto in situ prepared CNF surfaces was monitored using a quartz crystal microbalance (QCM). Subsequently, Engström et al. extended this study by preparing cationic latex NPs comprising MMA, n-butyl methacrylate (BMA) or n-butyl acrylate (BA) and also poly(MMA-co-BA) NPs with an adjustable glass transition temperature (Tg).35,36 Using a low Tg hydrophobic core-forming block modified the adsorption behavior of such NPs, despite their common cationic stabilizer block.36 They also used QCM-D to confirm adsorption of the cationic latex particles to anionic cellulose surfaces, namely with cellulose nanofibrils adsorbed in situ. QCM-D is a useful technique which relies on the fact that quartz is piezoelectric and can oscillate at a certain frequency when an alternating electric current is applied with a frequency close to the resonant frequency.38,39 Adsorbed mass to the crystal surface is then observed as a decrease in frequency and the mass adsorbed can be calculated, as demonstrated by Sauerbrey in 1959.40 Dissipation due to the adsorption of a viscoelastic film is also monitored by evaluating the decay of the oscillation after rapid excitation.38,41
PISA enables the rational design of various copolymer morphologies, including worms, vesicles and framboidal vesicles.42 Anisotropic copolymer particles (worms) are gaining interest for use in applications such as drug delivery, rheology modifiers, to form gels, and as thermal or electrically conducting nanowires.43 Whereby often anisotropic particles outcompete their spherical counterparts, or simply cannot be compared (e.g., for nanowires applications). Of particular relevance to the present study, cationic diblock copolymer worms have been evaluated by Penfold et al. as flocculants for micron-sized silica particles.44 However, crosslinking of the worm cores was found to be necessary to ensure the survival of the initial copolymer morphology. Similarly, worm multilayers have been constructed at a planar silica surface via sequential adsorption of cationic and anionic worms (i.e., using the so-called ‘layer-by-layer’ approach).45 Although the rate of electrostatic adsorption of cationic worms at an anionic planar silica surface was demonstrated to be remarkably fast, high resolution kinetic studies using a well-established technique such as QCM were not undertaken. In the absence of added salt, the final surface coverage was less than 20%, which is comparable to that reported for other cationic nanoparticles.35,36,46
There have been several reports of the adsorption of isotropic spherical diblock copolymer nanoparticles onto cellulosic surfaces.15 However, as far as we are aware, there have been no prior studies of the adsorption of highly anisotropic worms onto such substrates. The adsorption behaviour of anisotropic particles at surfaces is of interest since multiple orientations can be adopted, whereas isotropic particles offer only one orientation. Interparticle interactions and particle–surface interactions can influence how anisotropic particle organise when adsorbed to a surface.47 Surface coverage has been shown to be dependent on aspect ratio, for example high aspect ratios can reduce surface coverage. Spherical particles typically adsorbed irreversibly and do not adsorb on top of each other, forming a monolayer, while anisotropic particles with high aspect ratios are unlikely to form a monolayer, especially when they are flexible. Anisotropic copolymer nanoparticles can also provide mechanical reinforcement, as reported by Rieger and coworkers.48 Addition of 5–10 wt% of reinforcing anisotropic copolymer nanoparticle fillers in poly(n-butyl acrylate-co-acrylic acid) latex films improved mechanical properties (increased stiffness and strength) of the films.48 Therefore, the incorporation of anisotropic diblock copolymer nanoparticles within cellulose-based composite materials can offer significant enhancements over previously reported spherical particles.
Herein, we use a highly convenient one-pot protocol49 to prepare anionic PGMA25-PGlyMA45 diblock copolymer worms, whose cores can then be crosslinked using ethylenediamine to confer net cationic charge. Importantly, using the same copolymer worms before and after modification allows for direct comparison and avoids variation in copolymer worm properties that might be experienced if using different coronal blocks. We use a quartz crystal microbalance with dissipation (QCM-D) instrument to study the adsorption of either anionic worms or cationic worms onto an anionic planar silica surface, a spin-coated CNC surface and an in situ prepared CNF surface. After these adsorption experiments, the dried substrates were examined by either scanning electron microscopy (SEM) or atomic force microscopy (AFM). Finally, free-standing nanocomposite films comprising CNF and diblock copolymer worms were also prepared to investigate how the adsorbed worms influenced film swelling behavior.
Results and discussion
Synthesis of PGMA25-PGlyMA45 and PGMA25-P(GlyMA-EDA)45 copolymer worms
Epoxy-functional diblock copolymer worms were prepared using a one-pot, three-step protocol as previously described elsewhere.49 Briefly, forced hydrolysis of glycidyl methacrylate (GlyMA; 10% w/w aqueous emulsion) was performed for 9 h at 85 °C to afford an 11.2% w/w aqueous solution of glycerol monomethacrylate (GMA),50 with 1H NMR analysis indicating more than 99% GlyMA conversion (see Fig. S1†). Subsequently, a commercially available RAFT chain transfer agent (CTA), 4-((((2-carboxyethyl)thio)carbonothioyl)thio)-4-cyanopentanoic acid (CECPA), and a low-temperature free radical initiator (VA-044) were added to the aqueous GMA solution, which was degassed and heated to 50 °C to produce the PGMA stabilizer block. After 3 h, an aliquot of this polymerizing solution was removed for characterization by 1H NMR spectroscopy and DMF GPC. High GMA conversion was achieved (99%) and the resulting PGMA25 stabilizer block had an apparent number-average molecular weight, Mn, of 7700 g mol−1 and dispersity, Đ, of 1.24 (relative to poly(methyl methacrylate) calibration standards). This PGMA25 precursor was then chain-extended via RAFT aqueous emulsion polymerization of GlyMA at 50 °C for 2 h, targeting a PGMA25-PGlyMA45 diblock copolymer at 15% w/w solids. Mildly acidic conditions (pH 2.5–3.0) were chosen to avoid ionization of the carboxylic acid end-groups conferred by the CECPA RAFT agent, which is known to prevent the formation of diblock copolymer worms.49 More than 99% GlyMA conversion was achieved and the resulting PGMA25-PGlyMA45 diblock copolymer exhibited a relatively narrow molecular weight distribution (Mn = 12![[thin space (1/6-em)]](https://www.rsc.org/images/entities/char_2009.gif) 900 g mol−1, Đ = 1.33) when characterized by DMF GPC (Fig. S2†). 1H NMR spectra recorded for the in situ prepared GMA monomer, the water-soluble PGMA25 precursor and the final PGMA25-PGlyMA45 worms are provided in the ESI (Fig. S1, S3 and S4,† respectively). A pure worm morphology was confirmed by TEM analysis of the dried PGMA25-PGlyMA45 diblock copolymer dispersion, see Fig. 1B.
900 g mol−1, Đ = 1.33) when characterized by DMF GPC (Fig. S2†). 1H NMR spectra recorded for the in situ prepared GMA monomer, the water-soluble PGMA25 precursor and the final PGMA25-PGlyMA45 worms are provided in the ESI (Fig. S1, S3 and S4,† respectively). A pure worm morphology was confirmed by TEM analysis of the dried PGMA25-PGlyMA45 diblock copolymer dispersion, see Fig. 1B.
 | ||
| Fig. 1 (A) Schematic representation of the epoxy-functional diblock copolymer worms used in this study and their covalent stabilization by reaction with ethylenediamine (EDA). TEM images confirm a highly anisotropic morphology for (B) the initial anionic PGMA25-PGlyMA45 worms and (C) the PGMA25-P(GlyMA-EDA)45 worms formed after reaction with EDA (the scale bar represents 200 nm in each case). (D) FTIR spectroscopy studies indicate that the epoxy groups within the PGlyMA worm cores react with EDA, resulting in cationic crosslinked worms. | ||
The PGMA25-PGlyMA45 diblock copolymer worms were subsequently crosslinked using ethylenediamine (EDA) to ensure preservation of their highly anisotropic morphology, Fig. 1. The PGMA25-PGlyMA45 diblock copolymer worms formed a free-standing hydrogel when prepared at 15% w/w solids owing to the formation of a 3D network structure.51,52 To ensure efficient stirring, this gel was diluted to 5% w/w with deionized water at 20 °C using a roller mill overnight to aid mixing. Excess EDA (EDA/GlyMA molar ratio = 5.0) was then added to the 5% w/w PGMA25-PGlyMA45 diblock copolymer dispersion, which was subsequently stirred at 20 °C for 24 h. The resulting crosslinked PGMA25-P(GlyMA-EDA)45 worms were purified by exhaustive dialysis against deionized water to remove unreacted EDA and retention of the worm morphology was confirmed by TEM (Fig. 1C). Freeze-dried crosslinked PGMA25-P(GlyMA-EDA)45 worms were analyzed by FTIR spectroscopy (Fig. 1D). This technique indicated loss of the characteristic asymmetric vibrational modes for the epoxy ring (903 and 840 cm−1), and the appearance of a new absorption band at 1578 cm−1 that is characteristic of secondary amines.53 Elemental microanalyses of the freeze-dried PGMA25-PGlyMA45 and PGMA25-P(GlyMA-EDA)45 worms confirmed an increase in nitrogen content from 0% to 2.85%, which indicates incorporation of the nitrogen-rich EDA reagent and implies successful crosslinking of the worm cores. Moreover, electrophoretic mobility measurements on 0.1% w/w aqueous dispersions of the linear and EDA-crosslinked worms conducted at pH 7 indicated zeta potentials of −30.7 mV and +18.8 mV, respectively. The anionic character observed prior to crosslinking arises from the ionized carboxylate groups located at the end of the PGMA stabilizer chains (originating from the CECPA RAFT agent).49 After crosslinking, the secondary amine groups within the worm cores become protonated; this leads to overall cationic character, as previously reported for EDA-crosslinked PGMA45-PGlyMA100 spheres.54 This methodology allows for the comparison of the same copolymer worm sample before (anionic) and after (cationic) modification, removing any variables that might results from using different coronal blocks to incorporate the charge.
Worm adsorption onto planar silica and nanocellulose substrates using QCM-D
The attempted adsorption of these two types of worms onto four different planar surfaces was evaluated by QCM-D (Fig. 2 and Fig. S5†). This technique can be used to analyze the kinetics and extent of adsorption with high resolution by relating the observed reduction in frequency, Δf, of an oscillating quartz crystal to an increase in mass, see Table 1.55–57 Furthermore, in situ monitoring of the associated dissipation, D, provides additional information regarding the viscoelastic properties of the adsorbed layer. The relationship between frequency and dissipation (ΔD/Δfn) can also provide information regarding the degree of hydration of the adsorbed layer. Thus, for example, a cationic polyelectrolyte (PEI) forms a relatively stiff adsorbed layer that exhibits significantly lower dissipation than relatively soft, swollen nanoparticles.34,35,57 Here, we have used the well-known Sauerbrey model,40 see eqn (1), to estimate the mass adsorbed from the decrease in frequency. However, it is worth noting that the Sauerbrey model is most appropriate for rigid adsorbed films,38,39 while the adsorbed material here show a large increase in dissipation and can be described as viscoelastic. Hence, the Sauerbrey model is likely to underestimate the actual mass adsorbed to these surfaces. Thus, we discuss the decrease in frequency rather than mass adsorbed, which has been calculated for completeness. | ||
| Fig. 2 QCM-D analysis of the frequency shift (Δf) observed for the third overtone from adsorption of 0.1 g dm−3 aqueous dispersions of anionic PGMA25-PGlyMA45 worms (solid red lines) and cationic crosslinked PGMA25-P(GlyMA-EDA)45 worms (dashed green lines) on the following substrates at a flow rate of 0.15 mL min−1: (A) silica, (B) CNCs, (C) CNFs and (D) PEI. Arrows indicate when each worm dispersion was introduced into the flow chamber and an asterisk (*) indicates a washing step. For further details regarding the preparation of each substrate see the experimental section. Representative curves are presented from experiments run in duplicate. | ||
| Substrate type | Anionic PGMA25-PGlyMA45 worms | Cationic PGMA25-P(GlyMA-EDA)45 worms | |||||||
|---|---|---|---|---|---|---|---|---|---|
| −Δfplateau [Hz] | Adsorbed massa [mg m−2] | D plateau [10−6] | −ΔD/Δf | −Δfplateau [Hz] | Adsorbed massa [mg m−2] | D plateau [10−6] | −ΔD/Δf | ||
| a Mass estimated from the Sauerbrey model using eqn (1). b Final plateau value after rinsing step. c Change in frequency calculated using Δf = Final Δfplateau − CNF Δfplateau. d Dissipation calculated using D = Final Dplateau − CNF Dplateau. e Change in frequency calculated using Δf = Final Δfplateau − PEI Δfplateau. f Dissipation calculated using D = Final Dplateau − PEI Dplateau. | |||||||||
| Silica | −2.3 | — | — | — | 133 | 7.8 | 40 | 0.30 | |
| Ex situ CNC | 14.9 | 2.6 | 2.3 | 0.15 | 212 | 37.5 | 59 | 0.28 | |
| In situ CNF | PEI | 10.4 | 1.8 | 0.2 | 0.02 | 9.6 | 1.7 | 0.2 | 0.02 |
| CNF | 57.7 | 10.2 | 7.7 | 0.13 | 49.2 | 8.7 | 6.9 | 0.14 | |
| Finalb | 321 | 56.7 | 80.0 | 0.25 | 99.8 | 17.7 | 18.8 | 0.19 | |
| Worms | 263c | 46.5 | 72.3d | 0.27 | 50.6c | 9.0 | 11.9d | 0.24 | |
| In situ PEI | PEI | 8.6 | 1.5 | 0.2 | 0.02 | 8.7 | 1.5 | 0.2 | 0.02 |
| Finalb | 253 | 44.9 | 56.6 | 0.22 | 350 | 62.0 | 81.3 | 0.23 | |
| Worms | 244e | 43.3 | 56.4f | 0.23 | 342e | 60.5 | 81.1f | 0.24 | |
QCM-D crystals supplied by the manufacturer are coated with silica (SiO2), leading to anionic surface charge in an aqueous environment.36 CNC surfaces were prepared by spin-coating an aqueous CNC dispersion onto QCM-D crystals, followed by equilibration in water overnight.4 In contrast, CNF surfaces were prepared using an in situ method.36,58 Briefly, cationic PEI was adsorbed onto the silica substrate to induce charge reversal,58 prior to the electrostatic adsorption of anionic CNFs followed by rinsing with ultrapure water. For comparison, a PEI-coated crystal was also used as a cationic substrate in these adsorption experiments. Before introducing the aqueous worm dispersions (0.1 g dm−3) into the QCM-D flow chamber, each substrate was equilibrated for at least 5 min using ultrapure Milli-Q water to produce a flat baseline.
Silica surfaces
As expected, there was negligible adsorption of the anionic PGMA25-PGlyMA45 diblock copolymer worms onto the anionic planar silica surface (Fig. 2A) since the electrostatic interactions are unfavorable in this case. In contrast, the cationic crosslinked PGMA25-P(GlyMA-EDA)45 worms exhibited a significant reduction in frequency (>120 Hz), indicating adsorption onto the silica surface. Using the Sauerbrey model (eqn (1)), the corresponding adsorbed mass was estimated to be 7.8 mg m−2 (see Table 1). No further adsorption occurred after approximately 20 min, as indicated by a plateau in Δf. In this case, an −ΔD/Δf ratio of 0.3 indicated a relatively swollen layer of cationic crosslinked PGMA25-P(GlyMA-EDA)45 copolymer worms at the silica surface.These data can be compared to that reported for the adsorption of high Tg cationic PMMA latex particles of 215 nm diameter, which exhibited a −ΔD/Δf of around 0.3 for a ∼75 Hz reduction in frequency.36 Here, a significant increase in frequency occurred during the rinsing step (* in Fig. 2A), indicating that loosely bound worms were removed from the surface. This is consistent with the reduction in dissipation that occurs at 35 min, see Fig. S5A.† SEM analysis of the dried substrates confirmed the absence of any adsorbed anionic PGMA25-PGlyMA45 diblock copolymer worms, whereas adsorption of the cationic crosslinked PGMA25-P(GlyMA-EDA)45 worms was observed, albeit at submonolayer coverage (see Fig. 3).
 | ||
| Fig. 3 Field emission SEM images recorded for dried planar silica substrates following QCM-D adsorption experiments using (A) anionic linear PGMA25-PGlyMA45 worms and (B) cationic crosslinked PGMA25-P(GlyMA-EDA)45 worms. | ||
Ex situ CNC surfaces
The spin-coated CNC surfaces are highly anionic with typical charge densities of 0.08–0.350 mmol g−1.4 The anionic PGMA25-PGlyMA45 worms exhibited relatively weak adsorption to such surfaces: the initial frequency reduction of only ∼25 Hz was reduced to −10 Hz after rinsing (Fig. 2B). This latter value corresponds to an effective adsorbed amount of just 2.6 mg m−2 (Table 1). However, given the mutual repulsion between the worms and the substrate, no adsorption at all had been anticipated for this particular system. In contrast, there were much more of the cationic crosslinked PGMA25-P(GlyMA-EDA)45 worms adsorbed at the CNC surface: an initial Δf of −270 Hz prior to washing led to an equilibrium frequency of −220 Hz, which corresponds to an estimated adsorbed amount of 37.5 mg m−2. This is more than an order of magnitude higher than that observed for the anionic worms on the same surface, which is understandable given the strong electrostatic attractive forces involved. The −ΔD/Δf ratios calculated for the adsorbed layers of anionic and cationic worms were 0.15 and 0.27 respectively, which indicates that the former layer is significantly less viscoelastic. Moreover, the dissipation, D, is more than twenty times higher for the cationic worms (57.4 × 10⁻⁶) compared to that for the anionic worms (2.8 × 10⁻⁶), see Fig. S5B.†Atomic force microscopy (AFM) was used to image the adsorbed worms on the CNC substrate, Fig. 4, due to difficulties imaging the CNC surfaces using SEM. The underlying surface is both dense and smooth, with directional alignment of the rod-like CNCs (Fig. 4A) and only a few anionic worms discernible at the surface. In contrast, there is no evidence for the underlying CNC substrate after adsorption of the cationic crosslinked PGMA25-P(GlyMA-EDA)45 worms, which form a relatively densely packed adsorbed layer (Fig. 4B). These AFM observations are consistent with the QCM-D data (Table 1), with a significantly higher fractional surface coverage being obtained for the cationic worms compared to that achieved for the planar silica surface.
 | ||
| Fig. 4 AFM height images recorded for dried substrates following QCM-D experiments monitoring the adsorption of (A) anionic linear PGMA25-PGlyMA45 worms and (B) cationic crosslinked PGMA25-P(GlyMA-EDA)45 worms onto ex situ prepared CNC. | ||
In situ CNF surfaces
When preparing the in situ CNF surface, the initial reduction in frequency observed after 5 min corresponds to the introduction of cationic polyelectrolyte (PEI) into the QCM-D chamber. This led to a plateau of around −10 Hz as full PEI coverage was achieved, Fig. 2C. A further reduction in frequency was observed after 17–18 min owing to the adsorption of anionic CNFs onto the PEI-coated substrate. This produced a second Δf plateau at around −50 Hz. After a rinsing step to remove extraneous CNF, diblock copolymer worms were then introduced into the QCM-D flow chamber after approximately 55 min. Adsorption of the cationic crosslinked PGMA25-P(GlyMA-EDA)45 worms occurred, as indicated by a reduction in frequency to around −200 Hz. However, a rinsing step reduced this Δf to an equilibrium value of −99.8 Hz, indicating removal of loosely bound worms from the CNF surface. The final adsorbed amount of cationic crosslinked PGMA25-P(GlyMA-EDA)45 worms adsorbed at the in situ CNF/PEI surface was estimated to be 9.0 mg m−2 (Δf = 50.6 Hz), which is lower than that previously reported for spherical cationic nanoparticles.35,36 However, the cationic character of the crosslinked PGMA25-P(GlyMA-EDA)45 worms arises from protonated amines located within the worm cores, which is reduced to some extent by the non-ionic PGMA stabilizer block. This interpretation is supported by observations made for EDA-crosslinked PGMA-PGlyMA spheres, which were less cationic than the equivalent spherical nanoparticles crosslinked using a longer diamine.54 Moreover, the adsorbed cationic worm layer is expected to exhibit strong electrostatic interactions with the anionic CNF, which may result in a denser adsorbed layer, causing charge reversal and preventing further adsorption of cationic worms.Unexpectedly, the anionic PGMA25-PGlyMA45 worms adsorbed at the equivalent in situ CNF/PEI surface, with a much greater decrease in frequency observed. Given that both the CNFs and PGMA25-PGlyMA45 worms are anionic, minimal adsorption was anticipated owing to mutual electrostatic repulsion. However, the decrease in frequency observed for anionic PGMA25-PGlyMA45 worms was 263 Hz, which is much greater than that obtained for cationic worms on the same substrate (50.6 Hz). The increase in dissipation (Fig. S5C†) after worm adsorption corresponds to a similar frequency shift (Fig. 2C) and comparable −ΔD/Δf ratios (see Table 1). In both cases, SEM studies of dried substrates revealed the presence of adsorbed worms (Fig. 5).
 | ||
| Fig. 5 Field emission SEM images recorded for dried substrates following QCM-D adsorption experiments of (A) anionic PGMA25-PGlyMA45 worms and (B) cationic PGMA25-P(GlyMA-EDA)45 worms onto in situ CNF surfaces. | ||
In principle, this counter-intuitive behavior could be related to the underlying layer of PEI chains. Given the rather stiff nature of the anisotropic CNF nanoparticles,35 it is perhaps unlikely that they would fully cover the electrostatically-adsorbed PEI chains. Thus, adsorption of each worm type to a PEI-coated surface was also investigated (see Fig. 2D). Surprisingly, the cationic crosslinked worms exhibited a larger Δf than the anionic linear worms, and the corresponding estimated adsorbed amount was larger than for most of the other surfaces studied (Table 1). A relatively high adsorbed amount was expected for the anionic worms owing to strong electrostatic attractive forces, as previously observed for anionic silica nanoparticles on PEI.59 Thus, exposed regions of underlying PEI chains might explain why anionic worms can adsorb onto the anionic CNF surface.
However, the adsorption of cationic crosslinked worms onto the cationic PEI layer was higher than expected, suggesting that adsorption was governed by non-electrostatic interactions in this case. For example, hydrogen bonding may occur between the cis-diol groups present in the GMA repeat units and the amines (primary, secondary and tertiary) in the PEI chains, see Fig. 6. However, given that the two types of worms each have the same PGMA stabilizer block, similar degrees of hydrogen bonding might be expected. Another likely adsorption mechanism is the formation of covalent bonds between the PEI chains and the cationic crosslinked worms (Fig. 6).
 | ||
| Fig. 6 Schematic representation of the various ways by which cationic crosslinked PGMA45-P(GlyMA-EDA)45 worms can interact with the four types of planar surfaces investigated in this study (silica, CNC, CNF, and PEI). Including (i) electrostatic interactions, (ii) hydrogen bonding and (iii) covalent bonding. | ||
It is worth noting that the increase in frequency before and after rinsing for cationic crosslinked worms on silica, ex situ CNC and in situ CNF surfaces was significant (Δf = 84, 59 and 103 Hz, respectively). In principle, counter-ion exchange could account for part of this mass loss. Thus, we investigated the effect of counter-ion exchange after adsorption of the cationic crosslinked worms onto an in situ generated CNF surface, see Fig. S6.† After the rinsing step, a buffer solution was introduced into the QCM-D chamber. This resulted in a Δf of −18 Hz, which then returned to its previous value after a subsequent rinsing step with deionized water. This suggests that counter-ion exchange between the surface and the buffer solution was responsible for this observed reduction in frequency. This Δf is considerably lower than that observed after adsorption of the cationic worms, confirming that the mass loss after rinsing is due to desorption of weakly-bound nano-objects rather than counter-ion exchange alone.
Worm-surface interactions appear to be governed by both electrostatic and non-ionic interactions, with differing behavior observed for CNF and CNC surfaces. The latter interactions include (i) hydrogen bonding owing to the cis-diol group in the GMA repeat units of the steric stabilizer block, (ii) potential covalent bond formation (see Fig. 6), and (iii) van der Waals interactions. Most notably, the strongest adsorption is observed for cationic crosslinked worms on the cationic PEI layer, which would not be the case if worm-surface interactions were dominated by electrostatic interactions.
Worm/CNF nanocomposite films
To further investigate worm/CNF interactions, vacuum filtration was used to produce free-standing worm/CNF nanocomposite films that mainly swell in the thickness direction.60 In this case the worms comprised 25% by mass of the nanocomposite film, as previously reported for latex/CNF composite films.35 It is perhaps worth emphasizing that the hydrophilic nature and associated substantial swelling of CNF films is considered to be a significant limitation for their use in wet environments.Depending on the drying technique, reference CNF films can swell up to more than 1000% in thickness.60,61 Reduced swelling indicates lower sensitivity to water and suggests network formation within the film. This can be achieved by introducing secondary interactions, such as Ca2+ counter-ions or covalent bonds between the film components.61,62 With the incorporation of anionic linear worms, the resulting films swelled up to 600% in thickness after equilibration for 24 h in water. In contrast, cationic crosslinked worms exhibited only a 200% increase in film thickness. Such restricted swelling suggests that electrostatic attractive forces between anionic CNF and the cationic worms result in a denser network. While, in QCM-D experiments (see Table 1, Fig. 2) a larger decrease in frequency was observed for anionic copolymer worms than the cationic worms, the adsorbed cationic worms are likely to form a denser adsorbed layer due to stronger electrostatic interactions. Although there is no such electrostatic attraction between anionic worms and anionic CNFs, the restricted swelling observed in this case is consistent with the QCM-D data and implies additional attractive forces between these two components, as discussed above (see Fig. 6).
On mixing the charged worms with the anionic CNFs, one might expect to observe flocculation, coacervate formation or retention of colloidal stability. In principle, the degree of dispersion can be assessed by evaluating the homogeneity of the resulting nanocomposite films by cross-sectional analysis using SEM, as reported previously for cationic latexes mixed with anionic CNFs.35,63 Accordingly, cross-sectioned worm/CNF films were examined by SEM. The anionic PGMA25-PGlyMA45 worms appear to be well-dispersed within such nanocomposites, affording a homogeneous layered structure (Fig. 7 and Fig. S7A†). Moreover, FT-IR spectroscopy studies confirmed the presence of these worms, as indicated by the characteristic ester carbonyl band at 1730 cm−1, see Fig. S8.† In contrast, the cationic PGMA25-P(GlyMA-EDA)45 worms exhibited some variance in the thickness direction, suggesting their flocculation prior to film formation (Fig. S7B†). Indeed, such flocculation was indicated by the greater turbidity observed after mixing. However, relatively weak flocculation may not always be detectable by such measurements. Furthermore, flocculation might also occur during the vacuum filtration process used to create such nanocomposite films. In principle, small angle X-ray scattering (SAXS) might enable the degree of dispersion to be assessed during film formation, as suggested by prior spray brush studies64,65 and in situ PISA syntheses.66 However, this is beyond the scope of the present study. In summary, the restricted swelling behavior and high degree of dispersion suggest that these worm-CNF nanocomposites could be interesting materials for drug delivery or other hydrogel-type applications.
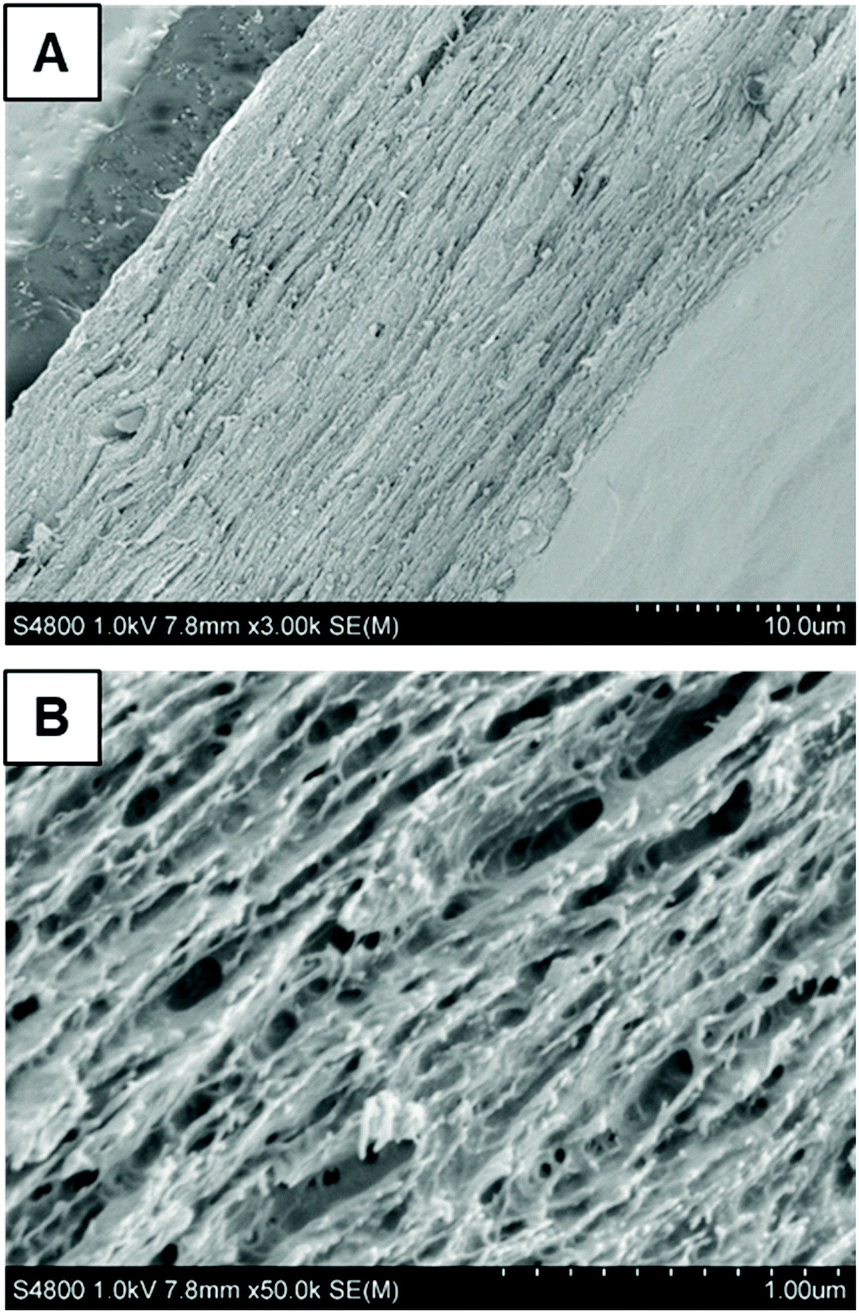 | ||
| Fig. 7 Field emission SEM images recorded at (A) low and (B) high magnification for a cross-sectional area of a nanocomposite film comprising 25% w/w anionic PGMA25-PGlyMA45 copolymer worms and 75% w/w CNFs. | ||
Conclusions
Epoxy-functional PGMA25-PGlyMA45 diblock copolymer worms were crosslinked using epoxy-amine chemistry. The original linear anionic PGMA25-PGlyMA45 worms and crosslinked cationic PGMA25-P(GlyMA-EDA)45 worms were evaluated for their adsorption onto planar silica and nanocellulose (CNC, CNF) surfaces using QCM-D. Worm adsorption onto silica and ex situ CNC substrates was primarily governed by electrostatics: anionic worms exhibited minimal adsorption on either surface, whereas the adsorbed amounts of cationic worms were 7.8 and 37.5 mg m−2, respectively. These observations suggest that the surface roughness and/or the CNC surface functionality also influences the adsorption behavior. The adsorption of copolymer worms onto an in situ generated CNF surface (using cationic PEI chains to achieve surface charge reversal of the silica substrate, hence enabling subsequent CNF adsorption) revealed relatively strong adsorption for both the anionic worms and the cationic worms, which cannot be explained in terms of electrostatic interactions. Indeed, QCM-D studies indicated that anionic and cationic worms adsorbed onto PEI-coated surfaces at adsorbed amounts of 43.3 and 60.5 mg m−2, respectively. This suggests that worm-surface interactions are dominated by hydrogen bonding (between the cis-diol unit in the GMA repeat units and amine groups in the PEI chains), van der Waals forces, or perhaps covalent bond formation via epoxy-amine chemistry, rather than electrostatics. However, further studies are required to confirm this hypothesis. Visual confirmation of worm adsorption onto planar silica and nanocellulose surfaces was confirmed by SEM and AFM studies. Finally, worm/CNF nanocomposites were prepared via vacuum filtration. Incorporation of 25% w/w anionic or cationic worms within the CNF films resulted in free-standing films. The degrees of swelling observed for such nanocomposite films were 600% and 200%, respectively. This is much lower than that reported for CNF films alone (>1000%), indicating that the incorporation of worms significantly reduces their swelling capacity. As far as we are aware, this is the first study of the adsorption of highly anisotropic diblock copolymer worms onto nanocellulose-based substrates.Experimental section
Materials
4-(((2-(Carboxyethyl)thio)carbonothioyl)thio)-4-cyano-pentanoic acid (CECPA; 95%) was kindly donated by Boron Molecular (Melbourne, Australia). Glycidyl methacrylate (GlyMA; 97%), ethylenediamine (EDA, ≥99%) and hydrochloric acid (HCl; 37%) were purchased from Sigma-Aldrich UK and used as received. VA-044 (VA-044; ≥97%) was purchased from Wako Chemicals GmBH. Dimethyl sulfoxide-d6 and CD3OD were purchased from Goss Scientific Instruments Ltd (Cheshire, UK). All other solvents were purchased from Fisher Scientific (Loughborough, UK) and used as received. Poly(ethylene imine) (PEI, Mn = 60000 g mol−1) was purchased from Acros Organics. 2,2,6,6-tetramethyl-1-piperidinyloxy (TEMPO), sodium hypochlorite (14% solution), sodium chlorite were obtained from Sigma-Aldrich AB and sodium bromide (99+%) from Alfa Aesar. Phosphate buffer at pH 6.8 was prepared from aqueous solutions of sodium phosphate monobasic (NaH2PO4, ≥99%) and sodium phosphate dibasic (Na2HPO4, ≥99%) salts, both purchased from Sigma-Aldrich. Deionized water was used for all experiments. Biotech Cellulose Ester Dialysis Tubing was purchased from Spectrum Laboratories Inc. (USA) with a molecular weight cut-off (MWCO) of 50 kDa and flat width of 31 mm (∅ = 20 mm, vol = 3.1 mL cm−1). CNCs were prepared from cotton Whatman ashless filter aid via sulfuric acid hydrolysis according to Reid et al.6 The pulp used for the preparation of cellulose nanofibrils was a ‘never-dried’ dissolving pulp (60% Norwegian spruce and 40% Scots Pine) kindly supplied by Domsjö Aditya Birla AB, Domsjö, Sweden. The preparation of cellulose nanofibrils was conducted via TEMPO-oxidation at pH 6.8 in phosphate buffer to liberate the fibrils from the fibres using the method reported by Saito et al.,21,67 achieving a charge density of ∼600 μeq g−1 as measured by conductometric titration.68 After TEMPO oxidation, the oxidized fibres were passed through a high-pressure homogenizer (Microfluidizer M-110EH, Microfluidics Corp, USA) by two passes through 400 μm and 200 μm chambers at 1000 bar and four passes through 200 μm and 100 μm at 1650 bar, to produce a gel at 0.89% w/w dry content, similar to the protocol reported by Cervin et al.69
Characterization methods
000 g mol−1). Chromatograms were analysed using Agilent GPC/SEC software.
| m = C(Δf × n−1) | (1) |
The QCM-D also detects the energy dissipation in the adsorbed layer, which is related to its viscoelastic properties. A thin, rigid film results in a relatively small change in dissipation, while a solvent-rich, viscoelastic film results in a larger change in dissipation. The dissipation factor, D, is defined as:
| D = Edissipated/2πEstored | (2) |
Synthesis
QCM-D adsorption experiments
Nanocomposite worm-CNF films
000 rpm for 20 min in a 500 mL flask. The resulting CNF dispersion was degassed for 30 min under vacuum to remove any air bubbles. Following previously published protocols developed for cationic nanoparticles,35 worm-CNF nanocomposite films were prepared by adding an aqueous worm dispersions (∼3 g dm−3) dropwise to target a 25% w/w worm loading in a final nanocomposite of either 100 mg or 400 mg dry weight depending on size. The CNF dispersion or worm-CNF dispersion was then mixed by magnetic stirring for 30 min prior to vacuum filtration through a glass filter funnel (7.2 cm in diameter) using a 0.65 μm PVDF membrane (DVPP Millipore, USA) with a target film thickness of 30–70 μm and grammage of 40–80 g m−2.71,72 After filtration, the films were allowed to dry for at least 24 h in a Petri dish placed in a fumehood prior to either reswelling or being placed in an air-conditioned room at 23 °C for 24 h maintained at 50% relative humidity prior to further characterization.
 | (3) |
Conflicts of interest
There are no conflicts to declare.Acknowledgements
S.P.A. thanks the EPSRC for a four-year Established Career Particle Technology Fellowship (EP/R003009/1). J.E and E.M would like to acknowledge the Knut and Alice Wallenberg foundation through the Wallenberg Wood Science Centre (WWSC) for financial support. We thank Boron Molecular (Melbourne, Australia) for the kind gift of the dicarboxylic acid RAFT agent (CECPA) and Domsjö Aditya Birla AB (Domsjö, Sweden) for donating the ‘never dried’ cellulose pulp used in this study. Dr Svetomir Tzokov (University of Sheffield, UK) is thanked for carbon-coating the TEM grids.References
- D. Klemm, B. Heublein, H.-P. Fink and A. Bohn, Angew. Chem., Int. Ed., 2005, 44, 3358–3393 CrossRef CAS PubMed.
- D. Klemm, F. Kramer, S. Moritz, T. Lindström, M. Ankerfors, D. Gray and A. Dorris, Angew. Chem., Int. Ed., 2011, 50, 5438–5466 CrossRef CAS PubMed.
- B. P. Mooney, Biochem. J., 2009, 418, 219–232 CrossRef CAS PubMed.
- E. J. Foster, R. J. Moon, U. P. Agarwal, M. J. Bortner, J. Bras, S. Camarero-Espinosa, K. J. Chan, M. J. D. Clift, E. D. Cranston, S. J. Eichhorn, D. M. Fox, W. Y. Hamad, L. Heux, B. Jean, M. Korey, W. Nieh, K. J. Ong, M. S. Reid, S. Renneckar, R. Roberts, J. A. Shatkin, J. Simonsen, K. Stinson-Bagby, N. Wanasekara and J. Youngblood, Chem. Soc. Rev., 2018, 47, 2609–2679 RSC.
- K.-Y. Lee, G. Buldum, A. Mantalaris and A. Bismarck, Macromol. Biosci., 2014, 14, 10–32 CrossRef CAS PubMed.
- M. S. Reid, M. Villalobos and E. D. Cranston, Langmuir, 2016, 33, 1583–1598 CrossRef PubMed.
- X. Du, Z. Zhang, W. Liu and Y. Deng, Nano Energy, 2017, 35, 299–320 CrossRef CAS.
- M. Jorfi and E. J. Foster, J. Appl. Polym. Sci., 2015, 132, 41719 CrossRef.
- H. Kargarzadeh, M. Mariano, J. Huang, N. Lin, I. Ahmad, A. Dufresne and S. Thomas, Polymer, 2017, 132, 368–393 CrossRef CAS.
- A. Sharma, M. Thakur, M. Bhattacharya, T. Mandal and S. Goswami, Biotechnol. Rep., 2019, 21, e00316 CrossRef PubMed.
- F. Rol, M. N. Belgacem, A. Gandini and J. Bras, Prog. Polym. Sci., 2019, 88, 241–264 CrossRef CAS.
- D. Roy, M. Semsarilar, J. T. Guthrie and S. Perrier, Chem. Soc. Rev., 2009, 38, 2046–2064 RSC.
- Y. Habibi, Chem. Soc. Rev., 2014, 43, 1519–1542 RSC.
- S. Wohlhauser, G. Delepierre, M. Labet, G. Morandi, W. Thielemans, C. Weder and J. O. Zoppe, Macromolecules, 2018, 51, 6157–6189 CrossRef CAS.
- F. L. Hatton, E. Malmström and A. Carlmark, Eur. Polym. J., 2015, 65, 325–339 CrossRef CAS.
- R. J. Moon, A. Martini, J. Nairn, J. Simonsen and J. Youngblood, Chem. Soc. Rev., 2011, 40, 3941–3994 RSC.
- L. Mendoza, W. Batchelor, R. F. Tabor and G. Garnier, J. Colloid Interface Sci., 2018, 509, 39–46 CrossRef CAS PubMed.
- A. B. Fall, S. B. Lindström, O. Sundman, L. ödberg and L. Wågberg, Langmuir, 2011, 27, 11332–11338 CrossRef CAS PubMed.
- M. Nordenström, A. Fall, G. Nyström and L. Wågberg, Langmuir, 2017, 33, 9772–9780 CrossRef PubMed.
- H. Fukuzumi, R. Tanaka, T. Saito and A. Isogai, Cellulose, 2014, 21, 1553–1559 CrossRef CAS.
- T. Saito, Y. Nishiyama, J.-L. Putaux, M. Vignon and A. Isogai, Biomacromolecules, 2006, 7, 1687–1691 CrossRef CAS PubMed.
- A. Isogai, T. Saito and H. Fukuzumi, Nanoscale, 2011, 3, 71–85 RSC.
- L. Wågberg, G. Decher, M. Norgren, T. Lindström, M. Ankerfors and K. Axnäs, Langmuir, 2008, 24, 784–795 CrossRef PubMed.
- A. F. Turbak, F. W. Snyder and K. R. Sandberg, in J. Appl. Polym. Sci., Appl. Polym. Symp, United States, 1983, vol. 37, pp. 815–827 Search PubMed.
- B. G. Rånby, Acta Chem. Scand., 1949, 3, 649–650 CrossRef.
- A. Isogai, T. Hänninen, S. Fujisawa and T. Saito, Prog. Polym. Sci., 2018, 86, 122–148 CrossRef CAS.
- J. P. F. Lagerwall, C. Schütz, M. Salajkova, J. Noh, J. H. Park, G. Scalia and L. Bergström, NPG Asia Mater., 2014, 6, e80 CrossRef CAS.
- S. Beck-Candanedo, M. Roman and D. G. Gray, Biomacromolecules, 2005, 6, 1048–1054 CrossRef CAS PubMed.
- Y. Mai and A. Eisenberg, Chem. Soc. Rev., 2012, 41, 5969–5985 RSC.
- M. Wang, A. Olszewska, A. Walther, J.-M. Malho, F. H. Schacher, J. Ruokolainen, M. Ankerfors, J. Laine, L. A. Berglund, M. Österberg and O. Ikkala, Biomacromolecules, 2011, 12, 2074–2081 CrossRef CAS PubMed.
- A. Boujemaoui, C. Cobo Sanchez, J. Engström, C. Bruce, L. Fogelström, A. Carlmark and E. Malmström, ACS Appl. Mater. Interfaces, 2017, 9, 35305–35318 CrossRef CAS.
- S. L. Canning, G. N. Smith and S. P. Armes, Macromolecules, 2016, 49, 1985–2001 CrossRef CAS PubMed.
- F. D'Agosto, J. Rieger and M. Lansalot, Angew. Chem., 2020, 59, 2–27 CrossRef.
- L. Carlsson, A. Fall, I. Chaduc, L. Wågberg, B. Charleux, E. Malmström, F. D'Agosto, M. Lansalot and A. Carlmark, Polym. Chem., 2014, 5, 6076–6086 RSC.
- J. Engström, F. L. Hatton, L. Wågberg, F. D'Agosto, M. Lansalot, E. Malmström and A. Carlmark, Polym. Chem., 2017, 8, 1061–1073 RSC.
- J. Engström, T. Benselfelt, L. Wågberg, F. D'Agosto, M. Lansalot, A. Carlmark and E. Malmström, Nanoscale, 2019, 11, 4287–4302 RSC.
- F. L. Hatton, M. Ruda, M. Lansalot, F. D'Agosto, E. Malmström and A. Carlmark, Biomacromolecules, 2016, 17, 1414–1424 CrossRef CAS PubMed.
- M. C. Dixon, J. Biomol. Tech., 2008, 19, 151–158 Search PubMed.
- I. Reviakine, D. Johannsmann and R. P. Richter, Anal. Chem., 2011, 83, 8838–8848 CrossRef CAS PubMed.
- G. Sauerbrey, Z. Phys., 1959, 155, 206–222 CrossRef CAS.
- M. Rodahl, F. Höök, A. Krozer, P. Brzezinski and B. Kasemo, Rev. Sci. Instrum., 1995, 66, 3924–3930 CrossRef CAS.
- N. J. Warren and S. P. Armes, J. Am. Chem. Soc., 2014, 136, 10174–10185 CrossRef CAS PubMed.
- J. C. Foster, S. Varlas, B. Couturaud, Z. Coe and R. K. O'Reilly, J. Am. Chem. Soc., 2019, 141, 2742–2753 CrossRef CAS PubMed.
- N. J. W. Penfold, Y. Ning, P. Verstraete, J. Smets and S. P. Armes, Chem. Sci., 2016, 7, 6894–6904 RSC.
- N. J. W. Penfold, A. J. Parnell, M. Molina, P. Verstraete, J. Smets and S. P. Armes, Langmuir, 2017, 33, 14425–14436 CrossRef CAS PubMed.
- M. R. Talingting, Y. Ma, C. Simmons and S. E. Webber, Langmuir, 2000, 16, 862–865 CrossRef CAS.
- P. Viot, G. Tarjus, S. M. Ricci and J. Talbot, J. Chem. Phys., 1998, 97, 5212 CrossRef.
- R. Albigès, P. Klein, S. Roi, F. Stoffelbach, C. Creton, L. Bouteiller and J. Rieger, Polym. Chem., 2017, 8, 4992 RSC.
- F. L. Hatton, A. M. Park, Y. R. Zhang, G. D. Fuchs, C. K. Ober and S. P. Armes, Polym. Chem., 2019, 10, 194–200 RSC.
- L. P. D. Ratcliffe, A. J. Ryan and S. P. Armes, Macromolecules, 2013, 46, 769–777 CrossRef CAS.
- J. R. Lovett, M. J. Derry, P. C. Yang, F. L. Hatton, N. J. Warren, P. W. Fowler and S. P. Armes, Chem. Sci., 2018, 9, 7138–7144 RSC.
- F. L. Hatton, M. J. Derry and S. P. Armes, Polym. Chem., 2020, 6343–6355 RSC.
- R. A. Heacock and L. Marion, Can. J. Chem., 1956, 34, 1782–1795 CrossRef CAS.
- F. L. Hatton, J. R. Lovett and S. P. Armes, Polym. Chem., 2017, 8, 4856–4868 RSC.
- Q. Chen, S. Xu, Q. Liu, J. Masliyah and Z. Xu, Adv. Colloid Interface Sci., 2016, 233, 94–114 CrossRef CAS PubMed.
- T. Saarinen, M. Österberg and J. Laine, J. Dispersion Sci. Technol., 2009, 30, 969–979 CrossRef CAS.
- A. L. J. Olsson, I. R. Quevedo, D. He, M. Basnet and N. Tufenkji, ACS Nano, 2013, 7, 7833–7843 CrossRef CAS PubMed.
- C. Aulin, I. Varga, P. M. Claesson, L. Wågberg and T. Lindström, Langmuir, 2008, 24, 2509–2518 CrossRef CAS PubMed.
- C. Peng, Y. S. Thio, R. A. Gerhardt, H. Ambaye and V. Lauter, Chem. Mater., 2011, 23, 4548–4556 CrossRef CAS.
- F. L. Hatton, J. Engström, J. Forsling, E. Malmström and A. Carlmark, RSC Adv., 2017, 7, 14947–14958 RSC.
- T. Benselfelt, J. Engström and L. Wågberg, Green Chem., 2018, 20, 2558–2570 RSC.
- M. Shimizu, T. Saito and A. Isogai, J. Memb. Sci., 2016, 500, 1–7 CrossRef CAS.
- J. Engström, A. M. Jimenez and E. Malmström, Nanoscale, 2020, 12, 6462–6471 RSC.
- J. Engström, C. J. Brett, V. Körstgens, P. Müller-Buschbaum, W. Ohm, E. Malmström and S. V. Roth, Adv. Funct. Mater., 2020, 30, 1–9 Search PubMed.
- W. Ohm, A. Rothkirch, P. Pandit, V. Körstgens, P. Müller-Buschbaum, R. Rojas, S. Yu, C. J. Brett, D. L. Söderberg and S. V. Roth, J. Coat. Technol. Res., 2018, 15, 759–769 CrossRef CAS.
- E. E. Brotherton, F. L. Hatton, A. A. Cockram, M. J. Derry, A. Czajka, E. J. Cornel, P. D. Topham, O. O. Mykhaylyk and S. P. Armes, J. Am. Chem. Soc., 2019, 141, 13664–13675 CrossRef CAS PubMed.
- T. Saito, M. Hirota, N. Tamura, S. Kimura, H. Fukuzumi, L. Heux and A. Isogai, Biomacromolecules, 2009, 10, 1992–1996 CrossRef CAS PubMed.
- S. Katz, R. P. Beatson and A. M. Scallan, Sven. Papperstidn., 1984, 87, 48–53 Search PubMed.
- N. T. Cervin, E. Johansson, J.-W. Benjamins and L. Wågberg, Biomacromolecules, 2015, 16, 822–831 CrossRef CAS PubMed.
- E. Larsson, C. C. Sanchez, C. Porsch, E. Karabulut, L. Wågberg and A. Carlmark, Eur. Polym. J., 2013, 49, 2689–2696 CrossRef CAS.
- H. Fukuzumi, T. Saito, T. Iwata, Y. Kumamoto and A. Isogai, Biomacromolecules, 2008, 10, 162–165 CrossRef PubMed.
- M. Henriksson, L. A. Berglund, P. Isaksson, T. Lindström and T. Nishino, Biomacromolecules, 2008, 9, 1579–1585 CrossRef CAS PubMed.
Footnotes |
| † Electronic supplementary information (ESI) available. See DOI: 10.1039/d1py00644d |
| ‡ Present address: Departments of Bioengineering and Materials Science and Engineering, University of California, Berkeley, 210 Hearst Mining Building, Berkeley, CA 94720, USA |
| § Present address: Department of Materials, Loughborough University, Loughborough, LE11 3TU, UK. |
| This journal is © The Royal Society of Chemistry 2021 |