 Open Access Article
Creative Commons Attribution 3.0 Unported Licence
Understanding and controlling the glass transition of HTPB oligomers†
Eleftheria
Dossi
 *a,
Jacob
Earnshaw
 b,
Laurence
Ellison
b,
Gabriella
Rabello dos Santos
b,
Laurence
Ellison
b,
Gabriella
Rabello dos Santos
 c,
Hamish
Cavaye
 d and
Douglas J.
Cleaver
 b
b
aCentre for Defence Chemistry, Cranfield University, Defence Academy of United Kingdom, Shrivenham, SN6 8LA, UK. E-mail: e.dossi@cranfield.ac.uk
bMaterials and Engineering Research Institute, Sheffield Hallam University, City Campus, Howard Street, Sheffield, S1 1WB, UK
cInstituto Militar de Engenharia, Praca Gen Tiburcio, nr 80, Praia Vermelha (22290-270), Rio de Janeiro, RJ, Brasil
dIsis Neutron and Muon Source, Rutherford Appleton Laboratory, Science and Technology Facilities Council, Didcot, OX11 0QX, UK
First published on 7th April 2021
Abstract
In this paper, we use a combination of experiment and simulation to achieve enhanced levels of synthetic control on the microstructure of the much-used binder material hydroxyl terminated polybutadiene (HTPB). Specifically, we determine the appropriate combination of initiator, temperature and solvent required to dial in the relative contents of trans, cis and vinyl monomeric units. When an alkylithium initiator (TBDMSPLi) is used, the vinyl content increases from 18% to >90% as the polymerization solvent is switched from non-polar to polar. Further, in non-polar solvents, the vinyl content increases from 18% to 40% with decreasing polymerization temperature. The glass transition temperature, Tg, is shown to be strongly affected by the microstructure, covering the very wide range of −95 °C to −25 °C. The Tg values of HTPB oligomers with high vinyl content are exceptionally high (−25 °C) and can be associated with their aliphatic backbones with pendant side-groups structures. The experimental indications that intramolecular degrees of freedom have a dominant effect on Tg are confirmed by Molecular Dynamics simulations. These simulations identify crankshaft flips of main-chain sub-sections as the key mechanism and relate this to the vinyl content; the frequency of these rotations increases by an order of magnitude, as the vinyl content is reduced from 90% to 20%. The generic mechanistic understanding gained here into what constitutes a “good binder” material is readily transferrable to the potential identification of future candidate systems with very different chemistries.
1. Introduction
Hydroxyl terminated polybutadiene (HTPB) exhibits several highly valued properties, such as a strong solid-loading capacity, a low glass transition temperature (Tg), good ageing resilience, and robust elongation capacity. Therefore, it has been widely adopted as a binder material in applications ranging from rocket fuel to waterproof coatings and from membranes to adhesives and sealants.1–6 Further, HTPB has considerable capacity for both isomeric variation and microstructural control. Its consequent ability to exhibit a spectrum of macroscopic behaviours has led to HTPB attracting significant previous study,2,7,8 which confirm that it offers a plethora of opportunities for further development.HTPB is a telechelic,9 relatively viscous, liquid polymer usually produced from 1,3-butadiene (Fig. 1a) with low molecular weight (1200 to 3000 Da). Through its hydroxyl end groups and double bonds, both in main chain and as pendant groups (Fig. 1b), HTPB can also be further modified by, e.g., substitution of functional groups10 such as epoxy, urethane, carboxylic acids, esters etc. This capacity for functionalization provides one of the routes for HTPB-based materials suited to a wide variety of applications.1–3,111
Even in the absence of such functionalization, however, HTPB can still exhibit a range of behaviours. Its thermomechanical properties, e.g., its glass transition, are primarily dictated by its main-chain microstructure,12 comprising repeat units of the monomer 1,3 butadiene (Fig. 1a); this conjugated diene can be polymerized in three isomeric microstructures: 1,4-trans (t); 1,4-cis (c) and 1,2-vinyl (v) (Fig. 1b).13 Experimentally, these three can be distinguished using Nuclear Magnetic Resonance (NMR), Infrared (IR) and Raman Spectroscopy, thereby enabling isomeric analysis of synthesized materials.13–16 To indicate this variation, here we use the notation HTPBn_tcv to denote the relative t, c and v isomeric content of oligomers containing n monomeric units. Thus, for example, a trimer, comprising a single example of each monomeric unit, is labeled HTPB3_111 and a hexamer with the same compositional ratios, is labelled HTPB6_111. For systems with tcv = 901, an additional label is used to distinguish isotactic (ISO) oligomers from syndiotactic oligomers (SYN).17
Conventionally, HTPB is prepared by free radical or anionic polymerization of 1,3 butadiene.2 Of these, anionic polymerization is reported as the preferred mechanism for synthesizing HTPB with well-defined microstructure and controlled molecular weight.2,18,19 Importantly, this approach also provides versatility for generating polymers with different end groups, as determined by the initiating, and terminating species.20 Polymerization conditions influence the resultant microstructure, molecular weight, and molecular weight distribution.2
Alkyllithium compounds have been widely used as initiators for the anionic polymerization of HTPB with high content of 1,4-cis groups.13,19–23 Two types of initiator can be used: (i) dilithium initiators creating a propagating species with two active centres;9,24 or (ii) functionalized initiators with a protective group such as t-alkoxy or t-butyldimethylsiloxy which is easily removed, giving a free hydroxyl group.13,18,25–27 The kinetics and stereochemistry of this polymerization process are strongly contingent on the aggregate states of the initiator and of the propagating species in the polymerization media.28 These aggregate states are themselves dependent on the structure of the chosen alkyllithium compound28 and the polarity of the solvent.13,22 Temperature can be used to control aggregate equilibria and, so, modify the relative occurrence of 1,4 and 1,2 insertions in the main chain.20,21
Historically, the investigation and development of binder materials has been achieved through the costly and time-consuming combination of chemical synthesis and analysis.2,18,26,29–36 Whilst effective for honing specific material systems, this approach has not directly addressed more general questions such as: what, at a molecular scale, characterizes a “good” binder? Further, it has systemically limited both the transferability of understanding between systems, and the consideration of design principles with which to guide the development of future binder materials.
Computer modelling is now routinely employed in contexts such as drug design and specialty chemicals to, e.g., screen candidate components for new product formulations. Molecular simulation is also increasingly used to investigate polymer systems, with coarse-grained and atomistic model types being developed to study numerous static and dynamic behaviours.37–40 The onset of glassiness in simulated polymeric systems is most straightforwardly identified from density-temperature plots – the glass transition is associated with a clear gradient change,41 though within this it is often necessary to consider both hysteresis and the effect of cooling/heating rate. The onset of glassy behaviour can also be characterized by dynamic observables such as the torsional autocorrelation function of polymer backbones.42 A further, and independent, dynamic measure of the onset of glassy behaviour is via polymer chain diffusion.43 For HTPB and related systems, coarse grained DPD models have been developed to investigate their behaviour in blends44 and long-time-scale properties such as entanglement and rheology.45 All-atom molecular dynamics (MD) simulation, alternatively, has been used to investigate both the glass transition46 and deformation and failure mechanisms47 of cis-1,4-polybutadiene systems.
In this paper, we present an integrated simulation, synthesis, and characterization study of HTPB systems. Within this, understanding gained from simulation is used to identify specific HTPB microstructures as targets for synthesis. Equivalently, microstructures obtained under alternative synthesis conditions are interrogated by simulation, leading to a molecular scale understanding of their observed macroscopic properties. Using this combination of approaches, optimal HTPB microstructures for binder applications are determined and transferrable mechanistic understanding into the key molecular mechanisms influencing Tg are identified. More generally, this integrated use of simulation and synthesis to identify specific microstructures with predicted glass transition and associated failure to external forces, provides an effective demonstration of a design process incorporating efficient screening of candidate binder systems. Indeed, it indicates exciting opportunities for systematic and efficient development of end-use-specified polymers with very different chemistries.
2. Experimental
2.1 Simulation methodology
Classical MD simulation has been utilised to study the thermomechanical and dynamical properties of a series of HTPB oligomers. This has been achieved by using the parallel MD package DL_POLY to perform cooling sequences in the Nose–Hoover Isothermal–Isobaric (constant NPT) ensemble with periodic boundary conditions.48 In such simulations, while the number of molecules (N), pressure (P) and temperature (T) are held fixed, the system density is free to self-adjust.Inter- and intra-molecular interactions have been described using the general-purpose Dreiding forcefield,49 with all atoms considered explicitly. This force field describes intramolecular structures through the Morse type bond stretching potentials, harmonic cosine angle bending and dihedral torsion terms, respectively. To represent intermolecular interactions, the 12–6 Lennard Jones potential has been utilised to represent the van der Waals interactions. Coulombic forces have also been considered; all partial charges used within this study being derived through the AM1-BCC method with the antechamber application of the AMBER package.50,51
For each selected oligomeric composition and length, an initial molecular structure has been constructed in Discovery Studio52 and its structure optimised from a Dreiding-like force-field. Packmol53 was then utilised to insert multiple copies of that HTPB oligomer into a low-density simulation cell whilst avoiding overlaps or non-physical entanglements. The system sizes were 70 molecules for pentamers (3780 atoms) and decamers (7280 atoms for HTPB 10_311 and 401 systems, 8330 atoms for HTPB10_109_ISO and SYN systems), and 120 molecules for eicosomers (24![[thin space (1/6-em)]](https://www.rsc.org/images/entities/char_2009.gif) 480 atoms). Each resultant starting configuration was then annealed from 800 K to 300 K with a 100 K decrement, though for the syndiotactic HTPB10_109_SYN system, a rapid annealing limit of 340 K was found necessary to achieve consistency between cooling and heating sequences. All simulations were carried out for 500
480 atoms). Each resultant starting configuration was then annealed from 800 K to 300 K with a 100 K decrement, though for the syndiotactic HTPB10_109_SYN system, a rapid annealing limit of 340 K was found necessary to achieve consistency between cooling and heating sequences. All simulations were carried out for 500![[thin space (1/6-em)]](https://www.rsc.org/images/entities/char_2009.gif) 000 MD timesteps, with a step of 0.001 pico seconds (i.e. a total run-time corresponding to 0.5 ns). Further 0.5 ns runs were then performed at each temperature in a gentler cooling down to 120 K with a 10 K decrement (i.e. a cooling rate of 0.02 K ps−1). In these simulations, the first 250
000 MD timesteps, with a step of 0.001 pico seconds (i.e. a total run-time corresponding to 0.5 ns). Further 0.5 ns runs were then performed at each temperature in a gentler cooling down to 120 K with a 10 K decrement (i.e. a cooling rate of 0.02 K ps−1). In these simulations, the first 250![[thin space (1/6-em)]](https://www.rsc.org/images/entities/char_2009.gif) 000 timesteps were used as equilibration, data then being accumulated over the remainder of each run. In addition to system-wide observables such as the specific volume, molecular shape characteristics and torsional bond rotations were determined for each production run. Reproducibility was assessed by both repeating some simulation sets with alternative system sizes and performing heating sequences from 120 K to 300 K and checking for consistency with cooling sequences. Where consistency was not apparent, repeat cooling and heating sequences were undertaken until agreement was achieved.
000 timesteps were used as equilibration, data then being accumulated over the remainder of each run. In addition to system-wide observables such as the specific volume, molecular shape characteristics and torsional bond rotations were determined for each production run. Reproducibility was assessed by both repeating some simulation sets with alternative system sizes and performing heating sequences from 120 K to 300 K and checking for consistency with cooling sequences. Where consistency was not apparent, repeat cooling and heating sequences were undertaken until agreement was achieved.
2.2 Synthesis of HTPB oligomers
3. Results and discussion
To reflect the process by which this project was developed, this section is divided into three main subsections. MD simulations of HTPB oligomers with 20% vinyl loading are discussed in subsection 3.1, while subsection 3.2 reports on the synthesis and characterization of HTPB oligomers with a range of microstructures. This includes validation of the simulations reported in 3.1 and motivates further MD simulations of additional HTPB microstructures which are then reported in subsection 3.3. Due to the multidisciplinary nature of this work, glass transition temperatures (Tg) are reported in both Celsius (°C) Kelvin (K), reflecting the differing conventions in synthesis and simulation.3.1 MD simulations of HTPB systems with vinyl loading of 20%
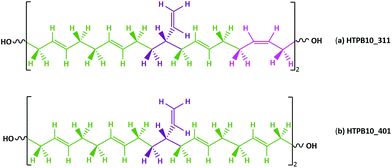
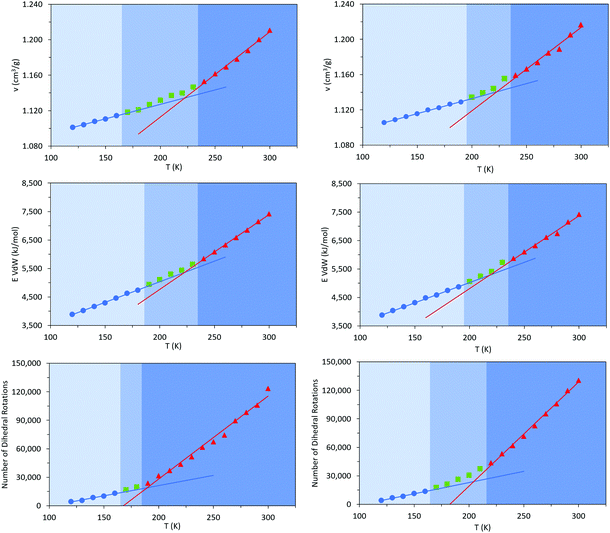
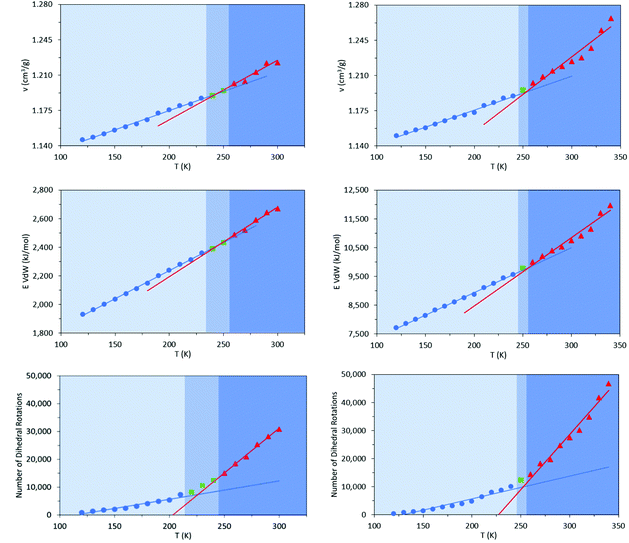
Commercially available HTPB (R45 M from Cray Valley) comprises oligomers of 50 randomly ordered t-, c- and v- repeat units at loadings of 56%, 24% and 20%, respectively. This material has a reported Tg of 197 K (−76 °C).7,55 To investigate the molecular behaviours underpinning this low glass transition temperature material, initial MD simulations were conducted on model systems containing sequences tcv = 311 and 401 (HTPB10_311 and HTPB10_401 respectively), of 5, 10 (Fig. 2) and 20 monomeric units.The aim of these initial simulations was to gain insights into the influence of the length and molecular architecture on bulk behaviour of the 20% vinyl HTPB oligomers. The results of the simulated HTPB10_311 and HTPB10_401 systems are summarized in Fig. 3 through plots of specific volume, van der Waals energy and number of dihedral rotations against temperature, while the associated Tg are compiled in Table 1. The approach used to characterize rotations was to monitor time series of the dihedral angles and record a rotation each time there was a change in the angle, above a threshold of 60°, between saved configurations of 2000 time steps. All plots take a bilinear form, Tg being given by the intersections of the pairs of trend lines (Fig. 3). For both materials, the Tg estimates from system-wide volume and van der Waals measurements are tightly clustered at 221 K (−52 °C), 217 K (−54 °C), 223 K (−50 °C) and 218 K (−55 °C), i.e., they are shifted by 20–30 K above the 197 K (−76 °C) reported for the Tg of commercial HTPB. In comparison, when only intramolecular behaviour is considered by main-chain rotations, the simulations give a much closer match with experiment values at 191 K (−82 °C) and 204 K (−69 °C). While Tg estimates determined from bilinear fits are inevitably sensitive to the set of fitting points considered, significant differences are nevertheless apparent between the crossover regions identified from rotations and those from either volumes or van der Waals energies. Simulations performed with shorter oligomers (HTPB5_311 and HTPB5_401) give significantly lower Tg values of 168 K (−105 °C) and 170 K (−103 °C) based on specific volume measures, whereas that obtained using longer HTPB20_311 oligomers are in line with the decamer results (215 K, −58 °C). These results suggest that the key degree of freedom associated with the experimental glass transition is (a) related to dihedral rotations and (b) accessible to decamer and eicosomer systems but not to pentamers. They also indicate that the thermomechanical properties of tcv = 311 and 401 are indistinguishable at the resolution accessible to molecular simulation.
| Simulated HTPB oligomer | T g in K (°C) | ||||
|---|---|---|---|---|---|
| Number of units | System ID | Number of molecules | Specific Volume | vdW Energy | Dihedral Rotations |
| Pentamer | HTPB 5 _311 | 70 | 168 (−105) | — | — |
| Pentamer | HTPB 5 _401 | 70 | 170 (−103) | — | — |
| Decamer | HTPB 10_311 | 70 | 221 (−52) | 218 (−55) | 191 (−82) |
| Decamer | HTPB 10 _401 | 70 | 223 (−50) | 218 (−55) | 204 (−69) |
| Eicosamer | HTPB 20_311 | 120 | 215 (−58) | — | — |
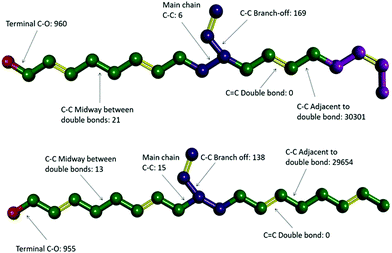
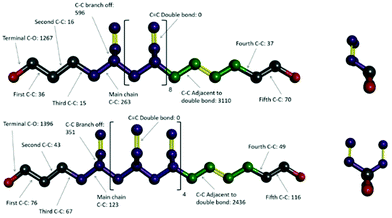
Video animations of the simulated systems, such as those provided in ESI, (ESI, Video S1†) confirmed that, even at room temperature, molecular translation was fully arrested for all systems simulated.56 They also showed dihedral rotation to be the dominant degree of freedom for temperatures at and above the experimental Tg. To characterize these in more detail, dihedral rotations associated with different classes of location in HTPB10_311 and HTPB10_401 were enumerated. Thus, the numbers of rotations counted for each type of dihedral, averaged over all molecules during the production periods of the 200 K simulations are shown schematically in Fig. 4. Here, double bonds are highlighted in yellow and hydrogen atoms are removed for clarity.
For both systems, these data show that an overwhelming proportion of the rotations observed (>96% for both systems) take place around the single C–C bonds that are adjacent to double bonds within the main chain. The single bonds midway between the double bonds, on the other hand, rotate very rarely (<1% of rotations), even though they are not intrinsically constrained by a strong intramolecular potential. Whilst the precise number of rotations counted by this analysis is dependent on the threshold angle chosen, the above pattern of behaviour persists across a broad range of threshold values.
The key mechanism by which the key dihedrals remain active degrees of freedom at low temperatures is by “crankshaft” moves wherein two close dihedrals flip in concert. This allows a short section of the main chain to move, whilst the remainder of the molecule remains locked in place. The bulky side v groups appear to provide the necessary localized pockets of free volume needed to enable such moves. Also, a v-loading of 20% proves sufficient to enable pairs of dihedral rotations to occur cooperatively, an essential feature of crankshaft moves. Since pentamer systems only contain one v-group per molecule, they are not able to undertake cooperative crankshaft moves of mid-chain sections.
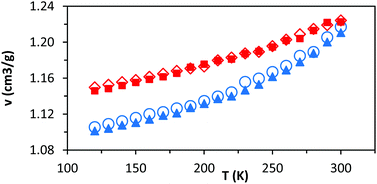
As noted above, these simulations indicate that changing the relative loading of t and c groups has little effect at either a molecular or a system-wide level. As well as the specific volume, van der Waals energies, and main chain dihedral rotations, other common observables (such as radius of gyration and mean end-to-end distance) show very little dependence on either temperature or the relative loading of t and c groups (ESI, Table S1†). While a small but consistent density difference is observed between HTPB10_311 and HTPB10_401 (Fig. 5, red triangles, and blue circles respectively) across the temperature range studied, this does not appear to significantly influence other behaviours.
Equipped with the mechanistic understanding provided by these simulations, a subsequent programme of synthesis and characterization was undertaken, targeting short and not commercially available HTPB systems with a range of v-loadings. The aim of this was to examine simulation predictions that Tg should be relatively insensitive to chain length (since the key mechanism requires chains of at least 10 repeat units), and to determine the optimal level for v-loading for specific applications requiring low Tg.
3.2 Synthesis of targeted HTPB oligomers
Anionic polymerization was used to synthesize HTPB materials with well-defined microstructure and controlled molecular weight (ESI, Fig. S7†).2,18,19 HTPB oligomers were prepared from 1,3 butadiene monomers in toluene (20 and 15 wt%), hexane (15 wt%) and THF (13 wt%) solution, at variable temperature, using tert-butyldimethylsiloxy n-propillithium initiator (TBDMSPLi).18 Ethylene oxide in THF and methanol in excess were used to quench the polymerization reaction, giving a hydroxyl group at the living chain end while the second OH was protected by TBDMSP (MHTPB samples).The MHTPB oligomers were obtained with a variety of randomly ordered t, c and v monomeric units. The TBDMSP group was then removed using tetrabutylammonium fluoride solution in THF and the resultant HTPB samples were purified by precipitation in methanol or methanol and water, depending on the solubility of the oligomer (HTPB samples). The synthesized samples were structurally slightly different from the commercially available R45 M (Fig. 2, two terminal OH groups directly attached to the repeating units of the unsaturated backbone), having two different terminal OH groups separated from the main HTPB backbone by propylene and ethylene groups from the TBDSP protecting group and the ethylene oxide quencher, respectively (ESI, Fig. S8†).
A variety of initiator concentrations (3.5, 7, 10, 15 and 30 wt%) were used to make oligomeric chains of different lengths from 1,3-butadiene in toluene (20 wt%) solution (ESI, Table S2). Subsequently, three sets of experiments were performed with 10 wt% of TBDMSPLi in toluene (15 wt%), hexane (15 wt%) and THF (13 wt%) solvents at a range of temperatures (10, 25, 35, 45, 55, 75 and 85 °C) to examine the effect of the non-polar and polar solvents and temperature on the t![[thin space (1/6-em)]](https://www.rsc.org/images/entities/char_2009.gif) :
:![[thin space (1/6-em)]](https://www.rsc.org/images/entities/char_2009.gif) c
c![[thin space (1/6-em)]](https://www.rsc.org/images/entities/char_2009.gif) :
:![[thin space (1/6-em)]](https://www.rsc.org/images/entities/char_2009.gif) v ratio of the resultant HTPB oligomers. 1H NMR was then used to characterize the average chain lengths and microstructures of the synthesized MHTPB and corresponding HTPB oligomers57–61 (Table 2 and ESI, Table S2†).
v ratio of the resultant HTPB oligomers. 1H NMR was then used to characterize the average chain lengths and microstructures of the synthesized MHTPB and corresponding HTPB oligomers57–61 (Table 2 and ESI, Table S2†).
| Polymerisation conditionsa | HTPB Microstructureb | T g °C (K) | |||||
|---|---|---|---|---|---|---|---|
| Initiator % mol | Solvent | T (°C) | No of repeat units | t units % | c units % | v units % | |
| a From 1,3-butadiene in hexane (15 wt%), toluene (20%) and THF (13 wt%). Ending CH2CH2OH and CH2CH2CH2OH groups. b From 1H NMR. c From DSC, heating/cooling rate 10 °C min−1. d From 1,3-butadiene in toluene 15 wt%. e Longer oligomers from aged initiator. | |||||||
| 30 | Toluene | 25 | 5 | 50 | 10 | 40 | −79 (194) |
| 15 | 25 | 10 | 52 | 18 | 30 | −81 (192) | |
| 10 | 25 | 14e | 48 | 19 | 33 | −77 (196) | |
| 10 | 45d | 14e | 51 | 23 | 26 | −84 (189) | |
| 10 | Hexane | 25 | 17e | 47 | 19 | 34 | −74 (199) |
| 10 | 45 | 17e | 51 | 23 | 26 | −80 (193) | |
| 10 | THF | 25 | 10 | 6 | 0 | 94 | −25 (248) |
| 10 | 45 | 10 | 6 | 0 | 94 | −27 (246) | |
| 7 | Toluene | 25 | 19 | 51 | 22 | 27 | −82 (192) |
| 3.5 | 25 | 80 | 52 | 22 | 26 | −86 (187) | |
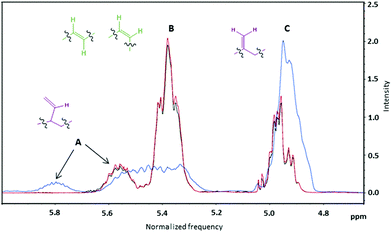
All 1H NMR spectra recorded in CDCl3 were characterized by the typical absorptions of (i) methine protons of the polymeric chain at 5.30–5.90 ppm, (ii) methylene vinyl protons at 4.80–5.10 ppm, (iii) methylene protons adjacent to c, t and v hydroxyl groups at 3.50–4.20 ppm, (iv) methine and methylene chain protons at 1.20–2.20 ppm and (v) two sharp singlet signals at 0.05 ppm and 0.90 ppm, assigned to the six and nine methyl hydrogen atoms of the protecting group (ESI, Fig. S1–S4†). Peaks A and C shown in Fig. 6 correspond to v groups and should always be present at a ratio of 1![[thin space (1/6-em)]](https://www.rsc.org/images/entities/char_2009.gif) :
:![[thin space (1/6-em)]](https://www.rsc.org/images/entities/char_2009.gif) 2. Peak B corresponds to combined signals from both t and c groups. The ratio of the integrals of the B and C peaks affords the ratio of (t + c)
2. Peak B corresponds to combined signals from both t and c groups. The ratio of the integrals of the B and C peaks affords the ratio of (t + c)![[thin space (1/6-em)]](https://www.rsc.org/images/entities/char_2009.gif) :
:![[thin space (1/6-em)]](https://www.rsc.org/images/entities/char_2009.gif) v groups.
v groups.
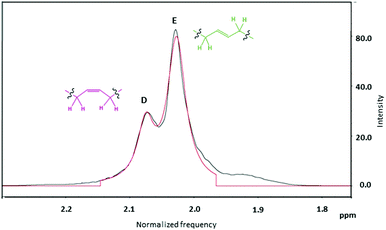
Further analysis of the 1H NMR integrals for the peaks attributed to methylene protons adjacent to the c and t linkages (Fig. 7, D and E peaks respectively) was used to elucidate the ratio of t![[thin space (1/6-em)]](https://www.rsc.org/images/entities/char_2009.gif) :
:![[thin space (1/6-em)]](https://www.rsc.org/images/entities/char_2009.gif) c linkages.62 The sum of the number of protons from peak B in Fig. 6 and the number of protons from peaks A and C, calibrated by the silyl-group signals (0.05 ppm), then provided the total average chain length (Table 1 and ESI, Table S2†).
c linkages.62 The sum of the number of protons from peak B in Fig. 6 and the number of protons from peaks A and C, calibrated by the silyl-group signals (0.05 ppm), then provided the total average chain length (Table 1 and ESI, Table S2†).
The MHTPB samples converted into their HTPB analogues,18 retained the same microstructure after purification (ESI, Table S2†). Two new signals at 1.5 ppm (O![[H with combining low line]](https://www.rsc.org/images/entities/char_0048_0332.gif) ) and 3.6 (CH2O
) and 3.6 (CH2O![[H with combining low line]](https://www.rsc.org/images/entities/char_0048_0332.gif) ) ppm appeared in the spectra after removal of the OH protection. An average molecular weight was then attributed to the deprotected HTPB by subtracting 114 Da from those determined for the MHTPB precursors.
) ppm appeared in the spectra after removal of the OH protection. An average molecular weight was then attributed to the deprotected HTPB by subtracting 114 Da from those determined for the MHTPB precursors.
The initiator concentration influenced the resultant polymeric chains in two ways: (i) the molecular weight of the oligomers was inversely proportional to the concentration of the initiator (ESI, Fig. S9†). And (ii) the initiator controlled the competing monomer addition mechanisms. More concentrated polymerization solutions, with higher amounts of initiator, achieved increased insertion of v units and reduced insertion of c units.63
The t, c and v contents of MHTPB samples polymerized in toluene at temperatures between 10 °C and 85 °C using TBDMSPLi 10% w/w and their HTPB analogues, show a marked trend (ESI, Table S2†). Thus, the proportion of v units decreases from 37% to 18% across this temperature range, whilst c and t units increase fairly evenly from an aggregate of 63% to 82% (Fig. 8). A similar effect is observed for the microstructure of oligomers synthesized in hexane, although this could only be attempted below 45 °C due to the low boiling point of the solvents (Table 2). Assuming that the binding energies of the aggregate species of the TBDMSPLi initiator and the butyllithium initiator are similar in toluene and hexane, these observations suggest that higher temperatures favour formation of dimeric and monomeric species and, so, promotes 1,4 insertions.28
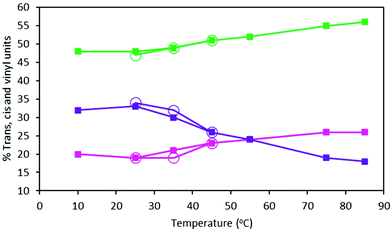 | ||
| Fig. 8 Percentage content of t (green lines), c (pink lines) and v (purple lines) groups of HTPB made from 15% 1,3-butadiene (w) in toluene (filled squares) and 15% 1,3-butadiene (w) in hexane (open circles) samples at different polymerisation temperatures (ESI, Table S3†). | ||
When the polar solvent THF was used for the polymerization, the MHTPB and consequently the HTPB microstructure changed markedly to 10% t and 90% v.
The addition of the initiator (TBDMSPLi 10% w/w) in the THF solution of the monomer was performed at 0 °C and the rate of anionic polymerization was very fast64 for these systems. Thus, the set-up temperature at 25 °C and 45 °C may have been irrelevant here, given the likelihood of significant polymerization taking place before it was reached. The analysis of the integrals of the corresponding 1H NMR spectra showed that for the synthesized material was made up of decameric oligomers.
A proposed chemical structure for these MHTPB10_109 and HTPB10_109 samples synthesized in THF at 25 °C is given in Fig. 9. Here, the hydrogens bonded to a specific numbered carbon are labelled as Hn, where n is the number of the carbon atom. The peaks between 1.8 ppm and 2.0 ppm are attributed to the methylene H16 and H19 protons adjacent to the 1,4-trans unit. The two groups are not equivalent; protons H16 are in the α position with the π bond of the trans unit and in the β position with the π bond of the adjacent vinyl group, whereas the protons H19 whilst also being in the α position with the π bond of the trans group, have no contribution from the π bond in β. Even though H19 has a hydroxyl in the γ position, these hydrogens are slightly more shielded than H16. The measured ratio for the integrals of the two aforementioned regions is 2.12, in fair agreement with the expected ratio of 2.25 for the 9 hydrogens in the region 2.1 ppm to 2.2 ppm, compared to the 4 hydrogens in the region 1.80 ppm to 2.1 ppm. The shapes of the 1H NMR peaks in the region from 1.0 ppm to 1.6 ppm and 5.4 ppm to 5.6 ppm appear to match with the methylene and methane resonances observed for isotactic and syndiotactic polypropylene and isotactic and syndiotactic polystyrene.20,65–67 A detailed investigation of HTPB iso or syndio tacticity using the 1H NMR data is not included in this paper.
3.3 Thermal analysis – effect of microstructure on Tg
All synthesized MHTPB and HTPB oligomers were thermally characterized using DSC technique and their Tg determined from their corresponding thermograms. For materials made in non-polar polymerization solvents, a linear trend in Tg was obtained as a function of v-loading for loadings of between 18% and 34%, as shown in Fig. 10. This trend was found to be independent of solvent choice (toluene or hexane) or oligomer length, provided that there were at least 10 repeat units present. The values of Tg increased up to 10 °C on removal of the bulky silyl protecting group (ESI, Table S2† and Fig. S10–S24†).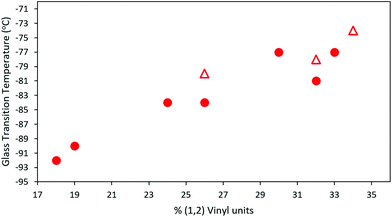 | ||
| Fig. 10 T g of HTPB samples synthesized from 1,3-butadiene 15% solution in toluene (red rounds) and 15% in hexane (red triangles), plotted as a function of their vinyl content. For all samples 10% mol of initiator was used in the synthesis (ESI, Table S3†). | ||
However, significantly higher average Tg values were obtained for MHTPB10_109 (241 K, −32 °C) and HTPB10_109 samples (248 K, −25 °C) made in THF. This suggests that the mechanisms underlying the onset of glassiness in HTPB with v-content of 19%–34% are not accessible when v-content is increased to 90%. The higher Tg values for MHTPB10_109 and HTPB10_109 samples can be extrapolated by linear fit in Fig. 10 but are not experimentally achievable under the adopted synthetic conditions.
3.4 Simulations of HTPB_109 systems
To investigate that suggested qualitative difference in the nature of the glass transition for HTPB with very high v-content, further sets of MD simulations were undertaken. These investigated the behaviours of decamers of isotactic (HTPB10_109_ISO) and syndiotactic microstructures (HTPB10_109_SYN), as depicted in Fig. 11. As set out in section 2.1, series of simulations were conducted on each of these systems to probe their respective thermomechanical behaviours. Again, from visualisations and mobility analysis, molecular translation was minimal, with oligomer centres of mass effectively locked in place well above 300 K.As with the 20% vinyl systems, Tg was then determined for the isotactic and syndiotactic and from bi-linear fits to the T-dependence of their specific volume, van der Waals energies and dihedral rotation numbers (Fig. 12). These plots show three clear differences from those presented in Fig. 3 for HTPB10_311 and HTPB10_401. Firstly, the gradient changes are much less marked, particularly for the volume and van der Waals measures. This is primarily because the temperature gradients of these quantities above Tg is substantially shallower than is the case for the 20% vinyl systems. One consequence of this is that, as illustrated in Fig. 5, the densities of the two HTPB10_109 systems are predicted to diverge from those with the lower vinyl content whilst still in the melt phase. While the small gradient changes observed introduces greater systematic uncertainty to the bilinear plots in which Fig. 12, five if the six Tg estimates sit within 10 K of one another. These values are 254 K (−19 °C), 245 K (−28 °C) and 225 K (−48 °C) for HTPB10_109_ISO and 258 K (−15 °C), 257 K (−16 °C) and 252 K (−18 °C) for HTPB10_109_SYN. The main difference from the 20% vinyl systems is that both HTPB10_109 materials exhibit far fewer dihedral rotations – 10![[thin space (1/6-em)]](https://www.rsc.org/images/entities/char_2009.gif) 000 to 15
000 to 15![[thin space (1/6-em)]](https://www.rsc.org/images/entities/char_2009.gif) 000, compared with ∼70
000, compared with ∼70![[thin space (1/6-em)]](https://www.rsc.org/images/entities/char_2009.gif) 000 for equivalent run lengths at 250 K, for example. When these rotations are associated with the various bond identities available to these microstructures (see labels in Fig. 11), the big change is at the C–C bond adjacent to the double bond – at 200 K, for example, this only accounts for 50–60% of the flips observed, compared with the >96% noted for the systems analysed in section 3.1.
000 for equivalent run lengths at 250 K, for example. When these rotations are associated with the various bond identities available to these microstructures (see labels in Fig. 11), the big change is at the C–C bond adjacent to the double bond – at 200 K, for example, this only accounts for 50–60% of the flips observed, compared with the >96% noted for the systems analysed in section 3.1.
Like experiment, therefore, MD simulation finds a shift of order 70 K between the Tg values of HTPB with v-loadings of 20% and 90%. Additionally, for the simulations for these systems, the specific volume and van der Waals measures are now in reasonable agreement with the experimental 248 K (−25 °C), a slightly closer match being achieved by the isotactic variant. However, cooperative crank-shaft type dihedral flips of section of the oligomer main chain are substantially reduced.
4 Conclusions
We have demonstrated that enhanced levels of control can be exerted on the microstructure of HTPB and examined the consequences these have for its macroscopic, thermomechanical behaviours. In terms of synthetic control, we have determined the appropriate combination of initiator, temperature and solvent required to dial in the relative content of t, c and v monomeric units. We have shown that, when TBDMSPLi initiator was used, the v-content increases from 18% to >90% when the polymerization solvent is switched from non-polar to polar. Further, in non-polar solvents, the v-content increases from 18% to 40% with decreasing polymerization temperature.The range of HTPB isomers obtained from this matrix of polymerization conditions shows remarkable variation in macroscopic properties. A 70 °C spread in Tg values is observed by DSC on variation of the t, c and v content ratios determined by 1H NMR spectroscopy. The lowest Tg obtained here, −92 °C, is a full 15 °C lower than that of commercially available HTPB (R45 M). For fixed t, c and v content, however, Tg shows little chain-length dependence down to about ten repeat units. These observations indicate that intramolecular degrees of freedom have a dominant effect in controlling the onset of glassy behaviour.
By integrating our synthesis and characterisation programme with MD simulations, we both validate our experimental observations and identify the molecular mechanisms responsible. For all simulated systems, molecular diffusion and reptation drop to immeasurably small levels at temperatures well above Tg. Rather, the onset of glassy behaviour in different HTPB systems is controlled by main-chain rotation, particularly crank-shaft moves of distinct sub-regions involving synchronised flips of pairs of single carbon–carbon bonds. The ability of a given HTPB isomer to exhibit these main-chain rotations is intimately related to its v content – in simulations, we observe an order of magnitude increase in the frequency of these rotations as v is reduced from 90% to 20%. The Tg values for high v-content materials, which are exceptionally high for HTPB (−25 °C), can be reconciled with their aliphatic backbones with pendant side-group structures.
Overall, our combined use of simulation and experiment provides a powerful synergy for gaining a more complete understanding of HTPB systems. Through this, as well as obtaining a wide variety of HTPB microstructures by controlling synthesis conditions, we have determined key molecular-scale insights into their observed macroscopic properties. This has led us to adopt a design and develop approach through which, for example, it was possible to actively direct the choice of anionic polymerization conditions and, so, target specific HTPB microstructures with distinct thermomechanical behaviours. In addition, the generic mechanistic understanding we have gained here into what constitutes a “good binder” material is now readily transferrable to the potential identification of future candidate systems with very different chemistries.
Author contributions
The manuscript was written through contributions of all authors. All authors have given approval to the final version of the manuscript.Conflicts of interest
The authors declare no conflict of interest.Acknowledgements
This research was funded in part by the UK Weapons Science and Technology Centre (WSTC) through the UK Defence Science and Technology Laboratory (DSTL). Cranfield University supported the experimental part via an MSc project and Sheffield-Hallam University further developed the simulations though a PhD project. The authors would like to thank Dr Peter Gould from Qinetiq, UK, for the consultations in support to the modelling development.References
- H. G. Ang and S. Pisharath, in Energetic Polymers: Binders and Plasticizers for Enhancing Performance, Wiley-VCH Verlag & Co, Weinheim, Germany, 2012 Search PubMed.
- Q. Zhou, S. Jie and B.-G. Li, Ind. Eng. Chem. Res., 2014, 53(46), 17884–17893, DOI:10.1021/ie503652g.
- ReportLinker, https://www.reportlinker.com/p05439208/HTPB-Market-by-Application-by-End-Use-And-Region-Global-Forecast-to.html, (assessed March 2020).
- C. Dennis and B. Bojko, Fuel, 2019, 254, 115646, DOI:10.1016/j.fuel.2019.115646.
- N. Akram, K. M. Zia, M. Saeed, A. Mansha and W. G. Khan, J. Polym. Res., 2018, 25, 194, DOI:10.1007/s10965-018-1591-6.
- S. Busman, S. Pillalamarri, T. Tran and C. Campbell, US 2013/0011683 A1, 2013.
- E. Dossi, J. Akhavan, R. G. Williams, W. J. Doe and S. E. Gaulter, Propellants, Explos., Pyrotech., 2018, 43, 241, DOI:10.1002/prep.201700220.
- A. G. Ajaz, Rubber Chem. Technol., 1995, 68, 481, DOI:10.5254/1.3538752.
- Y. Yagci, O. Nuyken and V. Graubner, Telechelic Polymers, in Encyclopedia of Polymer Science and Technology, 2004, DOI:10.1002/0471440264.pst499.
- P. S. G. Krishnan, K. Ayyaswamy and S. K. Nayak, J. Macromol. Sci., 2013, 50, 128, DOI:10.1080/10601325.2013.736275.
- R. M. Shankar, T. K. Roy and T. Jana, J. Appl. Polym. Sci., 2009, 114, 732, DOI:10.1002/app.30665.
- Z. Cao, Q. Zhou, S. Jie and B. Li, Ind. Eng. Chem. Res., 2016, 55, 1582, DOI:10.1021/acs.iecr.5b04921.
- H. L. Hsieh and R. P. Quirk, in Anionic polymerization: principles and practical applications, Marcel Dekker, CRC Press, New York, 1996, ISBN 9780585139401 Search PubMed.
- A. K. Mahanta and D. D. Pathak, HTPB-Polyurethane: A Versatile Fuel Binder for Composite Solid Propellant, ed. F. Zafar and E. Sharmin, IntechOpen, 2012, vol. 229, DOI:10.5772/47995. (accessed July 2018).
- G. M. M. Sadeghi, M. Barikani, J. Morshedian and F. A. Taromi, Iran. Polym. J., 2003, 12, 515 CAS , https://www.researchgate.net/publication/237813134 (accessed May 2018).
- W. D. Vilar, S. M. C. Menezes and L. Akcelrud, Polym. Bull., 1995, 35, 481, DOI:10.1007/BF00297615.
- R. J. Ouellette and J. D. Rawn, in Organic Chemistry: Structure, Mechanism, Synthesis, Second Edition, Elsevier Inc., 2019, ISBN 978-0-12-812838-1, DOI:10.1016/C2016-0-04004-4.
- J. Chen, Z. Lu, G. Pan, Y. Qi, J. Yi, J. Bai and H. Bai, Chin. J. Polym. Sci., 2010, 28, 715, DOI:10.1007/s10118-010-9121-y.
- R. P. Quirk, Anionic Polymerization, In Encyclopedia of Polymer Science and Technology, 4th edn, John Wiley & Sons, Inc, 2002, DOI:10.1002/0471440264.pst019.
- R. B. Grubbs and R. H. Grubbs, Macromolecules, 2017, 50, 6979, DOI:10.1021/acs.macromol.7b01440.
- J. J. Benvenuta-Tapia, J. A. Tenorio-López, R. Herrera-Nájera and L. Ríos-Guerrero, Polym. Eng. Sci., 2009, 49, 1, DOI:10.1002/pen.21259.
- X. Zhu, X. Fan, N. Zhao, X. Min, J. Liu and Z. Wang, RSC Adv., 2017, 7, 52712, 10.1039/c7ra11117g.
- G. M. M. Sadeghi, J. Morshedian and M. Barikani, React. Funct. Polym., 2006, 66, 255, DOI:10.1016/j.reactfunctpolym.2005.08.001.
- R. P. Quirk, S. H. Jang, H. Yang and Y. Lee, Macromol. Symp., 1998, 132, 281, DOI:10.1002/masy.19981320127.
- S. Kobayashi, Ionic Polymerization, Wiley-VCH, Weinheim, Germany, 2001, p. 165 Search PubMed.
- X. Min, X. Fan and J. U. Liu, R. Soc. Open Sci., 2018, 5, 180156, DOI:10.1098/rsos.180156 , (accessed June 2018).
- Q.-Q. Sun, Z. Lu, L. Zhang, K. Du and X. Luo, Acta Chim. Sin. Chin. Ed., 2008, 66, 117 CAS , http://en.cnki.com.cn/Article_en/CJFDTOTAL-HXXB200801021.htm, (accessed June 2018).
- R. Kozak and M. Matlengiewicz, Polym. Test., 2017, 64, 20, DOI:10.1016/j.polymertesting.2017.09.029.
- J. Rokicka and R. Ukielski, Thermoplast. Elastomers: Synth. Appl., 2015, 25, DOI:10.5772/61215.
- F. Luppi, H. Cavaye and E. Dossi, Propellants, Explos., Pyrotech., 2018, 43, 1023, DOI:10.1002/prep.201800137.
- F. Luppi, G. Kister, M. Carpenter and E. Dossi, Polym. Test., 2019, 73, 338, DOI:10.1016/j.polymertesting.2018.11.034.
- F. Luppi, N. Mai, G. Kister, P. P. Gill, S. E. Gaulter, C. Stennett and E. Dossi, Chem. – Eur. J., 2019, 25, 15646, DOI:10.1002/chem.201903945.
- H. Cavaye, F. Clegg, P. J. Gould, M. K. Ladyman, T. Temple and E. Dossi, Primary Alkylphosphine-Borane Polymers: Synthesis, Low Glass Transition Temperature, and a Predictive Capability Thereof, Macromolecules, 2017, 50, 9239–9248, DOI:10.1021/acs.macromol.7b02030.
- N. Makhiyanov and E. V. Temnikova, Glass-Transition Temperature and Microstructure of Polybutadienes, Polym. Sci., Ser. A, 2010, 52(12), 1292–1300, DOI:10.1134/S0965545X10120072.
- A. Yoshioka, K. Komuro, A. Ueda, H. Watanabe, S. Akita, T. Masuda and A. Nakajima, Structure and physical properties of high-vinyl polybutadiene rubbers and their blends, Pure Appl. Chem., 1986, 58(12), 1697–1706, DOI:10.1351/pac198658121697.
- H. Koch and W. Adamets, Microstructure regulators for customised solution rubbers, Int. Polym. Sci. Technol., 2002, 29(6), 162–166 Search PubMed.
- K. V. Gernaey and R. Gani, Chem. Eng. Sci., 2010, 65, 5757, DOI:10.1016/j.ces.2010.05.003.
- S. Chatterjee, C. M. V. Moore and M. M. Nasr, in Comprehensive Quality by Design for Pharmaceutical Product Development and Manufacture, ed. G. V. Reklaitis, C. Seymour and S. García–Munoz, 2017, Ch. 2, DOI: DOI:10.1002/9781119356189.ch2.
- E. Yang, D. Datta, J. Ding and G. Hader, Synthesis, Modelling and Characterization of 2D Materials and their Heterostructures, Elsevier 1st Edition, 2020, ISBN: 9780128184752 Search PubMed.
- A. Singh, S. Radhakrishnan, R. Vijayalakshmi, M. B. Talawar, A. Kumar and D. Kumar, J. Energ. Mater., 2019, 37, 365, DOI:10.1080/07370652.2019.1615581.
- M. Ozmaian and R. Naghdabadi, Polym. Phys., 2014, 52, 907, DOI:10.1002/polb.23508.
- G. D. Smith and O. Borodin, et al. , Macromolecules, 2001, 34, 5192, DOI:10.1021/ma002206q.
- M. Tsige and P. L. Taylor, Phys. Rev. E: Stat., Nonlinear, Soft Matter Phys., 2002, 65, 021805, DOI:10.1103/PhysRevE.65.021805.
- Y. Zhou, X.-P. Long and Q.-X. Zeng, J. Appl. Polym. Sci., 2012, 125, 1530, DOI:10.1002/app.36370.
- K. Kempfer, J. Devémy, A. Dequidt, M. Couty and P. Malfrey, Macromolecules, 2019, 52, 2736, DOI:10.1021/acs.macromol.8b02750.
- Y. Gao, Y. Wu, J. Liu and L. Zhang, J. Polym. Sci., Part B: Polym. Phys., 2017, 55, 1005, DOI:10.1002/polb.24342.
- R. S. Payala, K. Fujimotoa, C. Janga, W. Shinodaa, Y. Takeib, H. Shimab, K. Tsunodab and S. Okazakia, Polymer, 2019, 170, 113, DOI:10.1016/j.polymer.2019.03.006.
- I. T. Todorov, W. Smith, K. Trachenko and M. T. Dove, J. Mater. Chem., 2006, 16, 1911, 10.1039/b517931a.
- S. L. Mayo, B. D. Olafson and W. A. Goddard III, J. Phys. Chem., 1990, 94, 8897, DOI:10.1021/j100389a010.
- A. Jakalian, B. L. Bush, D. B. Jack and C. I. Bayly, J. Comput. Chem., 2000, 21, 132, DOI:10.1002/(SICI)1096-987X(20000130)21:2<132:AID-JCC5>3.0.CO;2-P.
- D. Case et al. , AMBER 2016, University of California, San Francisco, DOI:10.13140/RG.2.2.27958.70729.
- Dassault Systèmes BIOVIA, Discovery Studio Modelling Environment, Release 2017, San Diego, CA, 2020 Search PubMed.
- L. Martínez, R. Andrade, E. G. Birgin and J. M. Martínez, J. Comput. Chem., 2009, 30, 2157 CrossRef PubMed.
- J. Clayden, N. Greeves, S. Warren and P. Wothers, In Organic Chemistry, Oxford University Press, 2000, ISBN: 9780198503460 Search PubMed.
- HTPB R45 M, Cray Valley http://www.crayvalley.com/docs/TDS/poly-bd-r-45m.pdf (assessed April 2020).
- W. Humphrey, A. Dalke and K. Schulten, J. Mol. Graphics, 1996, 14, 33, DOI:10.1016/0263-7855(96)00018-5.
- F. Gouranlou, Asian – J. Chem., 2007, 19, 1757 CAS , ISSN: 0970-7077.
- W. D. Vilar, S. M. C. Menezes and P. R. Seidl, Polym. Bull., 1997, 38, 311, DOI:10.1007/s002890050053.
- E. R. Santee Jr., R. Chang and M. Morton, J. Polym. Sci., Polym. Lett. Ed., 1973, 11, 449, DOI:10.1002/pol.1973.130110704.
- Y. Maeda, et al. , J. Am. Chem. Soc., 2012, 134, 18101, DOI:10.1021/ja308969p.
- M. F. Herman, In Encyclopedia of Polymer Science and Technology, Wiley-Interscience, 3rd Revised edn, 2013, ISBN 978-0470073698 Search PubMed.
- Mathworks, http://www.mathworks.com/matlabcentral/fileexchange/33775-lorentzian-fit, (assessed April 2020).
- X. Min, X. Fan and J. Liu, R. Soc. Open Sci., 2018, 5(5), 180156/1–180156/10, DOI:10.1098/rsos.180156.
- D. Baskaran and A. H. E. Mϋller, In Controlled and Living Polymerizations: From Mechanisms to Applications, ed. A. H. E. Mϋller and K. Matyjaszewski, Wiley–VCH Verlag GmbH & Co, Weinheim, Germany, 2010, p. 1, ISBN 978–3527324927, DOI:10.1002/anie.200907064.
- G. Odian, In Principles of polymerization, 4th ed, Jon Wiley & Sons, New Jersey, 2004, ISBN 9780471478751, DOI:10.1002/047147875X.
- J. Zymonas, E. R. Santee and H. J. H. Harwood, Macromolecules, 1973, 6, 129, DOI:10.1021/ma60031a020.
- K. Dietrich, In Recent advances in anionic polymerization. Proceedings of the international symposium on recent advances in anionic polymerization, ed. T. E. Hogen-Esch and J. Smid, Elsevier Science Publishing Co., New York/Amsterdam/London, 1987, ISBN 0-444-01252-4, Acta Polym., 1989, 40, 1, DOI: DOI:10.1002/actp.1989.010400122.
Footnote |
| † Electronic supplementary information (ESI) available. See DOI: 10.1039/d1py00233c |
| This journal is © The Royal Society of Chemistry 2021 |


