
Size-induced amorphous structure in tungsten oxide nanoparticles†
Mikkel
Juelsholt
 a,
Andy S.
Anker
a,
Troels Lindahl
Christiansen
a,
Mads Ry Vogel
Jørgensen
bc,
Innokenty
Kantor
bd,
Daniel Risskov
Sørensen
bc and
Kirsten M. Ø.
Jensen
*a
a,
Andy S.
Anker
a,
Troels Lindahl
Christiansen
a,
Mads Ry Vogel
Jørgensen
bc,
Innokenty
Kantor
bd,
Daniel Risskov
Sørensen
bc and
Kirsten M. Ø.
Jensen
*a
aDepartment of Chemistry and Nano-Science Center, University of Copenhagen, 2100 Copenhagen Ø, Denmark. E-mail: kirsten@chem.ku.dk
bDepartment of Chemistry & iNANO, Aarhus University, 8000 Aarhus C, Denmark
cMAX IV Laboratory, Lund University, 224 84 Lund, Sweden
dDepartment of Physics, The Technical University of Denmark, 2880 Lyngby, Denmark
First published on 17th November 2021
Abstract
The properties of functional materials are intrinsically linked to their atomic structure. When going to the nanoscale, size-induced structural changes in atomic structure often occur, however these are rarely well-understood. Here, we systematically investigate the atomic structure of tungsten oxide nanoparticles as a function of the nanoparticle size and observe drastic changes when the particles are smaller than 5 nm, where the particles are amorphous. The tungsten oxide nanoparticles are synthesized by thermal decomposition of ammonium metatungstate hydrate in oleylamine and by varying the ammonium metatungstate hydrate concentration, the nanoparticle size, shape and structure can be controlled. At low concentrations, nanoparticles with a diameter of 2–4 nm form and adopt an amorphous structure that locally resembles the structure of polyoxometalate clusters. When the concentration is increased the nanoparticles become elongated and form nanocrystalline rods up to 50 nm in length. The study thus reveals a size-dependent amorphous structure when going to the nanoscale and provides further knowledge on how metal oxide crystal structures change at extreme length scales.
Introduction
For decades, nanoscientists have studied how nanosizing materials can alter and enhance their functional properties.1–7 The size-dependent properties of many materials relate to both increased surface area and changes in electronic and magnetic structure, and advances in nanomaterial synthesis mean that some nanomaterials can be precisely produced for specific applications.6,8–11 However, for many nanomaterials, the effect of nanosizing on the atomic structure is not well-understood, and the atomic structure of a nanoparticle is often assumed to be a cutout of the corresponding bulk material.8,12 Nevertheless, nanosizing can induce significant changes in atomic structure,2,13–16 and the impact of the particle size on atomic structure varies widely with material type and structure. For ZrO2 nanoparticles, for example, small particle size has been reported to lead to stabilization of the technologically important tetragonal and cubic crystal structures rather than the bulk monoclinic structure.17,18 In MoO2, nanosizing leads to defects in the rutile structure, inducing disordered shear-planes,19 and many metallic nanoparticles are known to take structures different from bulk fcc and hcp structures such as icosahedral and decahedral motifs.20–22 However, despite the massive interest in nanomaterials, very few studies have systematically investigated the size-structure relationship in nanomaterials.2 This limited knowledge can likely be attributed to the challenges of characterizing the atomic structure of nanomaterials. The small size and related atomic disorder make it difficult to extract structural information using e.g. X-ray powder diffraction (XRD) and transmission electron microscopy (TEM). However, these issues can be overcome by applying high-energy X-rays to perform Total Scattering experiments together with Pair Distribution Function analysis.2 The intuitive structural interpretation of the PDF makes it possible to characterize complicated nanostructures based on simple models.In this paper, we present a systematic investigation of size-dependent atomic structure in tungsten oxide nanoparticles. The structural chemistry of bulk tungsten oxides is very rich and diverse, which has led to a large number of applications, for example in catalysis,23–26 supercapacitors,25,27–29 optical devices25,30–33 and gas-sensors.25,34–37 Bulk tungsten oxides can be considered built from [WO6]-octahedra with W mostly in oxidation state 4+, 5+, and 6+. Two WO2 crystal structures are known: a monoclinic distorted rutile structure and a high-pressure orthorhombic structure.38,39 The phase diagram of tungsten oxides containing W5+ and W6+ is considerably more complex and at least eight different crystalline polymorphs are known for fully oxidized WO3.40–43 Six of them are based on the corner-sharing network of the cubic ReO3 structure, but due to distortions in the [WO6]-octahedra, phases form with symmetries ranging from cubic to triclinic.40,41 A monoclinic, ReO3-based WO3 structure is seen in Fig. 1A. Additionally, at least two hexagonal WO3 phases are also known, where the [WO6]-octahedra form a layered structure of hexagonal columns.40–43 Upon partial reduction of W6+ to W5+ several different WOx phases (2 < x < 3), can form such as W10O29 (WO2.9) and W18O49 (WO2.72).40,41 In general these structures form through the formation of shear-planes or bipyramidal pentagonal columns in the ReO3-type structure, as illustrated in Fig. 1B (W10O29) and Fig. 1C (W18O49).40,41 The more reduced the compound is, the more shear-planes or bipyramidal pentagonal columns are formed.40,41 Tungsten oxides also form several hydrates, such as the WO3·0.3H2O in Fig. 1D, as well as tungsten bronzes, which are tungsten oxides with intercalated cations.40,41
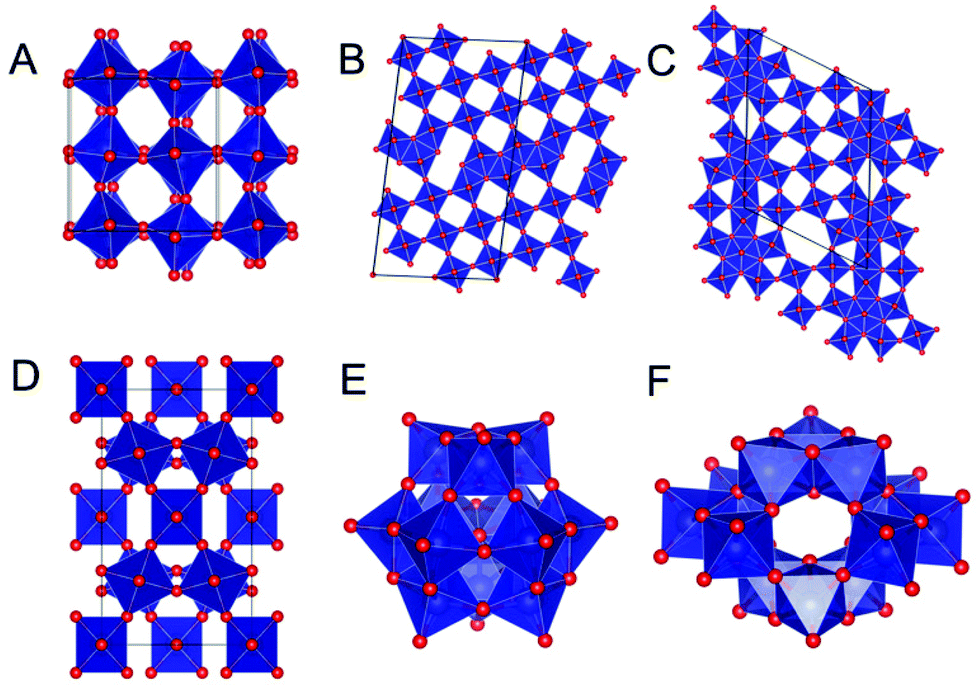 | ||
| Fig. 1 Overview of some tungsten oxide compounds. (A)–(F) show 6 examples of tungsten oxide structures. The structures are (A) monoclinic WO3, (B) W10O29, (C) W18O49, (D) WO3·0.3H2O, (E) the metatungstate ion [H2W12O40]6−, and (F) the paratungstate ion [H2W12O42]10−. W is shown in blue, O in red, and H is omitted for clarity. | ||
The complexity of solid-state tungsten oxide structures is mirrored by the structure of tungsten oxide compounds in solution. In solution, tungstates can form polyoxometalates (POMs), which are large polyanions built from corner- and edge-sharing [WO6]-octahedra. Unlike the crystalline structures, edge-sharing octahedra are also present when W is in oxidation state 6+, as seen for example in the metatungstate ion [H2W12O40]6− which adopts the well-known Keggin cluster structure as seen in Fig. 1E. It is common for POMs to contain almost equal amounts of edge-sharing and corner-sharing octahedra, as also seen for paratungstate B [H2W12O42]10− in Fig. 1F.44
The basic building block of all these compounds are corner- and edge-sharing [WO6]-octahedra. If considering their local atomic structure, they give rise to 3 basic interatomic distances, which are depicted in Fig. 2A–D. W–O distances in tungsten oxides are reported to be approximately 1.8–2.5 Å, depending on geometry and oxidation states (Fig. 2A). A W–W distance between two edge-sharing [WO6]-octahedra (Fig. 2B) or between a [WO6]-octahedron and a [WO7]-bipyramidal pentagon (Fig. 2C) is approximately 3.3 Å. In WO2, however, the distance is considerably shorter and can be between 2.5–3.1 Å.38,39 Finally, the W–W distance between two corner-sharing [WO6]-octahedra is around 3.7–3.9 Å (Fig. 2D).
 | ||
| Fig. 2 The structure sketches in (A)–(D) show the fundamental interatomic distances found in tungsten oxide compounds. The first distance (A) is the W–O bond. The second distance (B) is a W–W distance which occurs between two edge-sharing [WO6]-octahedra and (C) between a [WO6]-octahedron and a bipyramidal pentagonal column. The third distance (D) is the W–W distance between two corner-sharing [WO6]-octahedra. W is shown in blue and O in red. In (B), (C), and (D), O is omitted for clarity. (E) shows the calculated PDFs for the structures seen in Fig. 1. The vertical lines indicate the 3 fundamental distances in the tungsten oxide compounds shown in (A)–(D). | ||
Fig. 2E illustrates the calculated PDFs of the 6 structures shown in Fig. 1A–F. As can be seen, PDF is a powerful way of characterizing and distinguishing between structures of tungsten oxide compounds, both in the crystalline form and as polyoxometalate nanoclusters. The relative amount of edge-sharing [WO6]-octahedra (the peak at r = 3.3 Å) compared to corner-sharing [WO6]-octahedra (peak at r = 3.8 Å) show the differences between various POMs and crystalline tungsten oxides in a straightforward way. PDF has previously been applied for studies of amorphous and nanostructured tungsten oxides. For example, Lugovskaya et al.45 found that an amorphous tungsten oxide had a local structure similar to WO3·0.3H2O (Fig. 1D), while Jürgen et al.46 found that their sample of amorphous tungsten oxide had a structure unlike any crystalline tungsten oxides with much lower W–O coordination number and direct W–W bonding.
The diverse structural chemistry of bulk tungsten oxides is thus well known, and we here study the effects of nanoparticle size on the tungsten oxide crystal structure. Based on a synthesis method first reported by Soultanidis et al.,47 we synthesize nanomaterials with different particle sizes and use a combination of PDF analysis, TEM, and Small-Angle X-ray Scattering (SAXS) for characterization. We show that the particle size and morphology can be controlled by changing the initial precursor concentration. At lower concentrations, the synthesis yields ultra-small tungsten oxide nanoparticles with an amorphous structure whose local structure is unlike any known crystalline tungsten oxide. By increasing the concentration, the size of the nanoparticles increases, and the particles become crystalline. While amorphous nanoparticles are well known, this is the first time, to the best of our knowledge, that the amorphous structure is shown to be a direct consequence of nanoparticle size.
Results and discussion
Five samples of tungsten oxide nanoparticles were prepared by thermal decomposition of ammonium metatungstate hydrate (AMT) in oleylamine at 250 °C with varying precursor concentrations. Fig. 3A shows X-ray scattering patterns obtained from the 5 samples. The scattering patterns from the two samples prepared with the lowest precursor concentrations show only a few broad features which are consistent with very small or disordered nanoparticles. The three samples prepared with higher concentrations give rise to at least one Bragg peak and a few other broader features in their scattering patterns. To better study the structure, we turn to PDF analysis of the data. The PDFs obtained from the samples are shown in Fig. 3B. Again, we see a clear difference between the samples synthesized with low AMT concentrations (5 and 10 mM) and the samples synthesized with high AMT concentrations (15, 20, and 25 mM). In the PDFs from the lower concentration samples, clear peaks extend to only r ≈ 8 Å. As opposed to bulk tungsten oxides they appear to contain a larger amount of edge-sharing octahedra than corner-sharing octahedra, as the peak at r = 3.3 Å is more intense than the peak at r = 3.8 Å. In the PDFs obtained from the samples synthesized with 15 mM, 20 mM and 25 mM precursor concentrations, clear peaks extend beyond r = 10 Å as expected for materials showing Bragg peaks. The PDFs are plotted to their full range in Fig. S1.† The increase in size and order can only be related to the increase in concentration as all other synthetic parameters are identical in the 5 syntheses.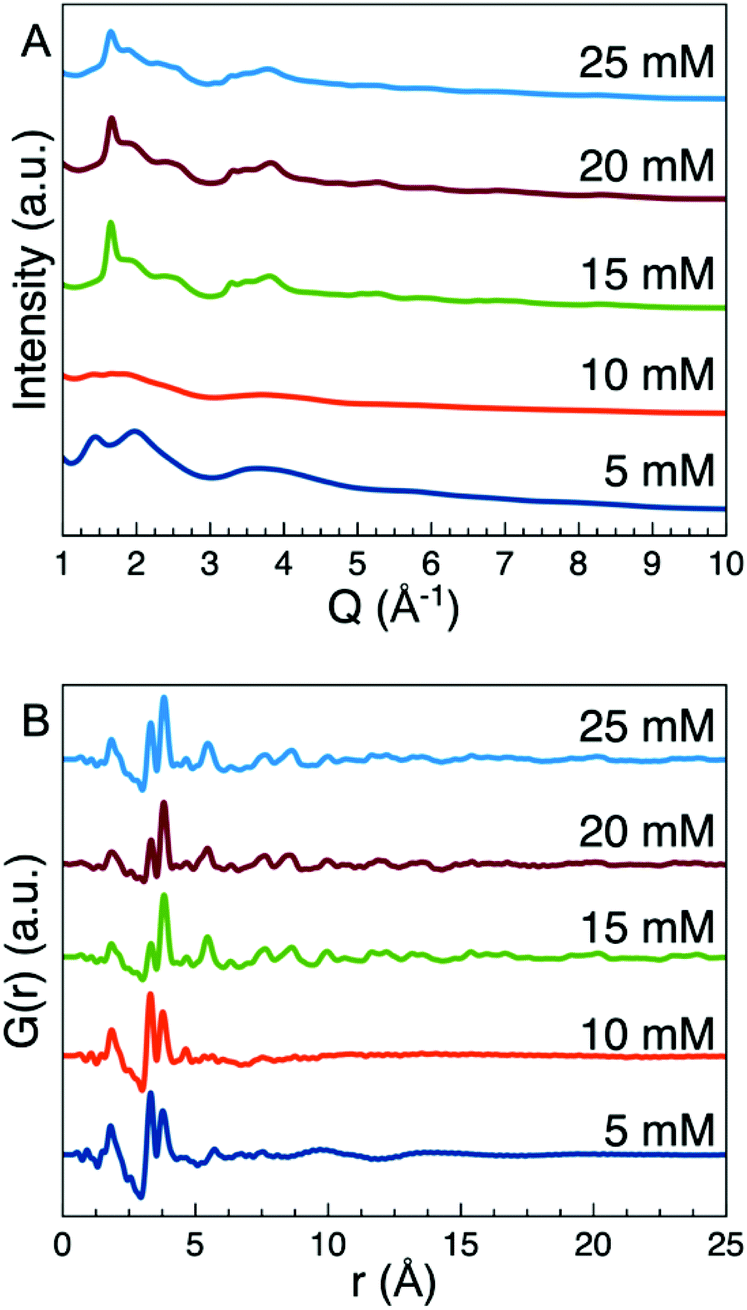 | ||
| Fig. 3 (A) The total scattering data from the 5 samples studied. In the 15, 20, and 25 mM samples a Bragg peak is visible at 1.65 Å−1. (B) PDFs obtained from the 5 samples. | ||
Before further analysis of the atomic structure of the nanoparticles, we first characterize the particle size and size distribution using Small-Angle X-ray Scattering (SAXS). SAXS data were measured for the 5 and 10 mM samples. The nanoparticles aggregated very quickly and if left undisturbed they packed into a well-ordered nanoscale lattice as seen in Fig. S2.† However, SAXS data collected immediately after sample preparation before the formation of a nanoparticle lattice could be modelled using a spherical form factor with a lognormal size distribution, the hard-sphere structure factor formulated in SASview48 and a power law to describe the aggregation of nanoparticles.49–51 Further details on the model and the parameters used are given in the ESI.† The SAXS data show that the nanoparticles synthesized with 5 mM precursor concentration (Fig. 4A) are on average 2 nm in diameter which is consistent with the size reported by Soultanidis et al.47 Analysis of the SAXS data from the samples synthesized with 10 mM precursor concentration show a particle size of ca. 4 nm in diameter (Fig. 4B).
 | ||
| Fig. 4 SAXS data for the 5 (A) and 10 mM (B) samples together with calculated SAXS patterns for 2 nm (A) and 4 nm (B) spherical nanoparticles with particle–particle interactions described using a hard-sphere structure factor. The inserts show the corresponding lognormal size distributions. All SAXS data are plotted on a double logarithmic scale. (C) The PDF for the two samples with the SAXS size indicated, compared to the degree of ordering in the PDFs. | ||
In Fig. 4C the PDFs for the two samples are plotted with an indication of the size obtained from SAXS. If the particles were nanocrystalline and had an ordered structure, we would expect to see clear PDF peaks to almost this r-value, taking into account instrumental PDF damping. The difference between the extent of atomic ordering as investigated by PDF and the particle size obtained from SAXS modelling means that the atomic structure of the nanoparticles cannot be nanocrystalline. Instead, they appear amorphous, as also indicated by the broad features in the PDFs at ca. r = 10 Å.
Structural characterization of amorphous samples
PDF analysis allows identifying the main structural motifs present in amorphous materials with only local atomic order. Considering the PDFs shown in Fig. 3B, the first peak in the PDFs from all samples can be assigned to the W–O bond at r = 1.8 Å which indicates [WO6]-octahedra with W5+ or W6+. The two next peaks are at r = 3.3 Å and r = 3.8 Å which are the W–W distances expected for structures containing W5+ or W6+ as discussed above. In the amorphous nanoparticles (5 and 10 mM samples) the peak at 3.3 Å arising from edge-sharing [WO6]-octahedra is more prominent compared to the 3.8 Å peak from corner-sharing [WO6]-octahedra. This trend is not observed in crystalline tungsten oxides as illustrated in the calculated PDFs shown in Fig. 2E. In a study of amorphous tungsten oxide films prepared by thermal evaporation, Lugovskaya et al.45 used PDF for structure characterization and did not observe any significant intensity at r = 3.3 Å as opposed to the nanoparticles reported here. Jürgen et al.46 observed a W–W PDF peak at 2.5 Å from a tungsten oxide thin film prepared using rf sputtering, which we do not observe in our samples. The structure of the nanoparticles studied here thus appears different than any previously reported crystalline or amorphous tungsten oxides.The intense PDF peak at r = 3.3 Å indicates that the structure of the nanoparticles may resemble that found in POMs. The precursor for the synthesis, ammonium metatungstate hydrate, contains the metatungstate ion [H2W12O40]6− (Fig. 1E), but, as seen in Fig. 5A, the metatungstate cluster structure does not describe the PDF from the amorphous particles well. We have previously studied the formation of tungsten oxides nanomaterials, showing that metatungstate converts into the paratungstate B ion, [H2W12O42]10− (Fig. 1F) when heated in oleylamine.52 When using the paratungstate B cluster structure as the model, a better agreement with the experimental PDF is seen as illustrated in Fig. 5B. The paratungstate contains interatomic distances that nicely overlap with the peak positions up to 7 Å in the PDF from the 5 mM sample. However, the intensities of the peaks in the PDF of paratungstate B do not match the experimental PDF. As can be seen in the fit in Fig. 5B, the nanoparticles contain more edge-sharing [WO6]-octahedra compared to corner-sharing [WO6]-octahedra, as the peak at r = 3.3 Å is more intense than the peak at r = 3.8 Å. In the paratungstate B cluster, this is reversed with the peak at r = 3.8 Å as the most intense peak, also seen in Fig. 5B. The local structure of the amorphous nanoparticles is therefore similar to the atomic structure of the paratungstate cluster but more disordered and with fewer corner-sharing octahedra.
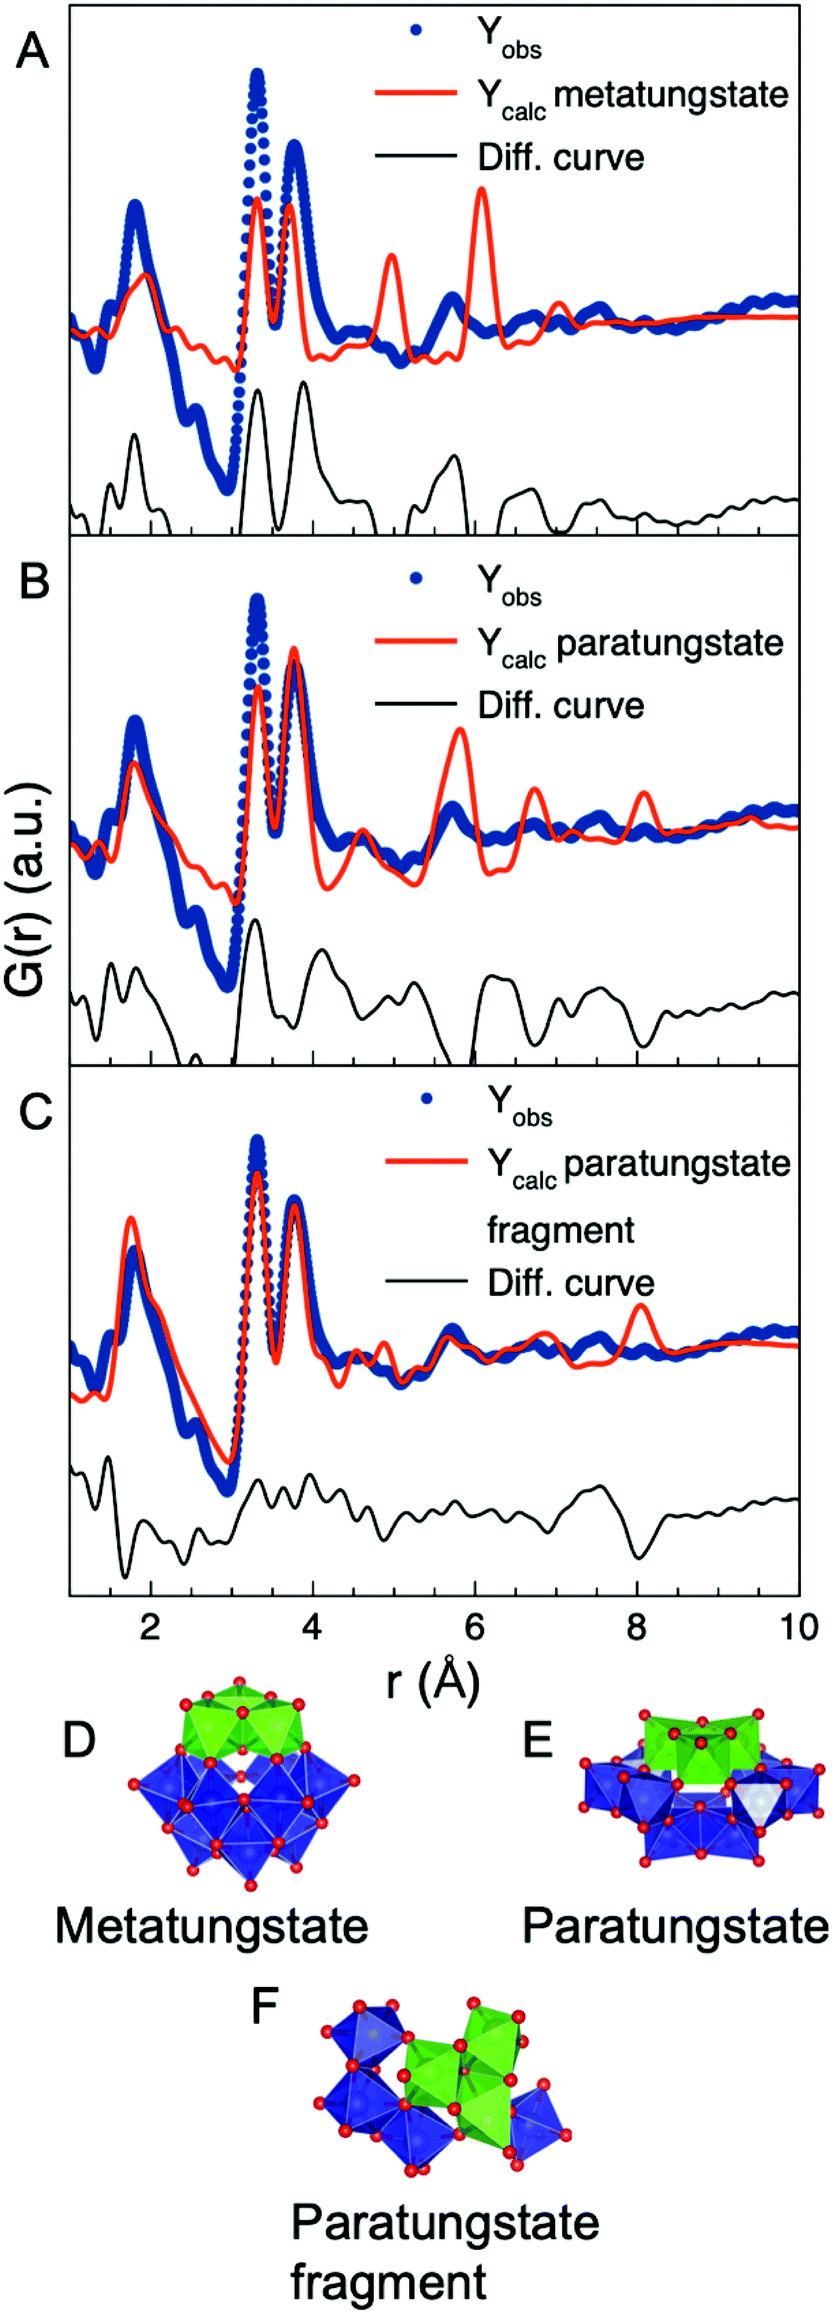 | ||
| Fig. 5 (A) The fitted PDF of metatungstate (structure shown in D) to the PDF obtained from the 5 mM sample. (B) The fitted PDF of paratungstate (structure shown in E) to the PDF obtained from the 5 mM sample. (C) The fitted PDF of the structure seen in (F) to the PDF obtained from the 5 mM sample. The triad in green highlights the common motif in the POMs that describe the local structure of the amorphous nanoparticles. | ||
To obtain a better fit, we therefore altered the paratungstate model. By systematically removing [WO6]-octahedra from the paratungstate cluster and fitting the resulting fragment structure to the experimental PDF we are able to identify which motifs are present in the amorphous structure. The fragments were fitted by refining a scale factor, a single atomic displacement parameter (ADP) for the W atoms (Uiso,W) and a single ADP for the O atoms (Uiso,O). Afterwards the W atomic positions were refined but constrained not to move more than 0.05 Å along the x, y, and z-directions. The structures that best describe the PDF from the 5 mM sample contain around 6–8 [WO6] octahedra. Fig. 5C shows a fit of one of the fragments which is built up from 7 [WO6] octahedra. Clusters containing 6 or 8 octahedra also gave a good fit to the experimental PDF as seen in Fig. S3 and S4.† Fig. S5† show an example of fits using a model with only 4 octahedra which does not give enough intensity to the edge-sharing peak compared to the experimental PDF of the 5 mM sample. The well-fitting structures all contain a “triad” of edge-sharing [WO6]-octahedra as their central motifs, as marked in green in Fig. 5D–F. The remaining octahedra are all corner-sharing with the triad, and edge- or corner-sharing with each other.
The PDF from the 10 mM sample could be described in the same way. However, the structure of this sample appears more disordered than that synthesized with 5 mM precursor concentration, as no clear PDF peaks are seen at r-values above 6 Å (Fig. 4C). This is also reflected in the PDF fitting, illustrated in Fig. S6.† The best model identified for the 10 mM sample contain only 5 octahedra, however, the triad motif is again significant for obtaining a good fit.
It is here important to note that the models presented should not be considered unique structure solutions to the two samples. Instead, they are simple representations of the dominant structural motifs present. The models thus show that the atomic structure of the smallest tungsten oxide nanoparticles is an amorphous network based on triads of edge-sharing [WO6]-octahedra, commonly found in POMs, connected through corner-sharing [WO6]-octahedra. Models based on POM clusters without the triad motif such as the Lindqvist cluster or the Tungstate Y cluster were also tested as starting models, but they could not fit the intensity ratio of the edge- and corner-sharing peaks, or the peaks at higher r-values.
Structural characterization of nanocrystalline nanoparticles
The samples synthesized with high AMT concentrations (15, 20, and 25 mM) all show a single, clear Bragg peak at approximately Q = 1.65 Å−1 (corresponding to a d-spacing = 3.8 Å) while the remaining features are broad. Similar scattering patterns have been reported for a range of different tungsten oxide nanomaterials.47,53–57 However as shown in Fig. 6A, Bragg peaks and d-spacings in this range occur in almost all reported WOx crystal structures, and we therefore cannot identify the crystalline phase from this information alone. We therefore again turn to PDF analysis. | ||
| Fig. 6 (A) Comparison of the diffraction pattern obtained from the 15 mM sample to the calculated diffraction patterns of W10O29, W18O49 and monoclinic WO3 (m-WO3). The one Bragg peak present in the data arise from most known tungsten oxide crystal structures. (B) TEM image of a nanorod from the 15 mM sample. (C) TEM image the 20 mM sample, showing nanorods. Some spherical nanoparticles are also visible, marked with yellow circles. | ||
Before further discussing the PDFs obtained from the 15, 20, and 25 mM samples, we address the nanoparticle size and shape using TEM. Fig. 6 shows TEM images from the samples synthesized using 15 mM (Fig. 6B) and 20 mM (Fig. 6C) precursor concentration, which confirm that the nanoparticles synthesized at high concentrations are nanorods. The size of the nanorods is not very uniform. The smallest nanorods are observed in the 20 mM sample and are only 1 nm wide and 5 nm long. In the 15 mM sample, however, we observe rods that are 5 nm wide and up to 50 nm long. This is consistent with the PDF results where clear peaks extend the furthest into r in the PDF obtained from the nanoparticles synthesized at 15 mM. However, in all the samples most of the nanorods are between 2 × 15 nm to 4 × 20 nm. Additional TEM images from the samples synthesized at 15, 20 and 25 mM as well as nanoparticles synthesized at 25 mM at 300 °C for 3 h are presented in Fig. S7–S10,† which all show the same features.
We start our structural analysis of the high concentration samples by considering the PDF obtained from the 15 mM sample. The first three main peaks are at r = 1.8 Å, 3.3 Å and 3.8 Å, which corresponds to the W–O distance, the W–W in edge-sharing octahedra/pentagonal bipyramids and the W–W distance corner-sharing octahedra. The presence of the peak at 3.3 Å shows that the sample cannot be described by any of the known WO3 phases, as they do not contain any edge-sharing [WO6]-octahedra or [WO7]-pentagonal bipyramids. As shown in Fig. S11† WO2 also cannot describe the experimental PDF. Instead, the atomic structure of the nanorods appears to resemble the WOx (2 < x < 3) crystal structures. Fig. 7 and Fig. S12–S17† show fits to the PDF using the different WOx crystal structures reported in the literature. Each fit is performed by refining the scale factor, unit cell parameters, the atomic positions of the W atoms constrained by the symmetry of the reported crystallographic space group, and a spherical crystallite size. An isotropic ADP value (Uiso,W) for all W atoms, an isotropic ADP value for all O atoms (Uiso,O), and a parameter to describe correlated atomic motion (δ2) were also refined. The reported tungsten oxide phases that best describe the experimental PDF are those which contain bipyramidal pentagonal columns, for example W18O49 as shown in Fig. 7A. Phases that instead contain shear-planes such as W10O29 fail to provide a good description of the PDF as shown in Fig. 7B.
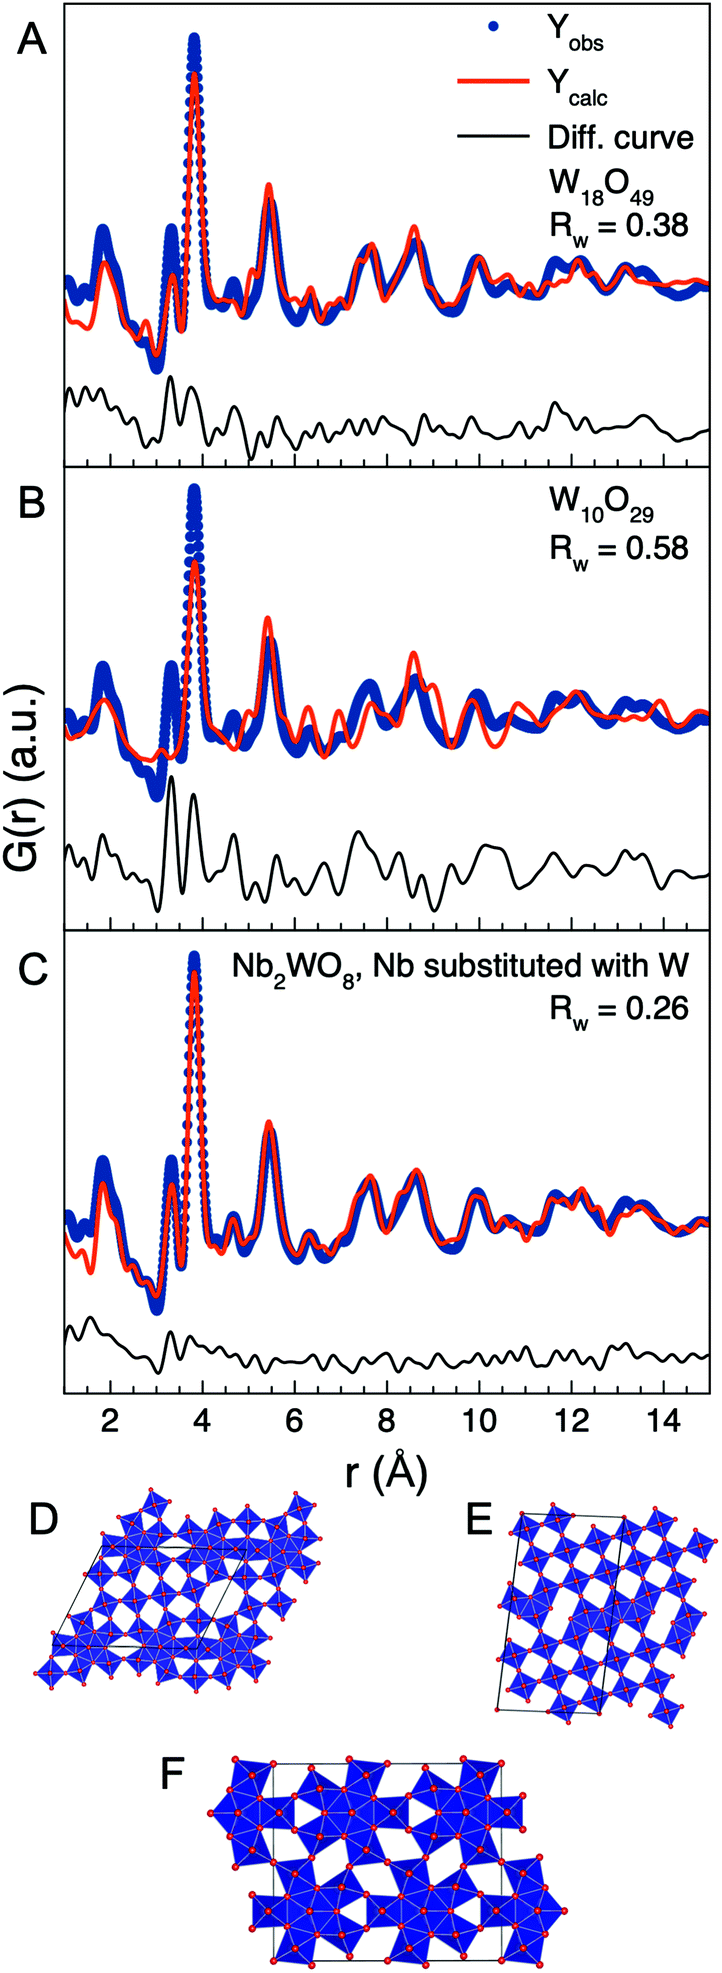 | ||
| Fig. 7 PDF fits of W18O49 (A), W10O29 (B), and W-substituted Nb2WO8 (C) to the data obtained from the 15 mM sample. The crystal structure of W18O49 (D), W10O29 (E), and W-substituted Nb2WO8 (F). | ||
While the structures containing bipyramidal pentagonal columns account for all PDF peaks, they fail to accurately describe the intensities of the 3.3 Å and 3.8 peaks. Furthermore, the Uiso,O parameter refine to the unphysical value of 0.1 Å2 or above. In the fits shown, the Uiso,O value has been fixed to 0.05 Å2. The high ADP value for O indicates a high degree of oxygen disorder in the structure. To see if it was possible to further improve the description of the experimental PDF, we investigated crystal systems with similar crystal structures as WOx (2 < x < 3) containing shear planes or pentagonal columns, such as MoOx, NbOx, MoNbOx, WNbOx and WMoOx. In our modelling starting from these phases, all metal atoms were replaced with W. Example fits for all these systems are shown in Fig. S18–S25.† We found that a good fit of the PDF obtained from the 15 mM sample could be obtained by using a Nb2WO8 phase with Nb exchanged for W.58 When the Nb atoms are replaced with W, the Nb2WO8 phase becomes a W3O8 phase. W3O8 crystal structures have been reported before,59 but none of the reported phases can describe the PDF as shown in Fig. S14 and S15.† Both the previously reported W3O8 phases are high-pressure phases with crystal structures that are different from other WOx structures with one containing edge-sharing octahedra not formed from shear-planes and the other containing pentagonal bipyramids that are corner-sharing with each other.59
As seen in Fig. 7C, the W-substituted Nb2WO8 structure can accurately describe the ratio of the r = 3.3 Å and r = 3.8 Å peaks, while also simultaneously describing the PDF up to 20 Å as shown in Fig. 8A. Other phases such as Mo9O26 also have the correct ratio of edge/corner-sharing octahedra but cannot describe the structure beyond 8 Å, see Fig. S18.† Furthermore, the Uiso,O value of the W-substituted Nb2WO8 phase refine to the much more physical value of 0.01 Å2, suggesting that the W-substituted Nb2WO8 phase much better describes the O disorder present in the nanoparticles synthesized at 15 mM. The W-substituted Nb2WO8 crystal structure distinguishes itself from other bipyramidal pentagonal columns containing crystal structures by being one of the few phases where all octahedra are part of a bipyramidal pentagonal column. This gives it a high number of W–W distances at 3.3 Å compared to the W–W distances at 3.7 Å. Other examples of such phases are one of the previously reported W3O8 phases59 and a Nb22W20O102 phase,60 but none of these phases have their polyhedra arranged in a way that describes the PDF as shown in Fig. S15 and S22.† In the original Nb2WO8 structure, the Nb and W atoms are distributed across all metal sites which we interpret as mixed occupancy of W5+ and W6+ on the metal sites. The W-substituted Nb2WO8 phase is shown alongside the W18O49 and the W10O29 in Fig. 7D–F and the refined parameters for the fits in Fig. 7 are seen in Tables S3–S5.†
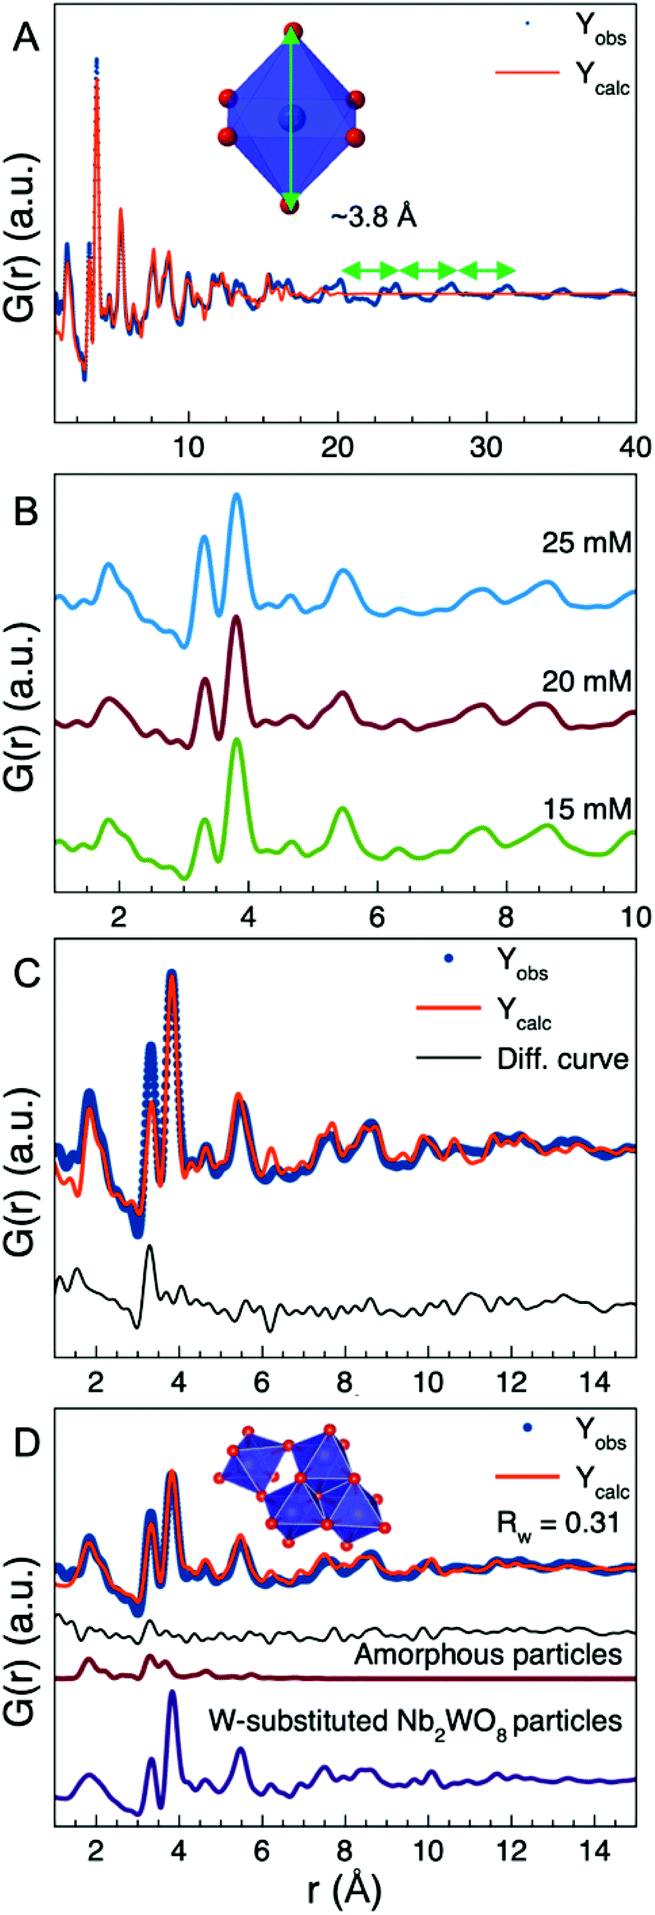 | ||
| Fig. 8 (A) The fit from Fig. 7C extended to r = 40 Å. The peaks not described by the spherical size model are spaced with approximately 3.8 Å between each peak which corresponds to the height of a [WO6]-octahedron. (B) Comparison of the PDFs from the 15, 20, and 25 mM samples where it can be seen that the intensity of the r = 3.3 Å peak increases as the precursor concentration is increased. (C) The fit of the W-substituted Nb2WO8 structure to the PDF from the 25 mM sample, where the model cannot fit the 3.3 Å peak. (D) A combined fit with the W-substituted Nb2WO8 structure and the inserted structure to the PDF from the 25 mM sample. The structure in the insert represents the local structure of the amorphous nanoparticles. The black curve is the difference curve, and below are the relative contributions from the two structures. The refined parameters are seen in Table S6.† | ||
The PDF from the 15 mM sample was also fitted over a longer range (r = 1–40 Å) in order to obtain information more information on the morphology of the particles. When using a simple model, where the size-dependent dampening of the PDF is described with a spherical envelope we obtain an average diameter of 23 Å as shown in Fig. 8A. However, this spherical particle model cannot describe the elongated shape of the nanoparticles and therefore does not account for the PDF peaks seen at the highest r-values. The fit reveals that the peaks that are not fitted when using this simple approach are spaced with a repeating distance of 3.8 Å. This is exactly the height of a [WO6] or [WO7] unit, as shown in Fig. 8A. The unit cell parameters of the W-substituted Nb2WO8 phase refines to a = 3.82 Å, b = 18.46 Å and c = 16.06 Å which indicates that the repeating distance of 3.8 Å occurring beyond 23 Å is due to the unit cells stacking on top of each other to form the nanorod. As shown in Fig. S26† the calculated diffraction pattern from the refined cell fits well with the measured scattering pattern. The intense Bragg peak observed in the measured data arise due to the (100) plane in the W-substituted Nb2WO8 structure which show that the nanorods grow along the 〈100〉 direction. The PDF peaks seen above 23 Å therefore primarily represent interatomic distances along the 〈100〉 direction. From the PDF refinements, we can therefore estimate the diameter of the nanorods (size along 〈010〉 and 〈001〉) to be ca. 20–25 Å. Here, it should be noted that the size of the W-substituted Nb2WO8 unit cell is b = 18.46 Å and c = 16.06 Å, i.e. in the same size-range as the estimated particle width. We do not interpret the nanorods as having a perfectly well-defined Nb2WO8 crystal structure, but rather that this structure contains the correct [WO6]-octahedra and [WO7] arrangement and therefore describes the experimental PDF.
In Fig. 8B, we compare the PDFs obtained from the 15, 20, and 25 mM samples, i.e. the samples containing nanorods. The PDFs show similar features, except for the increasing intensity of the r = 3.3 Å peak with increasing AMT concentration. This indicates an increase in the amount of edge-sharing [WO6]-octahedra or [WO7]-pentagonal bipyramidal columns in the samples synthesized with higher precursor concentration. Fig. 8C shows a fit to the PDF from the 25 mM samples using the W-substituted Nb2WO8 structure. The model describes all features in the PDF except for the extra intensity at 3.3 Å. A similar fit is obtained for the 20 mM sample (Fig. S27†). None of the known tungsten oxide crystal structures can fit the extra intensity at 3.3 Å in the PDFs obtained from the 20 and 25 mM samples. However, as indicated in the TEM image shown in Fig. 6C, the 20 mM sample also contains some spherical nanoparticles that are smaller than 4 nm. The presence of nanoparticles with the same amorphous structure as described earlier would explain the relative increase of the peak corresponding to edge-sharing [WO6]-octahedra. To test this hypothesis, we modelled the PDFs from the 20 mM and 25 mM samples with a 2-phase fit, i.e. the W-substituted Nb2WO8 crystal structure and a cluster representing the amorphous structure. For simplicity, the amorphous particles were modelled using a single triad with a corner-sharing [WO6]-octahedra (Fig. 8D), i.e. a structure with 4 [WO6] octahedra. The combined fit provides a good description of the PDF of both samples, as seen in Fig. S28† and Fig. 8D.
The refined parameters obtained for the crystalline phase from modelling of the 15 mM, 20 mM and 25 mM samples are given in Tables S5–S7.† The refined parameters for all three samples are similar, except for the spherical diameter that refines to 23 Å for the 15 mM sample, 19 Å for the 20 mM sample, and 17 Å for the 25 mM sample. However, considering the simple modelling and the large polydispersity present in the samples, these differences are not likely to be significant.
Heating time and temperature effects
To investigate the effects of reaction time and temperature on the synthesis, nanoparticles were also synthesized with a longer reaction time (increased from 2 h to 3 h) and a higher temperature (300 °C instead of 250 °C). Fig. 9A shows PDFs illustrating the effect of these parameters. When keeping a reaction temperature of 250 °C, increasing the heating time only slightly altered the ratio of the peaks at r = 3.3 Å and r = 3.8 Å and did not have any major impact on the nanoparticle structure. However, increasing the temperature to 300 °C dramatically reduces the intensity of the r = 3.3 Å peak as seen in Fig. 9A. The fit in Fig. 9B demonstrates that the nanorods can again be described with the W-substituted Nb2WO8 structure, without the need for a second phase representing the amorphous particles. The refined parameters are shown in Table S8.† The higher temperature thus ensures conversion of the remaining amorphous nanoparticles into crystalline nanorods, while not affecting the atomic structure of the formed nanorods. The spherical diameter refines to 25 Å indicating increased growth of the nanorods.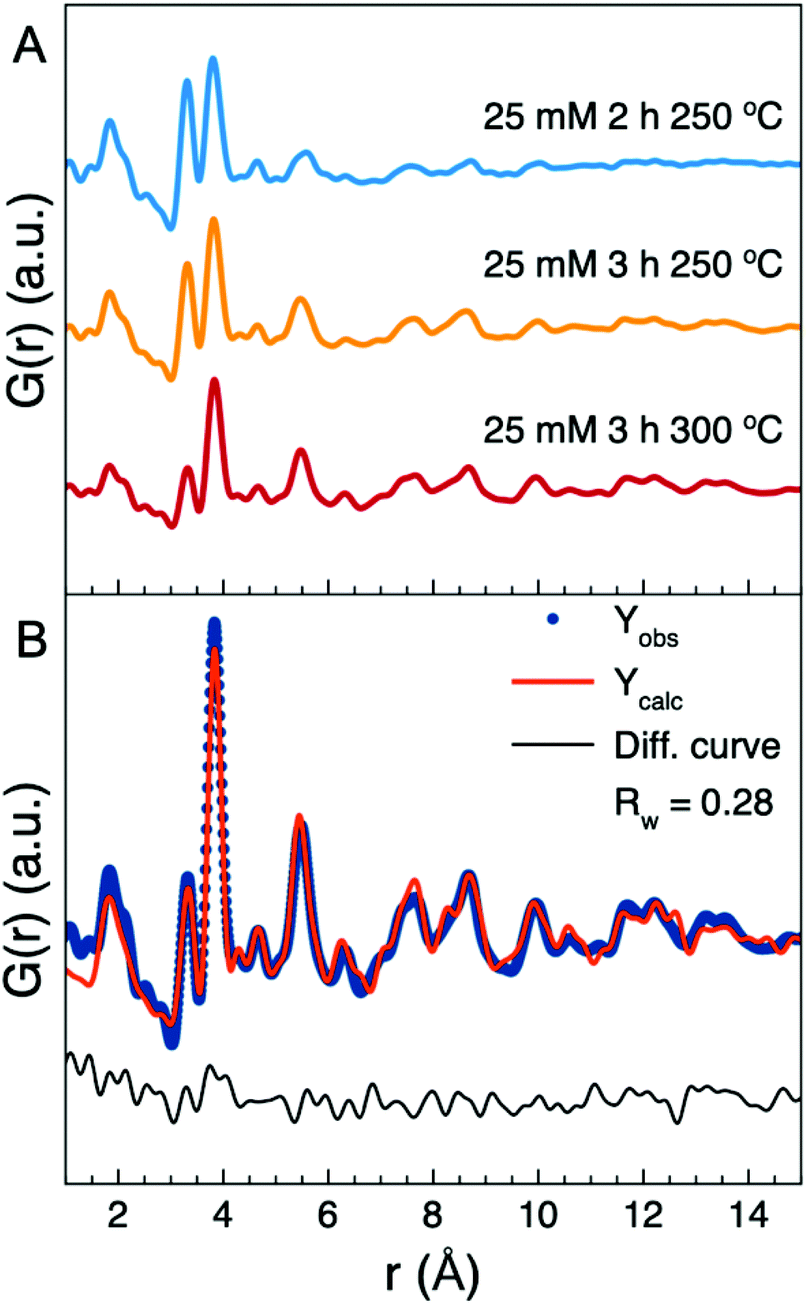 | ||
| Fig. 9 (A) Comparison of PDFs from 3 samples synthesized with 25 mM concentration at 250 or 300 °C for 2 and 3 h. Increasing the heating time slightly reduces the intensity of the 3.3 Å peak, while increasing the temperature greatly reduces the extra intensity at r = 3.3 Å. (B) Fit using the W-substituted Nb2WO8 phase to the PDF from the nanoparticles obtained at 300 °C with a concentration of 25 mM after 3 h heating. | ||
The conversion of the smaller amorphous nanoparticles into nanorods indicates a formation and growth mechanism of the nanorods based on the amorphous nanoparticles. At low concentrations, only the smaller, amorphous nanoparticles form. At higher concentrations the amount of formed amorphous nanoparticles will be large enough for some of them to meet and form crystalline nanorods. The rods will then grow, possibly through an oriented attachment-like mechanism along the crystallographic a-direction by attaching the amorphous nanoparticles to the ends of the nanorods. When a sufficient number of amorphous nanoparticles have formed rods, the number of amorphous nanoparticles becomes too low for further reaction resulting in a mixture of the two types of particles in the sample. By increasing the temperature, it is possible to overcome the possible barrier stopping the remaining amorphous nanoparticles from reacting and convert them to crystalline nanorods.
To further investigate when crystalline nanorods formed, we also synthesized two samples using precursor concentrations of 12.5 and 13.75 mM at 250 °C for 2 h. Total scattering data were collected (Fig. S29†), and the PDFs obtained from these two samples are shown in Fig. 10. As evident in the small increase of intensity of the corner-sharing peak and the appearance of peaks at r = 7.6 Å and r = 8.5 Å in the PDFs, a small number of crystalline nanorods appear to have formed. This suggests that there is an optimal concentration for minimizing the formation of the amorphous nanoparticles at ca. 15 mM.
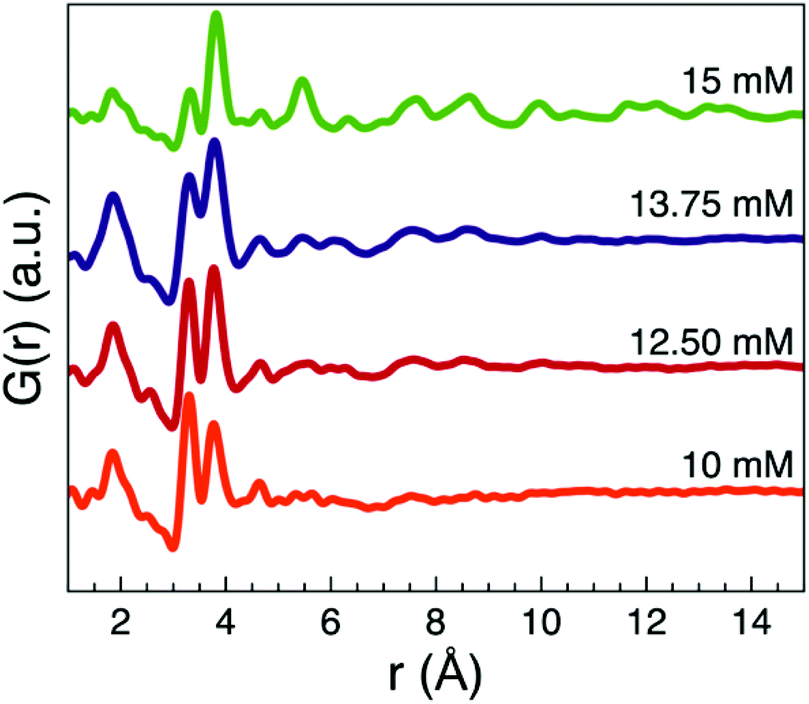 | ||
| Fig. 10 The PDFs obtained from the samples synthesized at 12.50 and 13.75 mM at 250 °C for 2 h compared to the PDF of the samples synthesized at 10 and 15 mM mM at 250 °C for 2 h. A small amount of the crystalline nanorods have been formed at 12.50 and 13.75 mM. | ||
The results show that the size of the nanoparticles influences the atomic structure, but the physical effect behind this is not yet clear. From other systems, it is well known that nanoparticles at ambient conditions can take polymorphs that are usually only observed at high pressure,61 or phase transitions in nanomaterials can take place at lower pressures than observed for bulk materials.62 This may be due to the large surface-to-volume ratio of the nanoparticles, elevating the pressure on the particles.63 In bulk tungsten oxides, amorphization has been observed when subjecting the material to high pressure,64 and the size-dependent amorphous structure we observe is likely to be related to this effect.63 The amorphous structure may also be associated with the synthesis pathway as an unstable intermediate before the formation of tungsten oxide nanorods.
Conclusion
Through PDF analysis combined with SAXS and TEM, we have studied the structure of tungsten oxide nanomaterials synthesized by thermal decomposition of ammonium metatungstate in oleylamine.47 The size and shape of the nanoparticles can be controlled through precursor concentration, and it is possible to produce both spherical nanoparticles and nanorods. The spherical nanoparticles formed at the lowest precursor concentration (below 10 mM) are amorphous and their local structure is not similar to any previously reported known tungsten oxide. Instead, the structure is related to the polyoxometalate paratungstate B. The nanoparticles thus adopt an amorphous structure that is composed of a network of triads of edge-sharing [WO6]-octahedra which are connected through corner-sharing [WO6]-octahedra. The size of the nanoparticles can be increased by increasing the precursor concentration. At 5 mM precursor concentration, the average size of the amorphous particles is ca. 2 nm, while it can be increased to 4 nm at 10 mM.Increasing the precursor concentration to 15 mM yields nanorods. These are nanocrystalline, however, their structures are not well-described by any known tungsten oxide. Instead, we used a W-substituted Nb2WO8 crystal structure containing bipyramidal pentagonal columns to model the PDFs. At 20 and 25 mM AMT, nanorods were also formed, but so were a secondary phase of smaller, amorphous nanoparticles. By raising the synthesis temperature from 250 °C to 300 °C all the amorphous nanoparticles converted into crystalline nanorods indicating that the nanorods grow from the smaller amorphous nanoparticles.
The study highlights the large effects nanosizing may have on the atomic structure of materials and to the best of our knowledge, this is the first observation of amorphous structure induced by the nanoparticle size. Neither the amorphous nanoparticles or crystalline nanorods synthesized and characterized here could be described using known tungsten oxide structures. This highlights the need for further insight into size-dependent structures, as understanding atomic structure is a prerequisite for further nanomaterial development.
Experimental methods
Synthesis
Tungsten oxide nanoparticles were prepared by heating a 20 mL solution of oleylamine (Merck/Sigma Aldrich, Technical grade 70%, 98% primary amines) and ammonium metatungstate hydrate, (NH4)6[H2W12O40]·xH2O, (Merck/Sigma Aldrich, trace metal basis 99.99%) to 250 °C under nitrogen flow in a 3-necked round-bottomed flask for 2 h. All chemicals were used as received. After 2 h of heating at 250 °C, the solutions were left at room temperature to cool down. The samples for Small-Angle X-ray Scattering (SAXS) and Transmission Electron Microscopy measurements were taken directly from the reaction mixture and suspended in toluene. The remaining particles were then washed with ethanol and acetone, then centrifuged to obtain a brown (the 5 and 10 mM samples) or blue powder (the 15, 20 and 25 mM samples). Five samples were prepared with the AMT concentrations 5, 10, 15, 20, and 25 mM. The synthesis was also performed with 25 mM precursor concentration for 3 h at 250 and 300 °C.Total scattering and pair distribution function analysis
Total Scattering data were measured at the beamlines DanMAX at MAXIV, P02.165 at PETRA III, DESY and 11ID-B at APS, Argonne National Laboratory. The samples were loaded in 1.00 mm Kapton capillaries (inner diameter) and data were measured using the rapid acquisition PDF setup66 with the wavelengths 0.3542 Å (DanMAX), 0.2072 Å (P02.1) and 0.2114 Å (11-ID-B). Integration of the 2D pattern into 1D patterns was done in Fit2D.67 The total scattering data were obtained by measuring 10 2D scattering patterns with a 1 min exposure time and summing the frames into a single image before azimuthal integration.60 No changes were observed between the 10 frames obtained, indicating no or negligible beam damage of the samples. Background subtraction, normalization and Fourier transformation into the PDFs were done in PDFgetX3. For the DESY and APS data, the Q-range from 0.5 to Q of 24 Å−1 was included,68 while the Qmax value for the DanMAX data was 19.5 Å−1. The scattering pattern obtained from an empty Kapton capillary was used for background correction. Fitting using crystal structure models was done in PDFgui69 while fits including the models for amorphous structures were done using Diffpy-CMI.70Small-angle X-ray scattering
The nanoparticles suspended in toluene (WMR, 99%) were sonicated for 2 h and loaded in quartz capillaries with an inner diameter of 1.5 mm. The small-angle scattering from the suspension was measured at room temperature using a SAXSLab instrument at the Niels Bohr Institute, University of Copenhagen, with an X-ray wavelength of 1.54 Å. SAXS data measured from toluene and an empty quartz capillary were used for background collection. The data were integrated using the program Saxsgui and analyzed with Diffpy-CMI,70 which uses SASVIEW functions.51 Further details of the modelling are available in the ESI.†Transmission electron microscopy
TEM grids (Agar scientific, 200 mesh Cu) were prepared by drop-casting suspensions of the nanoparticles in ethanol on the grids. Images were taken with an FEI Tecnai T20 G2 microscope and processed with FIJI.71Author contributions
MJ and KMØJ conceptualized the study. MJ, TLC, ASA, MRVJ, and DRS collected the total scattering data and MJ did the PDF analysis with inputs from TLC, and KMØJ. MJ and ASA collected and analyzed the SAXS data. MJ did the TEM analysis. MJ and KMØJ wrote the original draft of the paper, and all authors contributed to the review and editing of the paper. KMØJ did funding acquisition and supervised the study.Conflicts of interest
There are no conflicts to declare.Acknowledgements
We are grateful to the Villum Foundation for financial support through a Villum Young Investigator grant (VKR00015416). We acknowledge the Carlsberg Foundation for financial support through grants CF14-0652 and CF17-0976. Funding from the Danish Ministry of Higher Education and Science through the SMART Lighthouse is gratefully acknowledged. We thank DANSCATT (supported by the Danish Agency for Science and Higher Education) for support. We acknowledge DESY (Hamburg, Germany), a member of the Helmholtz Association HGF, for the provision of experimental facilities. Parts of this research were carried out at P02.1 and we would like to thank Martin Etter for assistance in using the beamline. We acknowledge MAX IV Laboratory for time on Beamline DanMAX under Proposal 20200731. Research conducted at MAX IV is supported by the Swedish Research Council under contract 2018-07152, the Swedish Governmental Agency for Innovation Systems under contract 2018-04969, and Formas under contract 2019-02496. DanMAX is funded by the NUFI grant no. 4059-00009B. This research used resources of the Advanced Photon Source, a U.S. Department of Energy (DOE) Office of Science User Facility, operated for the DOE Office of Science by Argonne National Laboratory under Contract No. DE-AC02-06CH11357. Part of this work was performed in part at DTU Danchip/Cen, the National Center for Micro-and Nanofabrication at the Technical University of Denmark. This work benefited from the use of the SasView application, originally developed under NSF award DMR-0520547. SasView contains code developed with funding from the European Union's Horizon 2020 research and innovation programme under the SINE2020 project, grant agreement No. 654000.References
- B. H. Kim, M. J. Hackett, J. Park and T. Hyeon, Synthesis, Characterization, and Application of Ultrasmall Nanoparticles, Chem. Mater., 2014, 26(1), 59–71 CrossRef CAS.
- T. L. Christiansen, S. R. Cooper and K. M. Ø. Jensen, There's no place like real-space: elucidating size-dependent atomic structure of nanomaterials using pair distribution function analysis, Nanoscale Adv., 2020, 2(6), 2234–2254 RSC.
- E. Roduner, Size matters: why nanomaterials are different, Chem. Soc. Rev., 2006, 35(7), 583–592 RSC.
- R. Jin, C. Zeng, M. Zhou and Y. Chen, Atomically Precise Colloidal Metal Nanoclusters and Nanoparticles: Fundamentals and Opportunities, Chem. Rev., 2016, 116(18), 10346–10413 CrossRef CAS PubMed.
- L. Liu and A. Corma, Metal Catalysts for Heterogeneous Catalysis: From Single Atoms to Nanoclusters and Nanoparticles, Chem. Rev., 2018, 118(10), 4981–5079 CrossRef CAS PubMed.
- A. Sáenz-Trevizo and A. M. Hodge, Nanomaterials by design: a review of nanoscale metallic multilayers, Nanotechnology, 2020, 31(29), 292002 CrossRef PubMed.
- S. Sun, H. Zeng, D. B. Robinson, S. Raoux, P. M. Rice, S. X. Wang and G. Li, Monodisperse MFe2O4 (M=Fe, Co, Mn) Nanoparticles, J. Am. Chem. Soc., 2004, 126(1), 273–279 CrossRef CAS PubMed.
- Z. Hens and J. De Roo, Atomically Precise Nanocrystals, J. Am. Chem. Soc., 2020, 142(37), 15627–15637 CrossRef CAS PubMed.
- C. Burda, X. Chen, R. Narayanan and M. A. El-Sayed, Chemistry and Properties of Nanocrystals of Different Shapes, Chem. Rev., 2005, 105(4), 1025–1102 CrossRef CAS PubMed.
- M. V. Kovalenko, L. Manna, A. Cabot, Z. Hens, D. V. Talapin, C. R. Kagan, V. I. Klimov, A. L. Rogach, P. Reiss, D. J. Milliron, P. Guyot-Sionnnest, G. Konstantatos, W. J. Parak, T. Hyeon, B. A. Korgel, C. B. Murray and W. Heiss, Prospects of Nanoscience with Nanocrystals, ACS Nano, 2015, 9(2), 1012–1057 CrossRef CAS PubMed.
- Q. A. Akkerman, S. G. Motti, A. R. Srimath Kandada, E. Mosconi, V. D'Innocenzo, G. Bertoni, S. Marras, B. A. Kamino, L. Miranda, F. De Angelis, A. Petrozza, M. Prato and L. Manna, Solution Synthesis Approach to Colloidal Cesium Lead Halide Perovskite Nanoplatelets with Monolayer-Level Thickness Control, J. Am. Chem. Soc., 2016, 138(3), 1010–1016 CrossRef CAS PubMed.
- M. Auffan, J. Rose, J.-Y. Bottero, G. V. Lowry, J.-P. Jolivet and M. R. Wiesner, Towards a definition of inorganic nanoparticles from an environmental, health and safety perspective, Nat. Nanotechnol., 2009, 4(10), 634–641 CrossRef CAS PubMed.
- F. M. Michel, L. Ehm, S. M. Antao, P. L. Lee, P. J. Chupas, G. Liu, D. R. Strongin, M. A. A. Schoonen, B. L. Phillips and J. B. Parise, The Structure of Ferrihydrite, a Nanocrystalline Material, Science, 2007, 316(5832), 1726 CrossRef CAS PubMed.
- N. P. Funnell, M. F. Fulford, S. Inoué, K. Kletetschka, F. M. Michel and A. L. Goodwin, Nanocomposite structure of two-line ferrihydrite powder from total scattering, Commun. Chem., 2020, 3(1), 22 CrossRef CAS.
- B. Gilbert, F. Huang, H. Zhang, G. A. Waychunas and J. F. Banfield, Nanoparticles: Strained and Stiff, Science, 2004, 305(5684), 651 CrossRef CAS PubMed.
- D. C. Gary, S. E. Flowers, W. Kaminsky, A. Petrone, X. Li and B. M. Cossairt, Single-Crystal and Electronic Structure of a 1.3 nm Indium Phosphide Nanocluster, J. Am. Chem. Soc., 2016, 138(5), 1510–1513 CrossRef CAS PubMed.
- Y. L. Zhang, X. J. Jin, Y. H. Rong, T. Y. Hsu, D. Y. Jiang and J. L. Shi, The size dependence of structural stability in nano-sized ZrO2 particles, Mater. Sci. Eng., A, 2006, 438–440, 399–402 CrossRef.
- A. Bumajdad, A. A. Nazeer, F. Al Sagheer, S. Nahar and M. I. Zaki, Controlled Synthesis of ZrO2 Nanoparticles with Tailored Size, Morphology and Crystal Phases via Organic/Inorganic Hybrid Films, Sci. Rep., 2018, 8(1), 3695 CrossRef PubMed.
- T. L. Christiansen, E. D. Bøjesen, M. Juelsholt, J. Etheridge and K.MØ. Jensen, Size Induced Structural Changes in Molybdenum Oxide Nanoparticles, ACS Nano, 2019, 13(8), 8725–8735 CrossRef CAS PubMed.
- K. M. Ø. Jensen, P. Juhas, M. A. Tofanelli, C. L. Heinecke, G. Vaughan, C. J. Ackerson and S. J. L. Billinge, Polymorphism in magic-sized Au144(SR)60 clusters, Nat. Commun., 2016, 7, 11859 CrossRef CAS PubMed.
- J. Yan, S. Malola, C. Hu, J. Peng, B. Dittrich, B. K. Teo, H. Häkkinen, L. Zheng and N. Zheng, Co-crystallization of atomically precise metal nanoparticles driven by magic atomic and electronic shells, Nat. Commun., 2018, 9(1), 3357 CrossRef PubMed.
- M. W. Heaven, A. Dass, P. S. White, K. M. Holt and R. W. Murray, Crystal Structure of the Gold Nanoparticle [N(C8H17)4][Au25(SCH2CH2Ph)18], J. Am. Chem. Soc., 2008, 130(12), 3754–3755 CrossRef CAS PubMed.
- T. Grewe, M. Meggouh and H. Tüysüz, Nanocatalysts for Solar Water Splitting and a Perspective on Hydrogen Economy, Chem. – Asian J., 2016, 11(1), 22–42 CrossRef CAS PubMed.
- C. Santato, M. Ulmann and J. Augustynski, Photoelectrochemical Properties of Nanostructured Tungsten Trioxide Films, J. Phys. Chem. B, 2001, 105(5), 936–940 CrossRef CAS.
- C.-M. Wu, S. Naseem, M.-H. Chou, J.-H. Wang and Y.-Q. Jian, Recent Advances in Tungsten-Oxide-Based Materials and Their Applications, Front. Mater., 2019, 6(49), 1–17 Search PubMed.
- Y.-Y. Li, C.-Y. Zhong, M.-X. Li, Q.-Y. Zhang, Y. Chen, Z.-Q. Liu and J. Z. Zhang, Tuning morphology-dependent localized surface plasmon resonance in quasi-metallic tungsten oxide nanostructures for enhanced photocatalysis, J. Mater. Chem. C, 2021, 9(5), 1614–1621 RSC.
- Y. Tian, S. Cong, W. Su, H. Chen, Q. Li, F. Geng and Z. Zhao, Synergy of W18O49 and Polyaniline for Smart Supercapacitor Electrode Integrated with Energy Level Indicating Functionality, Nano Lett., 2014, 14(4), 2150–2156 CrossRef CAS PubMed.
- M. Qiu, P. Sun, L. Shen, K. Wang, S. Song, X. Yu, S. Tan, C. Zhao and W. Mai, WO3 nanoflowers with excellent pseudo-capacitive performance and the capacitance contribution analysis, J. Mater. Chem. A, 2016, 4(19), 7266–7273 RSC.
- S. Zhao, C. Dong and F. Huang, Proton-insertion-pseudocapacitance of tungsten bronze tunnel structure enhanced by transition metal ion anchoring, Nanoscale, 2021, 13(39), 16790–16798 RSC.
- H. Peng, P. Liu, D. Lin, Y. Deng, Y. Lei, W. Chen, Y. Chen, X. Lin, X. Xia and A. Liu, Fabrication and multifunctional properties of ultrasmall water-soluble tungsten oxide quantum dots, Chem. Commun., 2016, 52(61), 9534–9537 RSC.
- W. Morales, M. Cason, O. Aina, N. R. de Tacconi and K. Rajeshwar, Combustion Synthesis and Characterization of Nanocrystalline WO3, J. Am. Chem. Soc., 2008, 130(20), 6318–6319 CrossRef CAS PubMed.
- S. Wang, S. V. Kershaw, G. Li and M. K. H. Leung, The self-assembly synthesis of tungsten oxide quantum dots with enhanced optical properties, J. Mater. Chem. C, 2015, 3(14), 3280–3285 RSC.
- X.-J. Huang, J. Bao, Y. Han, C.-W. Cui, J.-X. Wang, X.-F. Zeng and J.-F. Chen, Controllable synthesis and evolution mechanism of tungsten bronze nanocrystals with excellent optical performance for energy-saving glass, J. Mater. Chem. C, 2018, 6(29), 7783–7789 RSC.
- S. Bai, K. Zhang, X. Shu, S. Chen, R. Luo, D. Li and A. Chen, Carboxyl-directed hydrothermal synthesis of WO3 nanostructures and their morphology-dependent gas-sensing properties, CrystEngComm, 2014, 16(44), 10210–10217 RSC.
- S. Bai, K. Zhang, R. Luo, D. Li, A. Chen and C. C. Liu, Low-temperature hydrothermal synthesis of WO3 nanorods and their sensing properties for NO2, J. Mater. Chem., 2012, 22(25), 12643–12650 RSC.
- H. Zhang, M. Yao, L. Bai, W. Xiang, H. Jin, J. Li and F. Yuan, Synthesis of uniform octahedral tungsten trioxide by RF induction thermal plasma and its application in gas sensing, CrystEngComm, 2013, 15(7), 1432–1438 RSC.
- M. T. Zahoor, M. Ahmad, K. Maaz, S. Karim, K. Waheed, G. Ali, S. Hussain, S. Z. Hussain and A. Nisar, Tungsten oxide multifunctional nanostructures: Enhanced environmental and sensing applications, Mater. Chem. Phys., 2019, 221, 250–257 CrossRef CAS.
- M. Sundberg, P. E. Werner and I. P. Zibrov, X-ray powder crystal structure analysis of high pressure tungsten dioxide On the information in weak reflections, Z. Kristallogr., 1994, 209(8), 662–666 CAS.
- D. J. Palmer and P. G. Dickens, Tungsten dioxide: structure refinement by powder neutron diffraction, Acta Crystallogr., Sect. B: Struct. Crystallogr. Cryst. Chem., 1979, 35(9), 2199–2201 CrossRef.
- R. J. D. Tilley, The Crystal Chemistry of the Higher Tungsten Oxides. In The Chemistry of Non-Sag Tungsten, Pergamon, Oxford, 1995; pp 93–109 Search PubMed.
- H. Zheng, J. Z. Ou, M. S. Strano, R. B. Kaner, A. Mitchell and K. Kalantar-zadeh, Nanostructured Tungsten Oxide – Properties, Synthesis, and Applications, Adv. Funct. Mater., 2011, 21(12), 2175–2196 CrossRef CAS.
- B. Gerand, G. Nowogrocki, J. Guenot and M. Figlarz, Structural study of a new hexagonal form of tungsten trioxide, J. Solid State Chem., 1979, 29(3), 429–434 CrossRef CAS.
- J. Oi, A. Kishimoto, T. Kudo and M. Hiratani, Hexagonal tungsten trioxide obtained from peroxo-polytungstate and reversible lithium electro-intercalation into its framework, J. Solid State Chem., 1992, 96(1), 13–19 CrossRef CAS.
- N. N. Greenwood and A. Earnshaw, Chemistry of the elements. 2nd edn, Butterworth Heinemann: 2013 Search PubMed.
- L. A. Lugovskaya, L. A. Aleshina, G. M. Kalibaeva and A. D. Fofanov, X-ray study and structure simulation of amorphous tungsten oxide, Acta Crystallogr., Sect. B: Struct. Sci., 2002, 58(4), 576–586 CrossRef CAS PubMed.
- A. Jürgen, M. Joachim, L. Peter and S. Siegfried, Evaluation of the Structure of Amorphous Tungsten Oxide W28O72 by the Combination of Electron-, X-Ray- and Neutron-Diffraction (Three-Beam Experiment), Z. Naturforsch., A: Phys. Sci., 2006, 61(3–4), 189–196 Search PubMed.
- N. Soultanidis, W. Zhou, C. J. Kiely and M. S. Wong, Solvothermal Synthesis of Ultrasmall Tungsten Oxide Nanoparticles, Langmuir, 2012, 28(51), 17771–17777 CrossRef CAS PubMed.
- M. Kotlarchyk and S. H. Chen, Analysis of small angle neutron scattering spectra from polydisperse interacting colloids, J. Chem. Phys., 1983, 79(5), 2461–2469 CrossRef CAS.
- T. Li, A. J. Senesi and B. Lee, Small Angle X-ray Scattering for Nanoparticle Research, Chem. Rev., 2016, 116(18), 11128–11180 CrossRef CAS PubMed.
- A. H. Larsen, J. S. Pedersen and L. Arleth, Assessment of structure factors for analysis of small-angle scattering data from desired or undesired aggregates, J. Appl. Crystallogr., 2020, 53(4), 991–1005 CrossRef CAS.
- https://www.sasview.org/ .
- M. Juelsholt, T. L. Christiansen and K. M. Ø. Jensen, Mechanisms for Tungsten Oxide Nanoparticle Formation in Solvothermal Synthesis: From Polyoxometalates to Crystalline Materials, J. Phys. Chem. C, 2019, 123(8), 5110–5119 CrossRef CAS.
- X. W. Lou and H. C. Zeng, An Inorganic Route for Controlled Synthesis of W18O49 Nanorods and Nanofibers in Solution, Inorg. Chem., 2003, 42(20), 6169–6171 CrossRef CAS PubMed.
- K. Lee, W. S. Seo and J. T. Park, Synthesis and Optical Properties of Colloidal Tungsten Oxide Nanorods, J. Am. Chem. Soc., 2003, 125(12), 3408–3409 CrossRef CAS PubMed.
- G. Gu, B. Zheng, W. Q. Han, S. Roth and J. Liu, Tungsten Oxide Nanowires on Tungsten Substrates, Nano Lett., 2002, 2(8), 849–851 CrossRef CAS.
- J. Y. Luo, F. Chen, Z. Cao, W. H. Zheng, H. C. Liu, Y. D. Li, G. T. Yang and Q. G. Zeng, Complex three-dimensional tungsten oxide nanowire networks: controllable synthesis and growth mechanism, CrystEngComm, 2015, 17(4), 889–894 RSC.
- R. Dören, B. Leibauer, M. A. Lange, E. Schechtel, L. Prädel, M. Panthöfer, M. Mondeshki and W. Tremel, Gram-scale selective synthesis of WO3−x nanorods and (NH4)xWO3 ammonium tungsten bronzes with tunable plasmonic properties, Nanoscale, 2021, 13(17), 8146–8162 RSC.
- L. Monica, The Crystal Structure of Nb2WO8, Acta Chem. Scand., 1972, 26, 2932–2940 CrossRef.
- M. Sundberg, N. D. Zakharov, I. P. Zibrov, Y. A. Barabanenkov, V. P. Filonenko and P. Werner, Two high-pressure tungsten oxide structures of W3O8 stoichiometry deduced from high-resolution electron microscopy images, Acta Crystallogr., Sect. B: Struct. Sci., 1993, 49(6), 951–958 CrossRef.
- N. Stephenson, A structural investigation of some stable phases in the region Nb2O5.WO3-WO3, Acta Crystallogr., Sect. B: Struct. Crystallogr. Cryst. Chem., 1968, 24(5), 637–653 CrossRef CAS.
- K. M. Ø. Jensen, M. Christensen, P. Juhas, C. Tyrsted, E. D. Bojesen, N. Lock, S. J. L. Billinge and B. B. Iversen, Revealing the Mechanisms behind SnO2 Nanoparticle Formation and Growth during Hydrothermal Synthesis: An In Situ Total Scattering Study, J. Am. Chem. Soc., 2012, 134(15), 6785–6792 CrossRef CAS PubMed.
- D. Machon, V. Pischedda, S. Le Floch and A. San-Miguel, Perspective: High pressure transformations in nanomaterials and opportunities in material design, J. Appl. Phys., 2018, 124(16), 160902 CrossRef.
- L. Piot, S. Le Floch, T. Cornier, S. Daniele and D. Machon, Amorphization in Nanoparticles, J. Phys. Chem. C, 2013, 117(21), 11133–11140 CrossRef CAS.
- Y. Gong, F. Zheng, J. Dong, P. An, D. Yang, Z. Guo, H. Li, Y. Li and X. Li, Structural changes in hexagonal WO3 under high pressure, J. Alloys Compd., 2019, 797, 1013–1017 CrossRef CAS.
- A.-C. Dippel, H.-P. Liermann, J. T. Delitz, P. Walter, H. Schulte-Schrepping, O. H. Seeck and H. Franz, Beamline P02.1 at PETRA III for high-resolution and high-energy powder diffraction, J. Synchrotron Radiat., 2015, 22(3), 675–687 CrossRef CAS PubMed.
- P. J. Chupas, X. Qiu, J. C. Hanson, P. L. Lee, C. P. Grey and S. J. L. Billinge, Rapid-acquisition pair distribution function (RA-PDF) analysis, J. Appl. Crystallogr., 2003, 36(6), 1342–1347 CrossRef CAS.
- A. Hammersley, FIT2D: a multi-purpose data reduction, analysis and visualization program, J. Appl. Crystallogr., 2016, 49(2), 646–652 CrossRef CAS.
- P. Juhas, T. Davis, C. L. Farrow and S. J. L. Billinge, PDFgetX3: a rapid and highly automatable program for processing powder diffraction data into total scattering pair distribution functions, J. Appl. Crystallogr., 2013, 46(2), 560–566 CrossRef CAS.
- C. L. Farrow, P. Juhas, J. W. Liu, D. Bryndin, E. S. Božin, J. Bloch, P. Th and S. J. L. Billinge, PDFfit2 and PDFgui: computer programs for studying nanostructure in crystals, J. Phys.: Condens. Matter, 2007, 19(33), 335219 CrossRef CAS PubMed.
- P. Juhas, C. L. Farrow, X. Yang, K. R. Knox and S. J. L. Billinge, Complex modeling: a strategy and software program for combining multiple information sources to solve ill posed structure and nanostructure inverse problems, Acta Crystallogr., Sect. A: Found. Adv., 2015, 71(6), 562–568 CrossRef PubMed.
- J. Schindelin, I. Arganda-Carreras, E. Frise, V. Kaynig, M. Longair, T. Pietzsch, S. Preibisch, C. Rueden, S. Saalfeld, B. Schmid, J.-Y. Tinevez, D. J. White, V. Hartenstein, K. Eliceiri, P. Tomancak and A. Cardona, Fiji: an open-source platform for biological-image analysis, Nat. Methods, 2012, 9(7), 676–682 CrossRef CAS PubMed.
Footnote |
| † Electronic supplementary information (ESI) available. See DOI: 10.1039/d1nr05991b |
| This journal is © The Royal Society of Chemistry 2021 |