Morphological transitions in chemically fueled self-assembly†
Kun
Dai
a,
Marta
Tena-Solsona
 a,
Jennifer
Rodon Fores
a,
Alexander M.
Bergmann
a and
Job
Boekhoven
a,
Jennifer
Rodon Fores
a,
Alexander M.
Bergmann
a and
Job
Boekhoven
 *ab
*ab
aDepartment of Chemistry, Technical University of Munich, Lichtenbergstrasse 4, 85748 Garching, Germany. E-mail: job.boekhoven@tum.de
bInstitute for Advanced Study, Technical University of Munich, Lichtenbergstrasse 2a, 85748 Garching, Germany
First published on 12th November 2021
Abstract
In chemically fueled self-assembly, a reaction cycle activates and deactivates molecules for self-assembly. The resulting assembly is dynamic and should be endowed with unique behavior in this kinetically controlled regime. Recent works have mainly focused on design rules for the activation of molecules for self-assembly, thereby assuming that disassembly upon deactivation inherently follows. However, that is not always the case. This work shows a family of peptides that assemble into colloids regulated through a chemical reaction cycle. Despite their similarity in assembly, we find that they follow a different disassembly pathway upon deactivation. The colloids from several peptides completely disassemble as fuel depletes while others transition into fibers. Our findings demonstrate that assembly and disassembly should be taken into account in chemically fueled self-assembly.
When molecules are held together through non-covalent interactions, nano-architectures arise with properties that differ from their non-assembled counterparts in a process referred to as molecular self-assembly.1,2 Particularly successful examples are amphiphiles that form micelles or peptides that form fibers.3 Decades of research have led to a fundamental understanding of the processes and resulted in design rules for molecular self-assembly.4–9 However, most of the experience is limited to self-assembly processes that occur in- or close-to-equilibrium.
Self-assembly is not limited to synthetic examples but is ubiquitously exploited in biology, for example, to form the cell wall or the cytoskeleton.10–12 In contrast to the examples of man-made self-assembly, molecular assembly in biology almost always occurs out of equilibrium. To sustain these assemblies in an out of equilibrium state, energy is converted by the hydrolysis of high-energy molecules like the phosphate anhydrides ATP or GTP. As a result of their non-equilibrium nature, these assemblies are regulated through the kinetics of their energy-consuming reaction cycle. Such kinetic control is vastly different than the thermodynamic control of self-assembly in- or close-to-equilibrium. A beautiful example of the stark contrast is evident from the lipid membrane in equilibrium versus the membrane of mitochondria which is highly dynamic and constantly undergoing fusion and fission that is tightly regulated by protein machinery fueled by chemical energy.
To create similar dynamic structures and to better understand the physicochemical mechanisms by which such systems are regulated, several studies have focused on the development of self-assembly regulated through kinetic processes. Inspired by the self-assembly of tubulin that is regulated through the hydrolysis of GTP,10 the process of chemically fueled self-assembly was developed.13 In chemically fueled self-assembly, the assembly of molecules is coupled to a chemically fueled reaction cycle.14–18 The reaction cycle comprises two reactions, i.e., an activation and deactivation reaction. In the activation reaction, a non-assembling precursor is activated for assembly by reaction with a chemical fuel. In the deactivation reaction, the activated product reacts to yield the original precursor. Notably, the activation and deactivation proceed through two different pathways and are thus not an equilibrium reaction. As a result, a molecule is temporarily activated for self-assembly at the expense of a molecule of chemical fuel. Examples of chemically fueled self-assembly include the formation of transient fibers driven by the hydrolysis of a methylating agent,19 oil droplets formed by the hydration of condensing agents,20 vesicles that form by the hydrolysis of ATP21 and many others.22–25
In the molecular designs of these chemically fueled assemblies, the precursor is well soluble, typically because it carries several ionic groups. The activation reaction converts these ionic groups, making the product more prone to assemble than the product. Upon deactivation, the electrostatic charges are reinstated, resulting in electrostatic repulsion and disassembly. While most of these studies have focused on the activation step resulting in self-assembly, the disassembly has not been studied in much detail.
In this work, we describe four peptides that assemble at the expense of a chemical fuel. The molecular designs of the peptides are chosen such that they vary in their propensity to form β-sheets and their solubility. We could toggle the peptide's assembly behavior, through molecular design, from almost no assemblies, formation of colloids that disassemble when fuel is depleted, to colloids that transition into fibers as fuel depletes. We qualitatively understand the underlying mechanism, which has to do with the degree of coassembly of the precursor. Our findings suggest that it is essential to consider the pathway of assembly but also the disassembly pathway when designing chemically fueled self-assembling systems. These results will aid the field in developing dynamic, chemically fueled assemblies that show behavior as observed in biological supramolecular architectures.
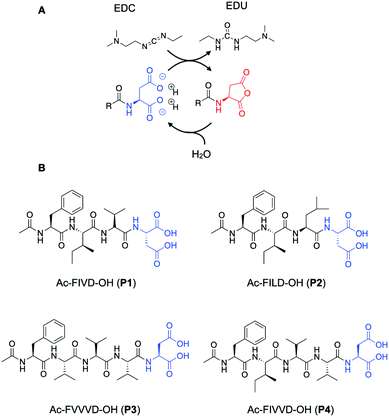
The chemical reaction cycle we used is based on the formation of a transient anhydride at the expense of the irreversible consumption of a high-energy molecule (fuel).26,27 The cycle comprises an activation and a deactivation reaction (Scheme 1A). In the activation, a precursor containing a C-terminal aspartic acid is converted into its corresponding cyclic anhydride at the cost of a carbodiimide-based fuel (1-ethyl-3-(3-dimethylaminopropyl)carbodiimide, EDC). In the deactivation reaction, a molecule of water hydrolyzes the anhydride to yield the initial precursor state. Due to the loss of the anionic charges of the precursor, the activated product can assemble.
We use short peptides containing a C-terminal aspartic acid as a precursor (Scheme 1B).28 The loss of the anionic charges upon activation resulted in a product with a higher propensity to assemble. Directional intermolecular interactions, such as hydrogen bonds or aromatic interactions, are encoded in the remainder of the peptide sequence. By changing this part of the peptide segment, we aim to increase the β-sheet propensity of the products and modify their solubility and, therefore, influence the assembly and, ultimately, the disassembly process. We thus synthesized the precursors Ac-FIVD-OH (P1) Ac-FILD-OH (P2) and Ac-FVVVD-OH (P3), and Ac-FIVVD-OH (P4), where F stands for phenylalanine, I for isoleucine, L for leucine, V for valine, and D for aspartic acid.
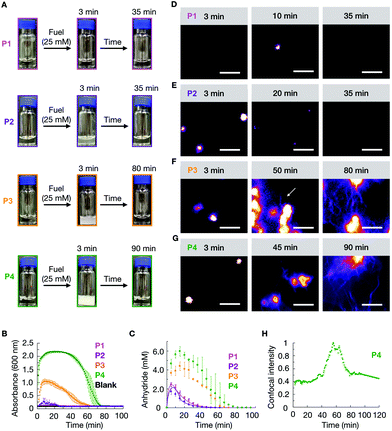
We studied how the emergence and decay of the anhydride affected the macroscopic properties of a solution of 10 mM P1, P2, P3, and P4 in MES buffer at pH 6.0. When these solutions were fueled with 25 mM EDC, we noticed that P1 remained transparent while all other solutions turned turbid within 3 minutes and regained their original transparency after 35 min (P2), 70 min (P3), and 90 min (P4) (Fig. 1A). The transient emergence of turbidity was quantified by measuring the absorbance of 600 nm light in a plate reader (Fig. 1B). We monitored the anhydride and EDC concentration evolution by HPLC (high-pressure liquid chromatography) using a previously described quench method (ESI methods, Fig. S1–S4†).29 We found that the amount of anhydride rapidly increased during the first minutes, explaining the quick change in turbidity for P2, P3, and P4 previously mentioned (Fig. 1C). The concentration anhydride peaked at 10 min for P1 and P2 and 20 min for P3 and P4, respectively. After 50 min and 60 min in the case of P1 and P2, and after 70 min and 80 min in the case of P3 and P4 respectively, all the fuel was gone and, as expected, no more anhydride was present in the solutions (Fig. 1C).
We analyzed the morphology of the transient peptide assemblies using confocal microscopy. The solutions were stained with the hydrophobic fluorescent dye Nile Red (ESI methods†). In line with the lack of turbidity, the confocal microscopy showed only a few colloids, and all of which had disappeared within 35 minutes (Fig. 1D and Fig. S5†). We explain this behavior by the high solubility of the P1 anhydride (2.2 mM, Fig. S6†). P2, which carries isoleucine (L) instead of a valine amino acid, has a lower solubility than P1. The addition of 25 mM fuel to P2 resulted in the formation of transient colloids that disappeared after 35 min (Fig. 1E and Fig. S5†). A cryo-TEM analysis corroborated the formation of colloids right after the fuel addition and their disappearance when fuel depleted (Fig. S7†).
The timeframe of the emergence of the colloids and their disappearance coincided with the lifetime of the turbidity (Fig. 1B). With an increasing propensity to form β-sheets, P3 and P4 also assembled into transient colloids; however, unlike P1 and P2, the colloids did not dissolve but transitioned into fibers at around 50 and 40 min, respectively (Fig. 1F and G). These fibers grow with time and remain kinetically trapped long after fuel depletes (Fig. 1F, and Fig. S5†). The morphological transition from colloids to fibers for P4 was more acute. The transition occurred suddenly and was started by the collapse of the colloids into a donut-like structure. From this structure, fibers emerged and were growing for tens of minutes. Interestingly, the fibers did not disappear but remained kinetically trapped for hours (Fig. 1G and Fig. S5†), long after the fuel was gone. In order to better quantify when the morphological transition occurred, we took P4 as an example, and we measured the total fluorescence intensity per micrograph and normalized it between experiments. We found it to rise rapidly after applying the fuel (Fig. 1H), after which it remained relatively constant for roughly 40 min. After 40 minutes, we observed a sharp increase in the total fluorescence intensity, which leveled off after around 15 min. This rapid onset coincided with the morphological transition from colloids to mainly fibers. After all the fuel had depleted, around 60 min, the intensity decreased somewhat, as we would expect due to the loss of anhydride. Cryo-TEM showed colloids after 3 minutes of fuel addition, few fibers around the transition time, and a clear fiber predominance after fuel depletes (Fig. S5†).
To better understand the origin of the different disassembly pathways, we analyzed the molecular composition of the assemblies by 1H-NMR (proton nuclear magnetic resonance). We used the fact that self-assembled peptides have a reduced transversal relaxation time, resulting in long correlation times and a broadening of the signal that gets hidden in the baseline. This means that peptides that participate in the assembly become NMR-silent, while soluble peptides remain NMR-visible.
In the case of P1, as pointed out by the absorbance measurements and the macroscopy images, the number of assemblies formed after fuel addition was low. 1H-NMR also confirmed that more than 95% of the peptide (either as precursor or product form) were in the solution state. The number of assemblies was within the error range of the technique, and therefore, we focused on the analysis of the composition of P2–P4.
P2 showed that the composition of the assemblies was mainly anhydride. For example, 5 minutes after the addition of 25 mM fuel to 10 mM of P2, we found that roughly 9.4 mM of the peptide (either as the product or as a precursor) was NMR-visible. In other words, 0.6 mM of the peptide was in the assembled state (Fig. S8†). This concentration value is lower than the 1.7 mM of anhydride observed by HPLC (Fig. 1C, the marker at 5 minutes), which means there was still 1.1 mM anhydride in the solution. This anhydride concentration value coincided with the solubility value determined for the anhydride of P2 (ESI methods and Fig. S8†). Since the solubility of the precursor is much higher than the solubility of the anhydride, we assumed that, as long as there is still anhydride present in the solution, there is no or only a small amount of precursor in the assembly. The amount of anhydride in the assembled state was always below the concentration of anhydride determined by HPLC (Fig. S8†). Thus, the assemblies always comprised mostly anhydride until they disappeared at around 35 min (Fig. 2A).
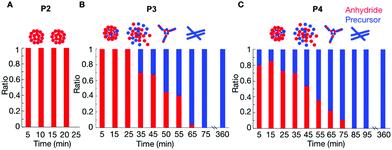 | ||
| Fig. 2 The relative composition of the assemblies over time as determined by HPLC and NMR for 10 mM P2 (A), 10 mM P3 (B) and 10 mM P4 (C) after the addition of 25 mM of fuel. | ||
The composition of the assemblies by P3 and P4 revealed a significantly different evolution compared to P2. In the first 35 minutes after adding 25 mM fuel to 10 mM of P3, there was only anhydride in the assemblies (Fig. 2B). For example, after 5 minutes, 6.6 mM of the peptide was NMR-visible, and there was 3.4 mM peptide in the assembled state (Fig. S9†), which was lower than the 3.7 mM anhydride detected from HPLC. In other words, 0.3 mM anhydride was in solution, and the assemblies are mainly composed of anhydride. After 45 minutes, the peptide concentration in the assemblies was higher than the anhydride concentration from HPLC. That means part of the precursor had coassembled with the anhydride. The ratio of anhydride to precursor continuously decreased until all anhydride had hydrolyzed. Even then, plenty of assemblies were present that comprised exclusively precursor.
In the case of P4, the more hydrophobic peptide, the coassembly between precursor and product occurred from the beginning of the cycle. The NMR signal after 5 minutes showed that the assemblies comprised a mixture of 80–20% anhydride-precursor, respectively (Fig. 2C and Fig. S10†). The maximum ratio of anhydride to precursor was found roughly after 15 minutes of fuel addition, after which it constantly decreased until all anhydride had gone. At that time, the assemblies comprised precursor exclusively and remained for at least 6 hours.
The data above suggests that for P1, there are almost no assemblies because of the high solubility of its anhydride. Of P2, with a lower solubility, the corresponding anhydride assembles into colloids that are composed of exclusively anhydride. Deactivation of the anhydride, through hydrolysis occurs predominantly in solution which is in line with previously described colloids.26,30 The hydrolysis results in the gradual dissolution of the colloids as evidenced by confocal microscopy. Peptide P3 has a lower solubility, and also forms colloids composed of anhydride, but some coassembly with the precursor was also observed. After the first 30 minutes, the colloids of P3 do not gradually dissolve when fuel is depleted. Instead, they transition into kinetically trapped fibers. The confocal images showed that the morphological transition occurred around 50 minutes. From the NMR experiments, we can conclude that at this time, almost 50% precursor is present in the assemblies.
Further decreasing the solubility from P3 to P4 results in more coassembly of the precursor with anhydride from the beginning, and the transition of the colloids to fibers occurred earlier at around 40 minutes. At that time also around 50% precursor is present in the assemblies.
For peptides P3 and P4, we hypothesize that the hydrolysis can occur on the assembly, and that some of the precursors remains trapped in the colloids after hydrolysis. The fact that hydrolysis occurs on the colloids, as opposed to in solution, is further corroborated by the low solubility of P3 and P4 anhydride (0.4 mM, 0.2 mM, Fig. S5†). The accumulation of precursor results in an increase of the negative charges on the assembly. We hypothesize that when the fraction of anhydride in the assemblies falls around roughly 60%, the amount of negative charges induces a transition from colloids to fibers to redistribute the charges and increase the assembly's surface area.
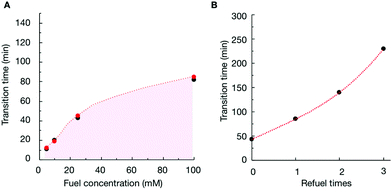
To verify that the change in the assemblies’ composition was responsible for the morphological transitions, we analyzed the samples of P4 (10 mM) with confocal microscopy when fueled with various EDC concentrations (Fig. S11–S13†). We determined the time at which the colloids transformed into fibers for each experiment (the transition time) and plotted it as a function of the concentration of fuel added (Fig. 3A). From the plot, it became clear that the transition time increased with increasing fuel. For example, when we decreased the fuel concentration to 10 mM, the colloids transformed into fibers around 19 minutes (Fig. 3A and Fig. S12†). When we combined the transition time with the data of our HPLC and NMR-based experiments (Fig. 3A), an interesting correlation emerged, i.e., the morphological transition in each experiment occurred at the time point where the ratio of anhydride to precursor in the assemblies was roughly 55%. In other words, when the majority of the peptides in the assemblies were in the anhydride state, colloids were stable. However, when the ratio reached a threshold, fibers emerged from the colloids, which kept on growing until the colloids had disappeared entirely. It is worth mentioning that the addition of new fuel to the colloids (i.e., before the transition time) would extend the time for which the colloids were present (Fig. 3B and Fig. S14†). In other words, we could save the colloids from converting to the fibers by keeping the anhydride to precursor ratio high. However, the application of fuel after the transition occurred did not reverse the fibers to colloids (Fig. S15†).
From these combined results, we present a tentative mechanism that is responsible for the morphological transition of P3 and P4 and the formation of colloids of P2. Peptides P2, P3, and P4 form colloids after the application of fuel. The anhydride of P2 has a relatively high solubility that we determined to be 1.1 mM, whereas the solubility of anhydride of P3 and P4 is lower. In line with previous work, the colloids protect their anhydride building blocks from hydrolysis, and the hydrolysis thus occurs on the anhydride that remains in solution or on the surface of the colloids. We could fit the evolution of the anhydride of P2 (and also of P1) well with a kinetic model that considers the hydrolysis occurring in solution (Fig. 1C and Fig. S2†). In other words, the hydrolysis occurs in solution, after which hydrolyzed anhydride is replaced with anhydride that disassembles from the colloids. Thus, disassembly is relatively fast compared to hydrolysis.
In contrast, the kinetic model that considers hydrolysis happening in solution could not fit the evolution of the anhydride profile of P3 and P4. Part of the hydrolysis occurs in solution. However, the anhydride is not replaced by anhydride from the colloids. The energy barrier for disassembly is high due to its ability to form hydrogen bonds. Thus, the anhydride in the colloids hydrolyzes through a surface erosion mechanism. Because a surface erosion mechanism is drastically slower than an “in-solution-hydrolysis” mechanism, the lifetime of these colloids is much greater than those of P2. The high energy barrier for disassembly is further corroborated because the precursor also did not fully disassemble. NMR experiments showed a large amount of precursor present in the assemblies, which we did not see in the colloids of P2. We hypothesize that the accumulation of the precursor in the colloids also drives its morphological transition into the fibers. With the accumulation of the precursor, the colloid accumulates anionic carboxylates. When a threshold of charge density is reached, the charge–charge repulsion exceeds the attractive interactions forcing a rearrangement into fibers that can better accommodate the high charge density.
In conclusion, we designed a family of peptides that self-assemble at the expense of a chemical fuel addition into similar assemblies but show a different disassembly pathway. In one case, the colloids can disassemble and dissolve in water when fuel depletes. In the other case, the colloids transition into fibers that remain kinetically trapped long after fuel depletion. We propose a tentative mechanism that is related to the degree of coassembly between precursor and product. Understanding the mechanism allows us to control when colloids transition into fibers by the amount of fuel added to the precursor solution. Our findings demonstrate the importance of considering the disassembly pathway when designing new chemically fueled self-assembling systems.
Conflicts of interest
There are no conflicts to declare.Acknowledgements
K. D. thanks the financial support from the China Scholarship Council. J. B. and M. T. S. are grateful for funding by the European Research Council (ERC starting grant 852187). J. B. acknowledge funding from the Max Planck School Matter to Life supported by the German Federal Ministry of Education and Research (BMBF) in collaboration with the Max Planck Society.Notes and references
- G. M. Whitesides and M. Boncheva, Proc. Natl. Acad. Sci. U. S. A., 2002, 99, 4769–4774 CrossRef CAS PubMed.
- G. M. Whitesides and B. Grzybowski, Science, 2002, 295, 2418–2421 CrossRef CAS PubMed.
- H. Dong, S. E. Paramonov and J. D. Hartgerink, J. Am. Chem. Soc., 2008, 130, 13691–13695 CrossRef CAS PubMed.
- C. J. Bowerman, W. Liyanage, A. J. Federation and B. L. Nilsson, Biomacromolecules, 2011, 12, 2735–2745 CrossRef CAS PubMed.
- C. J. Bowerman, D. M. Ryan, D. A. Nissan and B. L. Nilsson, Mol. BioSyst., 2009, 5, 1058–1069 RSC.
- G. L. Eakins, J. K. Gallaher, R. A. Keyzers, A. Falber, J. E. A. Webb, A. Laos, Y. Tidhar, H. Weissman, B. Rybtchinski, P. Thordarson and J. M. Hodgkiss, J. Phys. Chem. B, 2014, 118, 8642–8651 CrossRef CAS PubMed.
- C. Gribbon, K. J. Channon, W. Zhang, E. F. Banwell, E. H. C. Bromley, J. B. Chaudhuri, R. O. C. Oreffo and D. N. Woolfson, Biochemistry, 2008, 47, 10365–10371 CrossRef CAS PubMed.
- V. A. Kumar, B. K. Wang and S. M. Kanahara, Exp. Biol. Med., 2016, 241, 899–908 CrossRef CAS PubMed.
- A. P. Schoen, B. Hommersom, S. C. Heilshorn and M. E. Leunissen, Soft Matter, 2013, 9, 6781–6785 RSC.
- G. J. Brouhard and L. M. Rice, Nat. Rev. Mol. Cell Biol., 2018, 19, 451–463 CrossRef CAS PubMed.
- M. Dogterom and G. H. Koenderink, Nat. Rev. Mol. Cell Biol., 2019, 20, 38–54 CrossRef CAS PubMed.
- J. M. Neuhaus, M. Wanger, T. Keiser and A. Wegner, J. Muscle Res. Cell Motil., 1983, 4, 507–527 CrossRef CAS PubMed.
- J. Boekhoven, A. M. Brizard, K. N. Kowlgi, G. J. Koper, R. Eelkema and J. H. van Esch, Angew. Chem., Int. Ed., 2010, 49, 4825–4828 CrossRef CAS PubMed.
- B. A. Grzybowski and W. T. Huck, Nat. Nanotechnol., 2016, 11, 585–592 CrossRef CAS PubMed.
- R. Merindol and A. Walther, Chem. Soc. Rev., 2017, 46, 5588–5619 RSC.
- S. De and R. Klajn, Adv. Mater., 2018, 30, 1706750 CrossRef PubMed.
- B. Rieß, R. K. Grötsch and J. Boekhoven, Chem, 2020, 6, 552–578 Search PubMed.
- A. Sorrenti, J. Leira-Iglesias, A. J. Markvoort, T. F. A. de Greef and T. M. Hermans, Chem. Soc. Rev., 2017, 46, 5476–5490 RSC.
- J. Boekhoven, W. E. Hendriksen, G. J. Koper, R. Eelkema and J. H. van Esch, Science, 2015, 349, 1075–1079 CrossRef CAS PubMed.
- M. Tena-Solsona, C. Wanzke, B. Riess, A. R. Bausch and J. Boekhoven, Nat. Commun., 2018, 9, 2044 CrossRef PubMed.
- S. Maiti, I. Fortunati, C. Ferrante, P. Scrimin and L. J. Prins, Nat. Chem., 2016, 8, 725–731 CrossRef CAS PubMed.
- J. Leira-Iglesias, A. Sorrenti, A. Sato, P. A. Dunne and T. M. Hermans, Chem. Commun., 2016, 52, 9009–9012 RSC.
- J. Leira-Iglesias, A. Tassoni, T. Adachi, M. Stich and T. M. Hermans, Nat. Nanotechnol., 2018, 13, 1021–1027 CrossRef CAS PubMed.
- L. Heinen and A. Walther, Sci. Adv., 2019, 5, eaaw0590 CrossRef CAS PubMed.
- E. A. J. Post and S. P. Fletcher, Chem. Sci., 2020, 11, 9434–9442 RSC.
- M. Tena-Solsona, B. Riess, R. K. Grotsch, F. C. Lohrer, C. Wanzke, B. Kasdorf, A. R. Bausch, P. Muller-Buschbaum, O. Lieleg and J. Boekhoven, Nat. Commun., 2017, 8, 15895 CrossRef CAS PubMed.
- L. S. Kariyawasam and C. S. Hartley, J. Am. Chem. Soc., 2017, 139, 11949–11955 CrossRef CAS PubMed.
- K. Dai, J. R. Fores, C. Wanzke, B. Winkeljann, A. M. Bergmann, O. Lieleg and J. Boekhoven, J. Am. Chem. Soc., 2020, 142, 14142–14149 CrossRef CAS PubMed.
- F. Schnitter and J. Boekhoven, ChemSystemsChem, 2021, 3, e2000037 CrossRef CAS.
- B. Riess, C. Wanzke, M. Tena-Solsona, R. K. Grotsch, C. Maity and J. Boekhoven, Soft Matter, 2018, 14, 4852–4859 RSC.
Footnote |
| † Electronic supplementary information (ESI) available. See DOI: 10.1039/d1nr04954b |
| This journal is © The Royal Society of Chemistry 2021 |

