A phase-transfer catalyst-based nanoreactor for accelerated hydrogen sulfide bio-imaging†
Panfei
Xing‡
ab,
Yiming
Niu‡
ac,
Jiacheng
Li
a,
Daping
Xie
a,
Huiqun
Zhou
a,
Jiaxi
Chen
 a,
Lei
Dong
 *c and
Chunming
Wang
 *a
*a
aState Key Laboratory of Quality Research in Chinese Medicine, Institute of Chinese Medical Sciences, University of Macau, Taipa, Macau SAR, China. E-mail: cmwang@umac.mo
bKey Laboratory of Natural Medicine and Immuno-Engineering, Henan University, Kaifeng 475004, People's Republic of China
cState Key Laboratory of Pharmaceutical Biotechnology, School of Life Sciences, Nanjing University, Nanjing, Jiangsu 210023, China. E-mail: leidong@nju.edu.cn
First published on 25th October 2021
Abstract
Hydrogen sulfide (H2S) is an important signaling molecule in various biological processes; however, its real-time monitoring in living cells is hampered by long detection time for current fluorescent probes. To overcome this challenge, we designed a phase-transfer catalyst (PTC) approach to accelerate the reaction between the probe and the analyte by conjugating common fluorescent probes – mostly hydrophobic small molecules – with an amphiphilic PEG–PPG–PEG polymer, enabling the controllable assembly of H2S nanoprobes in an aqueous solution. The PEG block helps to establish a PTC microenvironment that endows the assembled nanoprobes with a significantly reduced detection time (3–10 min; versus 20–60 min for small-molecule probes). Based on this approach, we synthesised two nanoprobes of different wavelengths, DS-Blue-nano and DN-Green-nano, which can sensitively detect H2S in living macrophage cells with bright fluorescence starting at as early as 7 min and reaching stability at 15 min. These data suggest PTC-based nanoprobes as a new and generic approach for constructing sensitive fluorescent probes for the real-time imaging of H2S, and perhaps other molecules in future, under biological conditions.
Introduction
Hydrogen sulfide (H2S) is a versatile gaseous signal molecule produced endogenously through both enzymatic and non-enzymatic processes in living systems.1 H2S plays an essential role in vascular smooth muscle relaxation, neurotransmitter regulation, redox status modulation and many other physiological processes.2 Its abnormal changes are associated with Alzheimer's disease, diabetes, and cardiovascular diseases.3 Developing chemical tools to detect H2S in subcellular microenvironments will provide powerful insight into understanding pathogenic mechanisms. Nevertheless, despite the development of fluorescent probes for H2S for decades, one substantial and common challenge still facing real-time H2S monitoring in living cells is particularly a long detection time (>20 min) in aqueous solutions.4–8 Since metabolic reactions take place fast in the physiological system, such long detection times may easily lead to artifacts,9e.g., unintended detection of re-synthesized or cleared H2S. Therefore, shortening the detection time to realise ‘real-time’ detection (e.g., within 5 min) of H2S in living systems is critical for understanding the genuine action of this gaseous molecule in subcellular microenvironments.9The mechanisms of reaction-based fluorescent probes for detecting H2S mainly include: (i) disulfide exchange, (ii) aryl nitro thiolysis and (iii) azide reduction,10–13 all based on the high reducibility and nucleophilicity of H2S. However, in aqueous solutions, H2S is primarily in the monoanionic form, HS−.14 Moreover, fluorescent probes are typically constructed from hydrophobic dyes with large π-conjugation. The hydrophobic probes and hydrophilic analyte (HS−) may have low reaction efficiency, which is a possible reason for the long detection time. Although co-organic solvents are commonly used to solve this issue, they can only be used in preliminary tests without living cells due to their obvious toxicity to cells.
To solve this problem, we proposed the conjugation of common fluorescent probes for H2S – mostly hydrophobic small molecules – with an amphiphilic triblock poly(ethylene glycol)–poly(propylene glycol)–poly(ethylene glycol) (PEG–PPG–PEG) copolymer. In aqueous solutions, the polymer-probe conjugates self-assemble into nanoparticles via the micelle packing mechanism.15 Here, PEG plays the role of a phase transfer catalyst (PTC)16–19 to increase the reaction efficiency between the hydrophobic probe and hydrophilic HS−, while PPG and probes offer hydrophobic units. In this study, we set out to construct the PTC-based nanoprobes, validate their efficiency in detecting H2S in aqueous solutions, and finally assess their potential in living cell culture. Our data suggest that the PTC-based nanoprobes were more sensitively and effectively image H2S than conventional probes, thus shortening the detection time from ∼20–60 min to ∼3–10 min (Scheme 1).
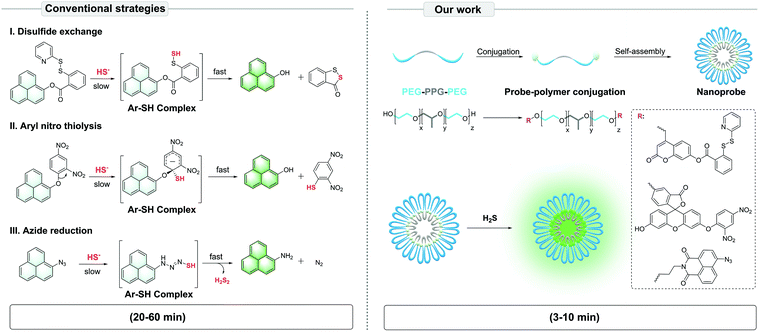 | ||
| Scheme 1 Illustration of the PTC-based approach to construct self-assembled nanoprobes for H2S, based on conventional strategies of fluorescent nanoprobe development. | ||
Experimental methods
Materials and instruments
All the solvents and chemical reagents were from commercial sources, analytical grade and used without further purification. 1H NMR and 13C NMR spectra were recorded on a Bruker 600 MHz AVANCE III spectrometer with chemical shifts reported in ppm at room temperature. DLS analyses were performed using a Malvern Zetasizer Nano ZS (UK). Absorption spectra were collected on a HACH DR6000 UV/VIS Spectrophotometer (USA). Fluorescence spectra were obtained on a Thermo Scientific Lumina Fluorescence Spectrometer (USA). The fluorescence imaging of cells was performed using a Leica DMi8 fluorescence microscope. Each experiment was observed using 325–375 nm exciter, 435–485 nm emitter for the blue channel, and 460–500 nm exciter, 512–542 nm emitter for the green channel.Preparation of nanoprobes
Probe–polymer was dissolved in THF (50 μL) and swiftly added into an aqueous solution (5 mL) under ultrasound. Nitrogen was then used to dislodge THF, obtaining an aqueous solution of the nanoprobe.Characterization of polymeric micelles
The mean particle size and polydispersity index (PDI) of nanoreactors were determined by dynamic light scattering (DLS). The polymeric micelle concentrations were kept at 0.5 mg mL−1 for DLS measurements. The measurements were performed in triplicate for each sample. The nanoparticle tracking analysis technique (NanoSight NS500) was applied to visualize the nanoprobe dispersed in an aqueous solution and quantified the relevant number weighted distributions.Results and discussion
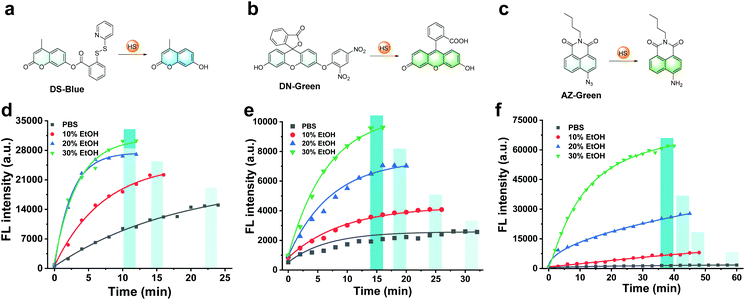
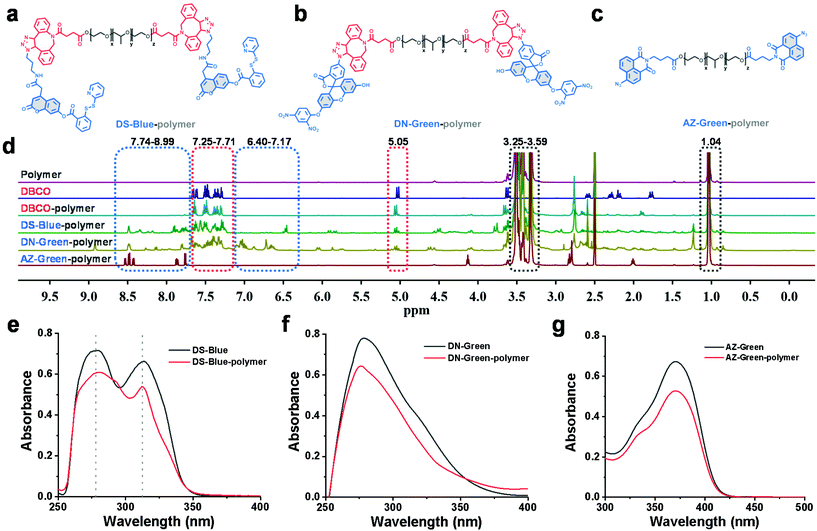
First, our data confirmed a common concern that fluorescent probes reacted to the analyte H2S much slower in an aqueous solution than in an organic co-solvent system. We examined the response of common fluorescent probes to H2S in absolute phosphate buffered saline (PBS; 10 mM, pH 7.4) or mixtures of ethanol in PBS (10%, 20%, and 30%, respectively, v/v). As shown in Fig. 1, we synthesized three fluorescent probes DS-Blue, DN-Green, and AZ-Green, representing the three detection principles of disulfide exchange, aryl nitro thiolysis, and azide reduction, respectively.20–22 With the addition of 20 equivalents of H2S (Na2S as the donor) to each solution of the three probes in absolute PBS (10 mM, 7.4), reaction times of 22 min, 30 min, and 60 min were observed. However, it decreased with the gradual increase in ethanol from 10% to 30% in a PBS solution (10 mM, pH 7.4, v/v). Also, a higher percentage of ethanol always meant a shorter reaction time. These results suggested that the organic co-solvent solution accelerated the reaction time, agreeing with our assumption that the probe hydrophobicity could account for their low reactive efficiency for the hydrophilic HS−.To form a self-assembled nanoreactor of PEG in aqueous solutions, the amphiphilic copolymer PEG–PPG–PEG was selected as the key conjugation unit, which has hydrophilic PEG blocks and hydrophobic PPG blocks.23DS-Blue-polymer and DN-Green-polymer conjugations were obtained by grafting DS-Blue-Azido and DN-Green-Azido onto PEG–PPG–PEG in two steps: first to produce dibenzocyclooctyne (DBCO)-polymer grafted by the EDC/NHS coupling chemistry reaction between DBCO and PEG–PPG–PEG, followed by grafting of DS-Blue-Azido and DN-Green-Azido onto the DBCO-polymer through a click reaction. AZ-Green was obtained directly by the coupling chemistry reaction between AZ-Green-COOH and PEG–PPG–PEG. The final structures of DS-Blue-polymer, DN-Green-polymer, and AZ-Green-polymer are shown in Fig. 2a–c. The conjugate formation of the DBCO-polymer and probe–polymer was confirmed by Fourier-transform infrared spectroscopy (FT-IR) and 1H NMR spectroscopy (Fig. 2d). FT-IR spectra showed a markedly enhanced absorption at 1735 cm−1 (C![[double bond, length as m-dash]](https://www.rsc.org/images/entities/char_e001.gif) O stretch) and decreased signal at 3450 cm−1 (O–H stretch), confirming the successful modification of hydroxyl groups on the polymer chain are substituted by carbonyl groups and convert to esters, compared with the initial polymer PEG–PPG–PEG (Fig. S30†). The 1H NMR spectrum of DBCO-polymer showed two types of characteristic peaks at 1.04, and 3.25–3.59 (attributed to PEG–PPG–PEG, indicated by black box lines in the spectrum) and 5.05 and 7.25–7.71 (attributed to DBCO, red box lines). In addition to these two kinds of characteristic peaks, DS-Blue-polymer and DN-Green-polymer showed novel peaks at 6.40–7.17 and 7.74–8.99 (attributed to the aromatic peaks of DS-Blue-Azido and DN-Green-Azido, blue box lines). The AZ-Green-polymer showed combined peaks of PEF-PPG-PEG (black box lines) and AZ-Green-COOH (blue box lines). These peak changes confirmed successful conjugation between fluorescent probes and PEG–PPG–PEG. Also, the absorbance of the probe–polymer conjugation matched well with the characteristic peaks of the free probe, indicating successful conjugation between the fluorescent probes and PEG–PPG–PEG polymer consistent with FT-IR and 1H NMR results (Fig. 2e–g).
O stretch) and decreased signal at 3450 cm−1 (O–H stretch), confirming the successful modification of hydroxyl groups on the polymer chain are substituted by carbonyl groups and convert to esters, compared with the initial polymer PEG–PPG–PEG (Fig. S30†). The 1H NMR spectrum of DBCO-polymer showed two types of characteristic peaks at 1.04, and 3.25–3.59 (attributed to PEG–PPG–PEG, indicated by black box lines in the spectrum) and 5.05 and 7.25–7.71 (attributed to DBCO, red box lines). In addition to these two kinds of characteristic peaks, DS-Blue-polymer and DN-Green-polymer showed novel peaks at 6.40–7.17 and 7.74–8.99 (attributed to the aromatic peaks of DS-Blue-Azido and DN-Green-Azido, blue box lines). The AZ-Green-polymer showed combined peaks of PEF-PPG-PEG (black box lines) and AZ-Green-COOH (blue box lines). These peak changes confirmed successful conjugation between fluorescent probes and PEG–PPG–PEG. Also, the absorbance of the probe–polymer conjugation matched well with the characteristic peaks of the free probe, indicating successful conjugation between the fluorescent probes and PEG–PPG–PEG polymer consistent with FT-IR and 1H NMR results (Fig. 2e–g).
The molar concentrations of fluorescent probes in the conjugates, DS-Blue-polymer, DN-Green-polymer, and AZ-Green-polymer (1 mg mL−1 for each group in DMSO) were calculated by the standard curve of each free probe in DMSO to be 40.23, 39.58, and 25.02 μM, respectively (Fig. S1–3†). Nanoprobes were prepared through simple nanoprecipitation. Dynamic light scattering (DLS) revealed that the nanoprobes DS-Blue-Nano, DN-Green-Nano, and AZ-Green-Nano were successfully prepared and presented narrow size distributions with average diameters of 161.2, 194.1, and 178.7 nm, respectively (Fig. 3a). From the representative SEM image of DS-Blue-Nano, DN-Green-Nano, and AZ-Green-Nano, the size of nanoprobes was ∼200 nm (Fig. S4a†), consistent with the DLS data. Similar results were further confirmed by the nanoparticle tracking analysis and the relevant number weighted distributions (Fig. S4b†). Next, we examined the fluorescent response of the nanoprobes towards H2S. With the addition of 5, 10, or 20 μM H2S, the time-course of DS-Blue-Nano, DN-Green-Nano, and AZ-Green-Nano (10 μM for each) showed that the fluorescence intensity reached a steady state after 3, 5, and 10 min, respectively (Fig. 3d–f). Compared with free fluorescent probes of DS-Blue, DN-Green, and AZ-Green, the constructed nanoprobes showed a significantly reduced reaction time. Also, a non-covalent complex formed by the addition of PEG derivatives was found to produce similar results in the detection of H2S from literature reports.24–26 All these data confirmed the function of PEG in accelerating the reaction of the probe to H2S. In addition, the fluorescence intensity of DS-Blue-Nano, DN-Green-Nano, and AZ-Green-Nano in response to H2S is dose-dependent (Fig. 3g–i). Also, the fluorescence enhancement of DS-Blue-Nano, DN-Green-Nano, and AZ-Green-Nano to H2S shows excellent linear responses up to 75 μM, 100 μM, and 85 μM, respectively (Fig. S5–7†). The detection limits (LODs) of DS-Blue-nano, DN-Green-nano, and AZ-Green-nano for H2S were calculated to be 20.3 nM, 10.2 nM, and 36.0 nM, respectively, using the equation 3δ/k.27–29 The limits of quantification (LOQ) of DS-Blue-nano, DN-Green-nano, and AZ-Green-nano for H2S were calculated to be 67.7 nM, 33.9 nM, and 119.9 nM, respectively.30 To test the selectivity of these nanoprobes to H2S over other analytes, we had chosen Na+, K+, Cl−, Br−, CO32−, SO42−, H2PO4−, CH3COO−, HCO3−, NO3−, Cys, Hcy, and GSH (200 μM for each) as interferents. As shown in Fig. S8,† almost no fluorescent change was found in the presence of these analytes, Implying that these analytes did not interfere with the detection process of DS-Blue-nano, DN-Green-nano, and AZ-Green-nano for H2S.
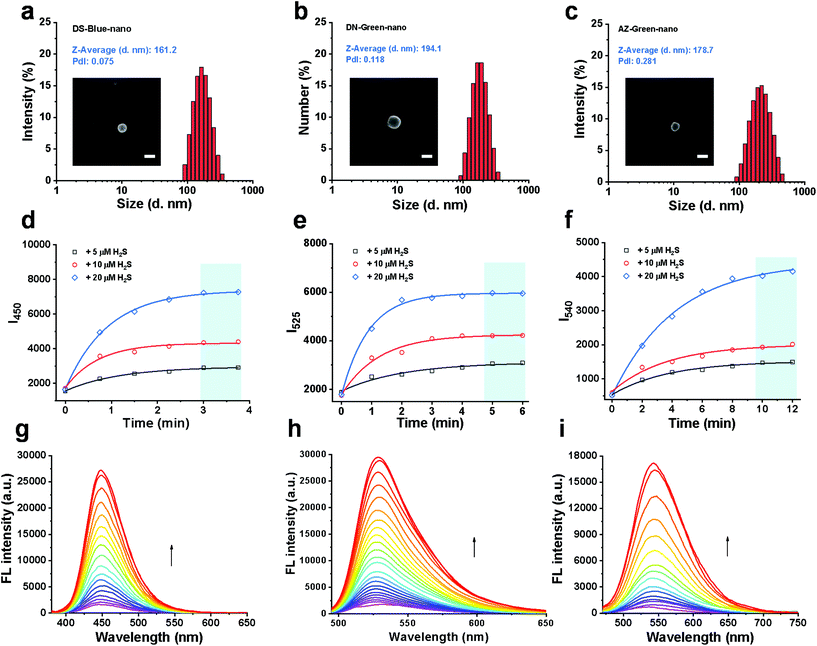 | ||
| Fig. 3 Construction and validation of PTC-based nanoprobes of DS-Blue-Nano, DN-Green-Nano, and AZ-Green-Nano. (a–c) Particle size distributions of DS-Blue-Nano, DN-Green-Nano, and AZ-Green-Nano measured by DLS, PdI < 0.3. The insets in Fig. 3a–c show the SEM images of the samples and scale bars correspond to 200 nm; (d–f) time-course of DS-Blue-Nano, DN-Green-Nano, and AZ-Green-Nano (10 μM for each) with the addition of H2S (5 μM, black; 10 μM, red; 20 μM, blue) in PBS (10 mM, pH 7.4); (g–i) fluorescent titration of DS-Blue-Nano, DN-Green-Nano, and AZ-Green-Nano (10 μM for each) in response to different concentrations of H2S in PBS (10 mM, pH 7.4). | ||
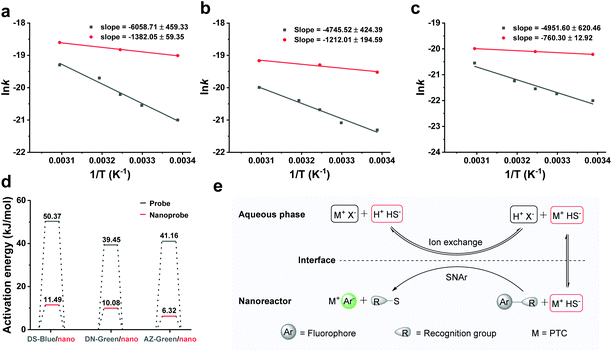
We next examined the thermal behaviour of the free probes and nanoprobes (Fig. 4a–c). The thermal activation energies of DS-Blue-Nano, DN-Green-Nano, and AZ-Green-Nano were calculated from the fitting of the Arrhenius plot as 11.49 ± 0.49, 10.08 ± 1.62, and 6.32 ± 0.11 kJ mol−1 (indicated with red bar), respectively. In contrast, these were calculated to be 50.37 ± 3.82, 39.45 ± 3.53, and 41.17 ± 5.16 kJ mol−1 for DS-Blue, DN-Green, and AZ-Green, respectively (Fig. 4d). In the latter case, they all showed higher activation energies than nanoreactors. In the Arrhenius equation, the activation energy is defined as the minimum energy required to initiate a chemical reaction. Based on these findings, we proposed that PEG as a PTC in nanoreactors allows the reaction of the hydrophobic fluorescent probes and hydrophilic HS− of two different immiscible phases via facilitating the transfer of HS− from the interface. And the catalyst regenerates again after the reaction is complete, continuing the catalytic cycle (Fig. 4e). PEG undergoes dissolution in the aqueous phase and anion exchange with HS− dissolved in the aqueous phase. The formed ion pair (M+HS−) then passes through the liquid–liquid interface and undergoes diffusion from the interface to the lipophilic phase. In the lipophilic phase, the anion from the ion pair (M+HS−) is nucleophilic, and reacts with the organic fluorescent probes with lower reaction barrier and forms subsequent fluorescent products.31,32
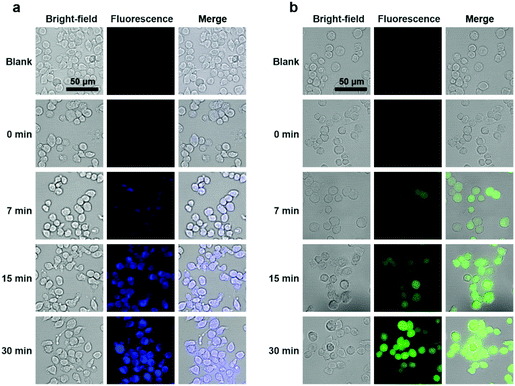
To explore the potential applications of the PTC-based nanoprobes in living cells, we used self-assembled DS-Blue-nano and DN-Green-nano as proof-of-concept model probes to image H2S in living murine macrophages (RAW 264.7) and breast cancer cell line (MCF-7). First, cell viability tests showed that both nanoprobes exhibited high biocompatibility at a dose of up to 40 μM in RAW 264.7 cells and MCF-7 cells after a 24 h incubation period (Fig. S10†).33 Then, cell imaging experiments demonstrated that DS-Blue-nano and DN-Green-nano afforded bright fluorescence signals in blue and green channels from as early as 7 min after their addition to the cells pre-treated with H2S for 1 h (Fig. 5 and Fig. S11†). The fluorescence signals became stable at 15 min and showed no significant changes after a longer incubation time (up to 30 min). Also, DS-Blue-nano and DN-Green-nano showed similar tendency for fast detection in these two cells. These results highlighted the high sensitivity of PTC-based nanoprobes and rapid detection of H2S in living cells.
Conclusions
In summary, we have developed an effective and generic approach to increase the reaction speed for fluorescent probes to detect H2S, enabling accelerated, sensitive, and real-time imaging of H2S in living cells. The core of this approach entails the transformation of common H2S fluorescent probes into phase-transfer catalyst-based nanoprobes, through the chemical conjugation of the probes with an amphiphilic polymer that induces self-assembly into colloidal structures. This nanoreactor approach provides a straightforward and effective solution to reduce the activation barrier typically existing in H2S fluorescent probes and can be applied to probes designed from different reaction principles, hence showing the potential to overcome the long-lasting, common challenge for the bioimaging of H2S – an important physiological gaseous molecule.Author contributions
C.W., L.D., P.X., and Y.N. designed the study. P.X. performed major chemical experiments. Y.N performed major biological experiments. J.L., D.X., H.Z., and J.C. performed experiments. P.X., Y.N., and C.W. drafted the manuscript. C.W. provided funding supports. All authors contributed to data analysis and manuscript drafting.Conflicts of interest
There are no conflicts to declare.Acknowledgements
This study was funded by the Science and Technology Development Fund, Macau SAR (File no. 0018/2019/AFJ, 0097/2019/A2), the University of Macau Research Committee (MYRG2019-00080-ICMS), the National Natural Science Foundation of China (32000935) and China Postdoctoral Science Foundation funded project (Special Program, 2020TQ0140). We thank Ms Yuwei Li for her technical assistance in the process of manuscript revision.Notes and references
- H. Peng, Y. Cheng, C. Dai, A. L. King, B. L. Predmore, D. J. Lefer and B. Wang, Angew. Chem., Int. Ed., 2011, 50, 9672–9675 CrossRef CAS PubMed.
- Y. F. Njie-Mbye, C. Opere, M. Chitnis and S. Ohia, Front. Physiol., 2012, 3, 295 CAS.
- J.-y. Zhang, Y.-p. Ding, Z. Wang, Y. Kong, R. Gao and G. Chen, Med. Gas Res., 2017, 7, 113 CrossRef CAS PubMed.
- J. Kang, F. Huo and C. Yin, Dyes Pigm., 2017, 146, 287–292 CrossRef CAS.
- Y. L. Pak, J. Li, K. C. Ko, G. Kim, J. Y. Lee and J. Yoon, Anal. Chem., 2016, 88, 5476–5481 CrossRef CAS PubMed.
- Y. Ji, L.-J. Xia, L. Chen, X.-F. Guo, H. Wang and H.-J. Zhang, Talanta, 2018, 181, 104–111 CrossRef CAS PubMed.
- C. S. Park, T. H. Ha, S.-A. Choi, D. N. Nguyen, S. Noh, O. S. Kwon, C.-S. Lee and H. Yoon, Biosens. Bioelectron., 2017, 89, 919–926 CrossRef CAS PubMed.
- A. R. Lippert, E. J. New and C. J. Chang, J. Am. Chem. Soc., 2011, 133, 10078–10080 CrossRef CAS PubMed.
- X. Jiang, L. Wang, S. L. Carroll, J. Chen, M. C. Wang and J. Wang, Antioxid. Redox Signal., 2018, 29, 518–540 CrossRef CAS PubMed.
- W. Xuan, C. Sheng, Y. Cao, W. He and W. Wang, Angew. Chem., Int. Ed., 2012, 51, 2282–2284 CrossRef CAS PubMed.
- D. A. Jose, R. Sakla, N. Sharma, S. Gadiyaram, R. Kaushik and A. Ghosh, ACS Sens., 2020, 5, 3365–3391 CrossRef CAS PubMed.
- H. Li, Y. Fang, J. Yan, X. Ren, C. Zheng, B. Wu, S. Wang, Z. Li, H. Hua, P. Wang and D. Li, Trends Anal. Chem., 2021, 134, 116117 CrossRef CAS.
- F. Yu, X. Han and L. Chen, Chem. Commun., 2014, 50, 12234–12249 RSC.
- V. S. Lin, W. Chen, M. Xian and C. J. Chang, Chem. Soc. Rev., 2015, 44, 4596–4618 RSC.
- S. Y. Lee, Y. Lee, S. Y. Chae, T. G. Park and C. H. Ahn, Macromol. Chem. Phys., 2010, 211, 692–697 CrossRef CAS.
- C. Mukhopadhyay, P. K. Tapaswi and R. J. Butcher, Org. Biomol. Chem., 2010, 8, 4720–4729 RSC.
- G. D. Yadav and B. G. Motirale, Org. Process Res. Dev., 2009, 13, 341–348 CrossRef CAS.
- D. E. Bergbreiter, J. Tian and C. Hongfa, Chem. Rev., 2009, 109, 530–582 CrossRef CAS PubMed.
- D. E. Bergbreiter, Chem. Rev., 2002, 102, 3345–3384 CrossRef CAS PubMed.
- B. Peng, W. Chen, C. Liu, E. W. Rosser, A. Pacheco, Y. Zhao, H. C. Aguilar and M. Xian, Chem. – Eur. J., 2014, 20, 1010–1016 CrossRef CAS PubMed.
- Z. Wu, D. Liang and X. Tang, Anal. Chem., 2016, 88, 9213–9218 CrossRef CAS PubMed.
- H.-Y. Liu, M. Zhao, Q.-L. Qiao, H.-J. Lang, J.-Z. Xu and Z.-C. Xu, Chin. Chem. Lett., 2014, 25, 1060–1064 CrossRef CAS.
- L. Yu and J. Ding, Chem. Soc. Rev., 2008, 37, 1473–1481 RSC.
- R. Wang, X. Gu, Q. Li, J. Gao, B. Shi, G. Xu, T. Zhu, H. Tian and C. Zhao, J. Am. Chem. Soc., 2020, 142, 15084–15090 CrossRef CAS PubMed.
- B. Shi, X. Gu, Z. Wang, G. Xu, Q. Fei, J. Tang and C. Zhao, ACS Appl. Mater. Interfaces, 2017, 9, 35588–35596 CrossRef CAS PubMed.
- R. Wang, K. Dong, G. Xu, B. Shi, T. Zhu, P. Shi, Z. Guo, W.-H. Zhu and C. Zhao, Chem. Sci., 2019, 10, 2785–2790 RSC.
- S. Gong, Z. Zheng, X. Guan, S. Feng and G. Feng, Anal. Chem., 2021, 93, 5700–5708 CrossRef CAS PubMed.
- S. Pei, J. Li, C. Zhang, W. Liang, G. Zhang, L. Shi, W. Wang, S. Shuang and C. Dong, Analyst, 2021, 146, 2138–2143 RSC.
- Z.-H. Zhang, S. Li, Y. Yan, J. Qu and J.-Y. Wang, New J. Chem., 2021, 45, 9756–9760 RSC.
- P. Sukhavattanakul and H. Manuspiya, Carbohydr. Polym., 2021, 254, 117442 CrossRef CAS PubMed.
- D. O. Katole and G. D. Yadav, Mol. Catal., 2019, 466, 112–121 CrossRef CAS.
- N. Patel, R. Sood and P. V. Bharatam, Chem. Rev., 2018, 118, 8770–8785 CrossRef CAS PubMed.
- C. Wang, G. N. Adrianus, N. Sheng, S. Toh, Y. Gong and D.-A. Wang, Biomaterials, 2009, 30(36), 6986–6995 CrossRef CAS PubMed.
Footnotes |
| † Electronic supplementary information (ESI) available. See DOI: 10.1039/d1nr04931c |
| ‡ These authors contributed equally. |
| This journal is © The Royal Society of Chemistry 2021 |

